. 2025 Jun 27;17(7):845.
doi: 10.3390/pharmaceutics17070845.

A Semi-Mechanistic Mathematical Model of Immune Tolerance Induction to Support Preclinical Studies of Human Monoclonal Antibodies in Rats

Affiliations

A Semi-Mechanistic Mathematical Model of Immune Tolerance Induction to Support Preclinical Studies of Human Monoclonal Antibodies in Rats

Paridhi Gupta et al. Pharmaceutics. .

Abstract

Background/Objectives: The administration of human monoclonal antibodies (mAb) in preclinical pharmacokinetics and toxicology studies often triggers an immune response, leading to the formation of anti-drug antibodies (ADA). To mitigate this effect, we have recently performed and reported on studies using short-term immunosuppressive regimens to induce prolonged immune tolerance towards a human mAb, erenumab, in rats. Here, we report on the development of a semi-mechanistic modeling approach that quantitatively integrates pharmacokinetic and immunogenicity assessments from immune tolerance induction studies to provide a framework for the simulation-based evaluation of different immune induction scenarios for the maintenance of prolonged immune tolerance towards human mAbs. Methods: The integrated pharmacokinetic/pharmacodynamic (PK/PD) modeling approach combined a semi-mechanistic model of the adaptive immune system to predict ADA formation kinetics with a population pharmacokinetic model to assess the impact of the time course of the ADA magnitude on the PK of erenumab in rats. Model-derived erenumab concentration-time profiles served as input for a quantitative system pharmacology-style semi-mechanistic model of the adaptive immune system to conceptualize the ADA response as a function of the kinetics of CD4+ T helper cells and T regulatory cells. Results: The model adequately described the observed ADA magnitude-time profiles in all treatment groups and reasonably simulated the kinetics of selected immune cells responsible for ADA formation. It also successfully captured the impact of tacrolimus/sirolimus immunomodulation on ADA formation, demonstrating that the regimen effectively suppressed ADA formations and induced immune tolerance. Conclusions: This work demonstrates the utility of modeling approaches to integrate pharmacokinetic and immunogenicity assessment data for the prospective planning of long-term toxicology studies to support the preclinical development of mAbs.

Keywords: anti-drug antibodies; immune tolerance; monoclonal antibodies; pharmacokinetics; population pharmacokinetic model; preclinical; semi-mechanistic model.


Conflict of interest statement

P.G. and B.M. declare no conflicts of interest. J.R. is an employee of EMD Serono and owns EMD Serono stock. V.J. is an employee of Bristol Myers Squibb and owns Bristol Myers Squibb stock.

Figures

Figure 1
Figure 1
Schematic representation of the study design and dosing strategy in all treatment groups of Study 1 and Study 2. Arrows indicate different dosing events: Red: Erenumab monomer; Pink: Erenumab aggregate; Green: MTX 5 mg/kg; Blue: MTX 3 mg/kg; Yellow: Sirolimus; Purple Tacrolimus. From [25].
Figure 2
Figure 2
Schematic representation of the pharmacokinetic and semi-mechanistic immune cell dynamics model structure (PK/ADA model). The acronyms are explained as follows: central: central compartment; CL: linear drug clearance; ADA: anti-drug antibody; SNi,k: signal:noise ratio (ADA magnitude) for ith animal at time k; SNcutoff: threshold of ADA magnitude beyond which the sample is considered ADA-positive; ND: naïve dendritic cell; MD: mature dendritic cell; NThlp: naïve CD4+ T helper cell; AThlp: activated CD4+ T helper cell; NTreg: naïve T regulatory cell; ATreg: activated T regulatory cell.
Figure 3
Figure 3
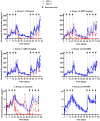
Erenumab serum concentration–time profiles in rats after weekly subcutaneous doses of erenumab in the induction (weeks 1–4) and rechallenge phase (weeks 9–12). The arrows represent the erenumab injection time points. Profiles are separated by the ADA status of the animals: ADA-positive: red; ADA-negative: blue. (a) Group 1.1 (control; 10 mg/kg erenumab monomer) without immunosuppression; (b) Group 1.2 (once weekly methotrexate 5 mg/kg with 10 mg/kg erenumab monomer); (c) Group 1.3 (one initial 3-day cycle of 3 mg/kg methotrexate with 10 mg/kg erenumab monomer); (d) Group 1.4 (tacrolimus/sirolimus combination regimen with 10 mg/kg erenumab monomer); (e) Group 2.1 (Control; 1 mg/kg erenumab aggregates); (f) Group 2.2 (tacrolimus/sirolimus combination regimen with 1 mg/kg erenumab aggregates). From [25].
Figure 4
Figure 4
ADA magnitude–time course assessed as a signal-to-noise ratio (S/N) in ADA-positive animals that received erenumab in the induction (weeks 1–4) and rechallenge phases (weeks 9–12): (a) Group 1.1 (control; 10 mg/kg erenumab monomer) without immunosuppression; (b) Group 1.2 (once weekly methotrexate 5 mg/kg with 10 mg/kg erenumab monomer); (c) Group 1.3 (one initial 3-day cycle of 3 mg/kg methotrexate with 10 mg/kg erenumab monomer); (d) Group 2.1 (Control; 1 mg/kg erenumab aggregates). The threshold for ADA positivity was set to S/N > 2 for Panels a, b, and c and S/N > 1.5 for Panel d. The arrows represent the erenumab injection time points. The ADA magnitude–time profiles for ADA-negative animals in the above treatment groups were below the ADA-positive threshold and are not displayed. All animals from Group 1.4 (tacrolimus/sirolimus combination regimen with 10 mg/kg erenumab monomer) and Group 2.2 (tacrolimus/sirolimus combination regimen with 1 mg/kg erenumab aggregates) were ADA-negative. Modified from [25].
Figure 5
Figure 5
Visual predictive check for the final population pharmacokinetic model: (a) 10 mg/kg erenumab monomer dosing without ADA response; (b) 10 mg/kg erenumab monomer dosing with ADA response; (c) 1 mg/kg erenumab aggregate dosing without ADA response; (d) 1 mg/kg erenumab aggregate dosing with ADA response.
Figure 6
Figure 6
Model simulations for activated CD4+ T helper cells and activated T regulatory cells, overlaid with the predicted and observed ADA magnitude–time profiles for the erenumab monomer without immunosuppression. (a) Group 1.1: ADA-positive rats; (b) Group 1.1: ADA-negative rats. In (b), the lines of different styles in the same color are used to distinguish different animals of the same group. Cell numbers are shown on a linear scale, and the ADA magnitude is shown on a logarithmic scale. The positive ADA threshold was set to 2. Arrows represent erenumab dosing times. Stars represent erroneous ADA measurements due to ADA bioanalytical assay limitations.
Figure 6
Figure 6
Model simulations for activated CD4+ T helper cells and activated T regulatory cells, overlaid with the predicted and observed ADA magnitude–time profiles for the erenumab monomer without immunosuppression. (a) Group 1.1: ADA-positive rats; (b) Group 1.1: ADA-negative rats. In (b), the lines of different styles in the same color are used to distinguish different animals of the same group. Cell numbers are shown on a linear scale, and the ADA magnitude is shown on a logarithmic scale. The positive ADA threshold was set to 2. Arrows represent erenumab dosing times. Stars represent erroneous ADA measurements due to ADA bioanalytical assay limitations.
Figure 7
Figure 7
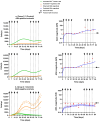
Model simulations for activated CD4+ T helper cells and activated T regulatory cells, overlaid with predicted and observed ADA magnitude–time profiles for the erenumab monomer with immunosuppression. (a1,a2) Group 1.2 animals that received 10 mg/kg of erenumab monomer along with 5 mg/kg methotrexate weekly from week 1 to week 7 with (a1) ADA-positive rats and (a2) ADA-negative rats. (b1,b2) Group 1.3 animals that received 10 mg/kg of erenumab monomer along with 3 mg/kg methotrexate on the first, second, and third day with (b1) ADA-positive rats and (b2) ADA-negative rats. (c) Group 1.4 ADA-negative animals that received 10 mg/kg of erenumab monomer along with tacrolimus/sirolimus. In (a2,b2,c), the lines of different styles in the same color are used to distinguish different animals of the same group. Cell numbers are shown on a linear scale, and ADA magnitude is shown on a logarithmic scale. The positive ADA threshold was set to 2. Arrows represent erenumab dosing times. The stars represent erroneous ADA measurements due to ADA bioanalytical assay limitations.
Figure 7
Figure 7
Model simulations for activated CD4+ T helper cells and activated T regulatory cells, overlaid with predicted and observed ADA magnitude–time profiles for the erenumab monomer with immunosuppression. (a1,a2) Group 1.2 animals that received 10 mg/kg of erenumab monomer along with 5 mg/kg methotrexate weekly from week 1 to week 7 with (a1) ADA-positive rats and (a2) ADA-negative rats. (b1,b2) Group 1.3 animals that received 10 mg/kg of erenumab monomer along with 3 mg/kg methotrexate on the first, second, and third day with (b1) ADA-positive rats and (b2) ADA-negative rats. (c) Group 1.4 ADA-negative animals that received 10 mg/kg of erenumab monomer along with tacrolimus/sirolimus. In (a2,b2,c), the lines of different styles in the same color are used to distinguish different animals of the same group. Cell numbers are shown on a linear scale, and ADA magnitude is shown on a logarithmic scale. The positive ADA threshold was set to 2. Arrows represent erenumab dosing times. The stars represent erroneous ADA measurements due to ADA bioanalytical assay limitations.
Figure 8
Figure 8
Model simulations for activated CD4+ T helper cells and activated T regulatory cells, overlaid with predicted and observed ADA magnitude–time profiles for erenumab aggregate without immunosuppression. (a) Group 2.1: ADA-positive rats; (b) Group 2.1: ADA-negative rats. In (b), the lines of different styles in the same color are used to distinguish different animals of the same group. Cell numbers are shown on a linear scale, and the ADA magnitude is shown on a logarithmic scale. The positive ADA threshold was set to 1.5. Arrows represent erenumab dosing times.
Figure 9
Figure 9
Model simulations for activated CD4+ T helper cells and activated T regulatory cells, overlaid with predicted and observed ADA magnitude–time profiles for erenumab aggregate with immunosuppression (Group 2.2). The lines of different styles in the same color are used to distinguish different animals of the same group. Cell numbers are shown on a linear scale, and the ADA magnitude is shown on a logarithmic scale. The positive ADA threshold was set to 1.5. Arrows represent erenumab dosing times.
Figure 10
Figure 10
Stochastic simulation of the time courses of T cells and ADA magnitude for a hypothetical chronic toxicology study. (a) Activated CD4+ T helper cells, (b) activated T regulatory cells, and (c) ADA magnitude for a hypothetical 6-month multiple-dose toxicology study in 1000 animals that received 10 mg/kg of erenumab monomer weekly for 6 months in the rechallenge phase. The solid line represents the average values, and the dashed line represents the 95% prediction interval. Cell numbers are shown on a linear scale, and the ADA magnitude is shown on a logarithmic scale. The color scheme for the lines is consistent with Figure 6, Figure 7, Figure 8 and Figure 9, where time courses of activated CD4+ T helper cells are depicted in green, activated T regulatory cells in orange, and ADA magnitude in blue. The positive ADA threshold was set to 2, represented by an arrow in Panel (c).

Similar articles

References

    1. Crommelin D.J.A., Sinderlar R.D., Meibohm B. Pharmaceutical Biotechnology: Fundamentals and Applications. 6th ed. Springer Nature; Cham, Switzerland: 2024.
    1. Herskovitz J., Ryman J., Thway T., Lee S., Zhou L., Chirmule N., Meibohm B., Jawa V. Immune Suppression During Preclinical Drug Development Mitigates Immunogenicity-Mediated Impact on Therapeutic Exposure. AAPS J. 2017;19:447–455. doi: 10.1208/s12248-016-0026-8. - DOI - PubMed
    1. Ganesan L.P., Kim J., Wu Y., Mohanty S., Phillips G.S., Birmingham D.J., Robinson J.M., Anderson C.L. FcgammaRIIb on liver sinusoidal endothelium clears small immune complexes. J. Immunol. 2012;189:4981–4988. doi: 10.4049/jimmunol.1202017. - DOI - PMC - PubMed
    1. Ryman J.T., Meibohm B. Pharmacokinetics of Monoclonal Antibodies. CPT Pharmacomet. Syst. Pharmacol. 2017;6:576–588. doi: 10.1002/psp4.12224. - DOI - PMC - PubMed
    1. Hjelm F., Carlsson F., Getahun A., Heyman B. Antibody-mediated regulation of the immune response. Scand. J. Immunol. 2006;64:177–184. doi: 10.1111/j.1365-3083.2006.01818.x. - DOI - PubMed

LinkOut - more resources