. 2025 Jul 9;17(7):895.
doi: 10.3390/pharmaceutics17070895.

Silver Nanoparticles Synthesized from Enicostemma littorale Exhibit Gut Tight Junction Restoration and Hepatoprotective Activity via Regulation of the Inflammatory Pathway

Affiliations

Silver Nanoparticles Synthesized from Enicostemma littorale Exhibit Gut Tight Junction Restoration and Hepatoprotective Activity via Regulation of the Inflammatory Pathway

Hiral Aghara et al. Pharmaceutics. .

Abstract

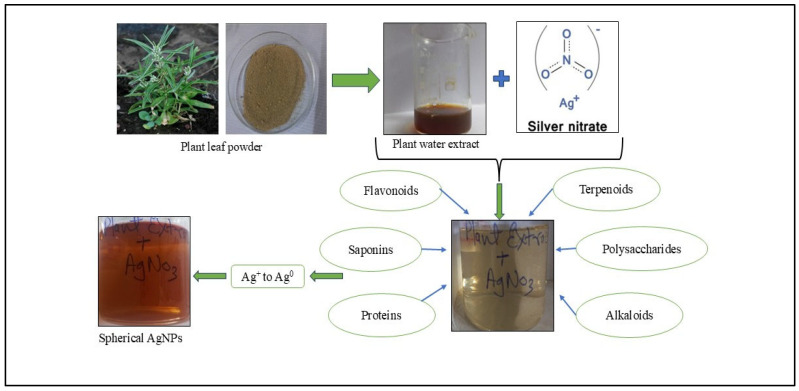
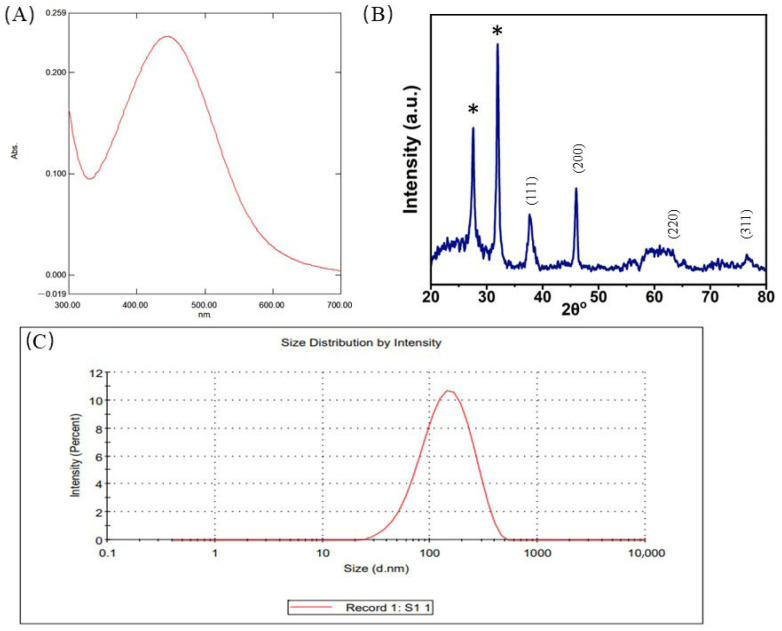
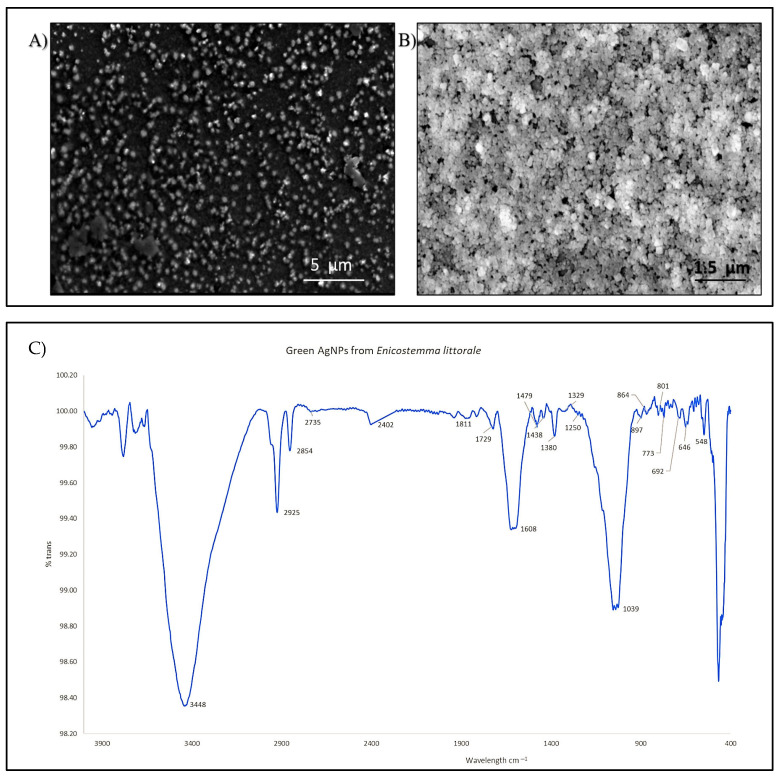
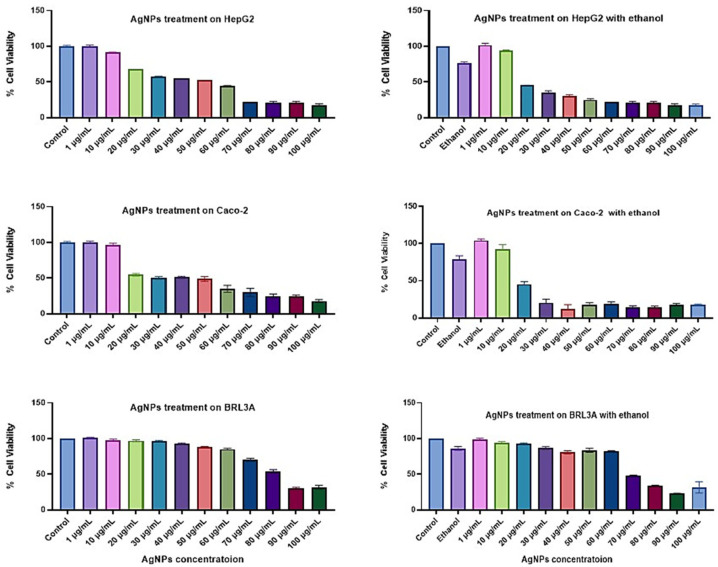
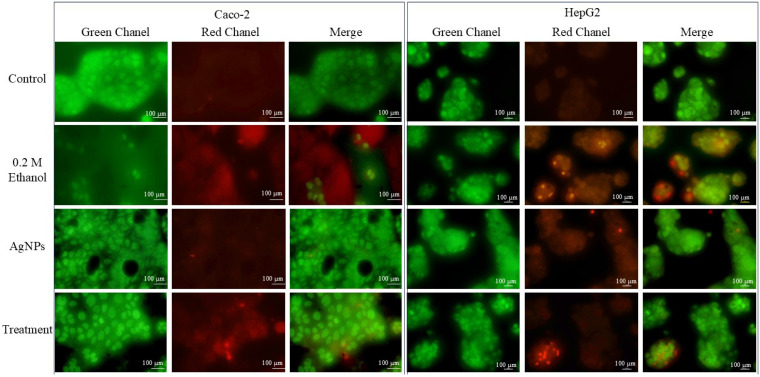
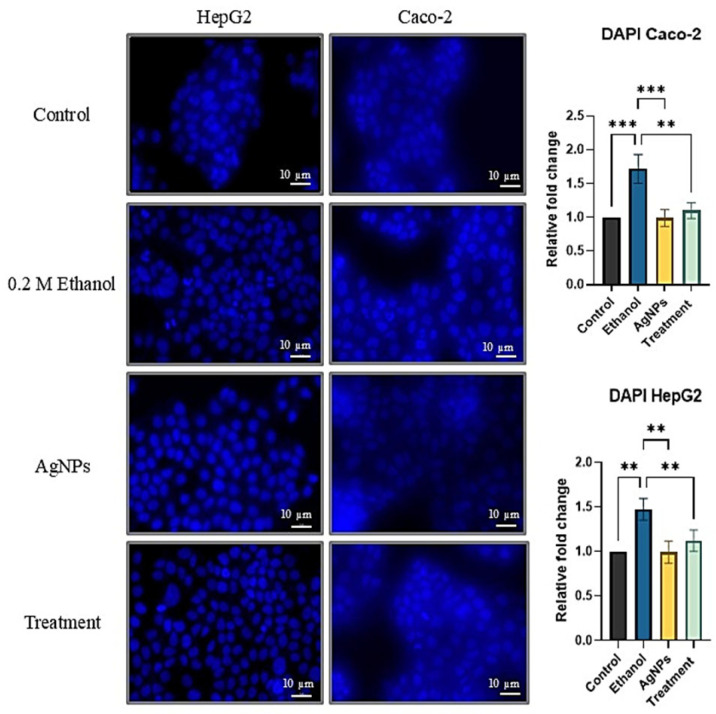
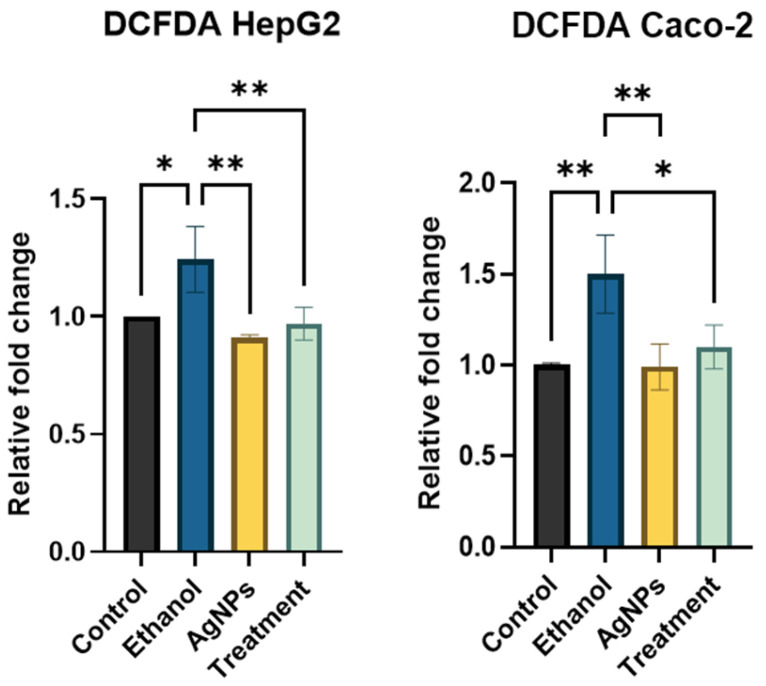
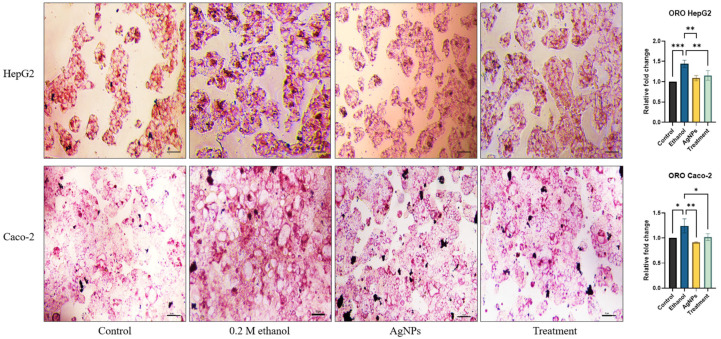
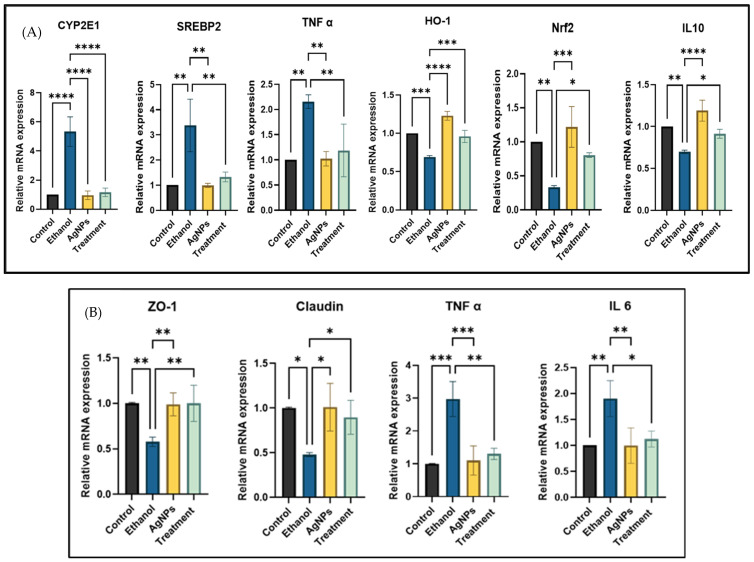
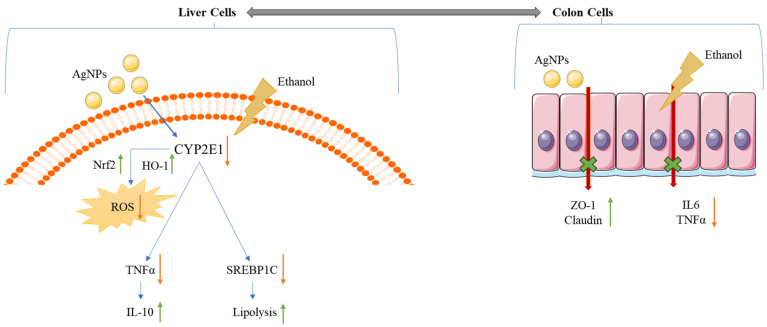
Background: Alcohol-associated liver disease (ALD) is a primary global health concern, exacerbated by oxidative stress, inflammation, and gut barrier dysfunction. Conventional phytocompounds exhibit hepatoprotective potential but are hindered by low bioavailability. This study aimed to evaluate the hepatoprotective and gut-barrier-restorative effects of green-synthesized silver nanoparticles (AgNPs) derived from Enicostemma littorale, a medicinal plant known for its antioxidant and anti-inflammatory properties. Methods: AgNPs were synthesized using aqueous leaf extract of E. littorale and characterized using UV-Vis, XRD, FTIR, DLS, and SEM. HepG2 (liver) and Caco-2 (colon) cells were exposed to 0.2 M ethanol, AgNPs (1-100 µg/mL), or both, to simulate ethanol-induced toxicity. A range of in vitro assays was performed to assess cell viability, oxidative stress (H2DCFDA), nuclear and morphological integrity (DAPI and AO/EtBr staining), lipid accumulation (Oil Red O), and gene expression of pro- and anti-inflammatory, antioxidant, and tight-junction markers using RT-qPCR. Results: Ethanol exposure significantly increased ROS, lipid accumulation, and the expression of inflammatory genes, while decreasing antioxidant enzymes and tight-junction proteins. Green AgNPs at lower concentrations (1 and 10 µg/mL) restored cell viability, reduced ROS levels, preserved nuclear morphology, and downregulated CYP2E1 and SREBP expression. Notably, AgNPs improved the expression of Nrf2, HO-1, ZO-1, and IL-10, and reduced TNF-α and IL-6 expression in both cell lines, indicating protective effects on both liver and intestinal cells. Conclusions: Green-synthesized AgNPs from E. littorale exhibit potent hepatoprotective and gut-barrier-restoring effects through antioxidant, anti-inflammatory, and antilipidemic mechanisms. These findings support the therapeutic potential of plant-based nanoparticles in mitigating ethanol-induced gut-liver axis dysfunction.

Keywords: AgNPs; Enicostemma littorale dried leaves; alcohol-associated liver disease; green synthesis; gut barrier; hepatoprotective activity.


Conflict of interest statement

The authors declare no conflicts of interest.

Figures

Figure 1
Figure 1
The plant dried leaf powder was suspended in water and stirred for a few minutes at a high temperature to ensure the compound was present in the water extract. Further combining this with a silver nitrate solution resulted in the formation of nanoparticles in the presence of biomolecules in the solution. The color change in the solution after the incubation period indicates the formation of nanoparticles.
Figure 2
Figure 2
Characterization of AgNPs synthesized from plant leaf extract. (A) UV–Visible spectroscopy of green AgNPs synthesized from plant extract showing a prominent peak at 445 nm. (B) X-ray diffraction pattern of synthesized AgNPs (* extra peaks generated due to the plant extract.). (C) Size distribution of green AgNPs.
Figure 3
Figure 3
Characterization of AgNPs. (A) shows the SEM image of AgNPs at 5 µm resolution. (B) FE-SEM image of green AgNPs at 1.5 µm resolution. (C) FTIR analysis of green AgNPs showing the peaks.
Figure 4
Figure 4
Cell viability study of green AgNPs on cell lines, HepG2, Caco-2, and BRL3A. Cell viability was studied for AgNPs alone and in combination with 0.2 M ethanol. Statistical analysis: data are presented as the mean ± SD (n = 3).
Figure 5
Figure 5
AO/EtBr staining of HepG2 and Caco-2 cells. In both cell types, ethanol-treated cells showed more damage, whereas, in the treatment group, less damage was observed. The image was taken with a fluorescent microscope at a resolution of 100 µm. The experiment was carried out in triplicate.
Figure 6
Figure 6
DAPI staining shows that ethanol exposure caused nuclear damage in HepG2 and Caco-2 cells, while AgNPs preserved nuclear integrity. Co-treatment with AgNPs reduced ethanol-induced damage, as reflected by restored nuclear morphology and decreased DAPI fluorescence intensity. Statistical analysis: one-way ANOVA with Dunnett’s post hoc test; compared to the ethanol group, where ** p < 0.01, *** p < 0.001.
Figure 7
Figure 7
Quantitative ROS estimation showing a higher relative ratio in ethanol-treated cells, while the ratio decreased in the treatment group. Statistical analysis: one-way ANOVA with Dunnett’s post hoc test; compared to the ethanol group, where ** p < 0.01, * p < 0.05.
Figure 8
Figure 8
ORO staining to assess intracellular lipid accumulation in HepG2 and Caco-2 cells. Cells were treated with 0.2 M ethanol, AgNPs (1 µg/mL), or a combination of both (treatment) and compared to untreated controls. Ethanol-treated cells exhibited significant lipid accumulation, evident as dense, red-stained droplets in the cytoplasm. AgNPs alone did not alter lipid levels compared to the control, while co-treatment with AgNPs reduced ethanol-induced lipid accumulation. The image was taken in a bright field microscope with a resolution of 10 µM. Statistical analysis: data are presented as the mean ± SD, one-way ANOVA with Dunnett’s post hoc test; compared to the ethanol group, where * p <0.05, **p < 0.01, *** p < 0.001.
Figure 9
Figure 9
Gene expression analysis in HepG2 and Caco-2 cells with and without ethanol exposure. (A) HepG2 cells: relative mRNA expression of CYP2E1, SREBP2, pro-inflammatory (e.g., TNF-α, IL-6), anti-inflammatory (e.g., IL-10), and antioxidant (Nrf2, HO-1) genes. (B) Caco-2 cells: gene expression of tight-junction markers (ZO-1, claudin) and pro-inflammatory cytokines. Data are presented as mean ± SD (n = 3); statistical analysis was performed using one-way ANOVA with Dunnett’s post hoc test. Comparisons were made against the ethanol-treated group, where * p < 0.05, ** p < 0.01, *** p < 0.001, and **** p < 0.0001.
Figure 10
Figure 10
The liver and colon are interconnected via the portal vein, enabling ethanol-induced pro-inflammatory cytokines and toxins from the colon to reach the liver. Ethanol also directly increases hepatic ROS and inflammation and disrupts lipid metabolism. Green-synthesized AgNPs help reverse both primary liver injury and secondary gut-derived inflammation.

Similar articles

References

    1. Peng Y., Ao M., Dong B., Jiang Y., Yu L., Chen Z., Hu C., Xu R. Anti-inflammatory effects of curcumin in the inflammatory diseases: Status, limitations and countermeasures. Drug Des. Dev. Ther. 2021;15:4503–4525. doi: 10.2147/DDDT.S327378. - DOI - PMC - PubMed
    1. Yaqub A., Ditta S.A., Anjum K.M., Tanvir F., Malkani N., Yousaf M.Z. Comparative Analysis of Toxicity Induced by Different Synthetic Silver Nanoparticles in Albino Mice. BioNanoScience. 2019;9:553–563. doi: 10.1007/s12668-019-00642-y. - DOI
    1. Javed S., Kohli K., Ahsan W. Bioavailability augmentation of silymarin using natural bioenhancers: An in vivo pharmacokinetic study. Braz. J. Pharm. Sci. 2022;58:e20160. doi: 10.1590/s2175-97902022e20160. - DOI
    1. Xie Y., Zhang D., Zhang J., Yuan J. Metabolism, transport and drug–drug interactions of silymarin. Molecules. 2019;24:3693. doi: 10.3390/molecules24203693. - DOI - PMC - PubMed
    1. Siegel A.B., Stebbing J. Milk thistle: Early seeds of potential. Lancet Oncol. 2013;14:929–930. doi: 10.1016/S1470-2045(13)70414-5. - DOI - PMC - PubMed

LinkOut - more resources