

Mechanistic Insights into Cytokine Antagonist-Drug Interactions: A Physiologically Based Pharmacokinetic Modelling Approach with Tocilizumab as a Case Study
- PMID: 40733104
- PMCID: PMC12297905
- DOI: 10.3390/pharmaceutics17070896
Mechanistic Insights into Cytokine Antagonist-Drug Interactions: A Physiologically Based Pharmacokinetic Modelling Approach with Tocilizumab as a Case Study
Abstract
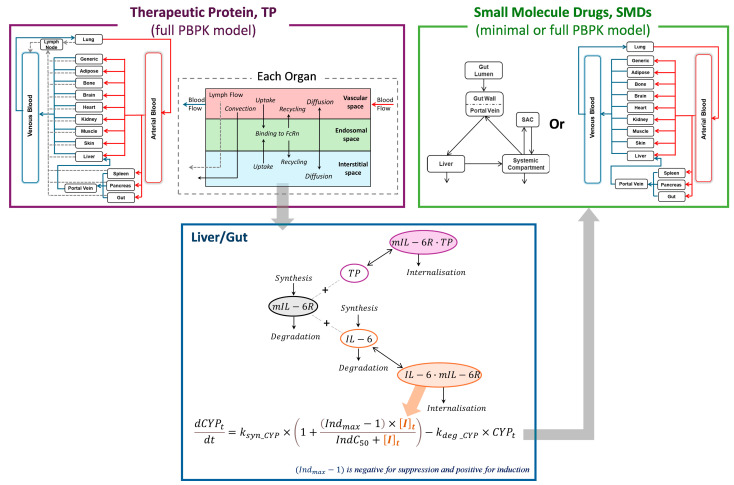
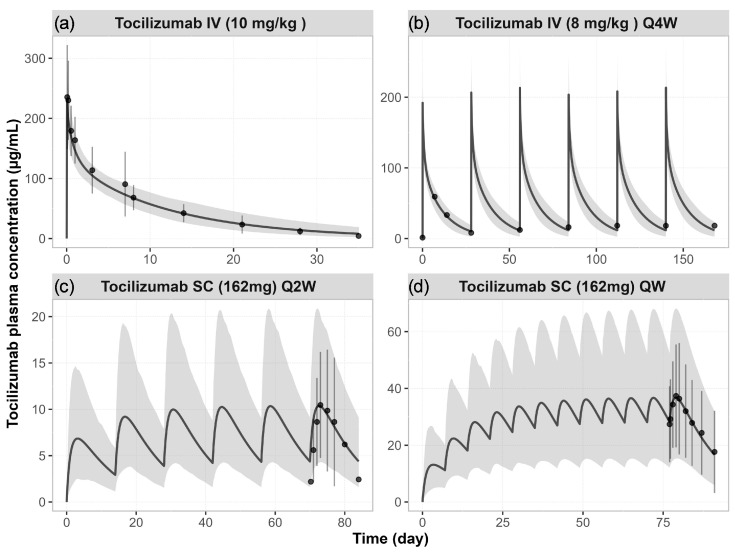
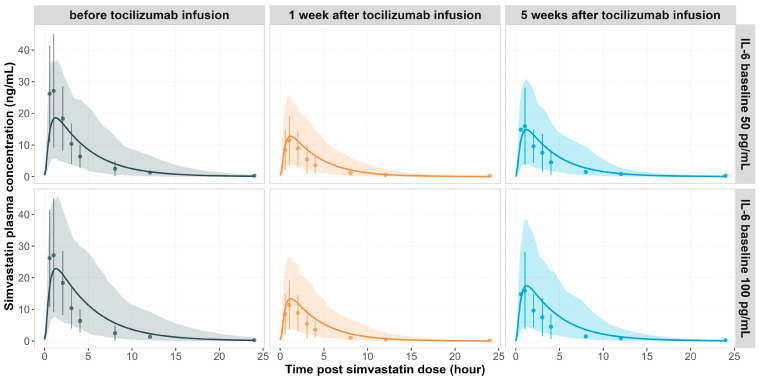
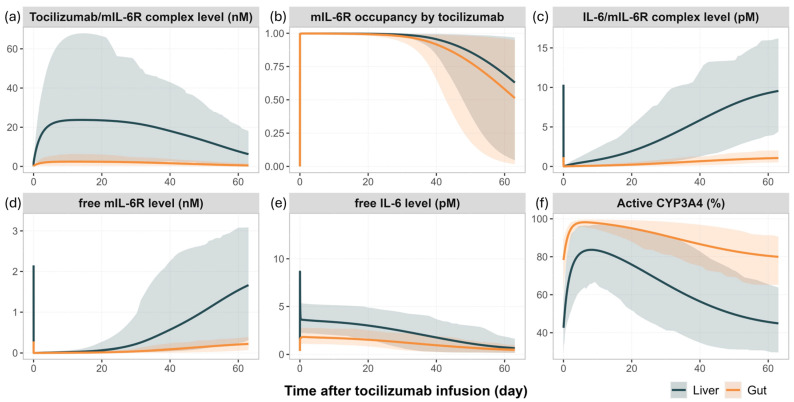
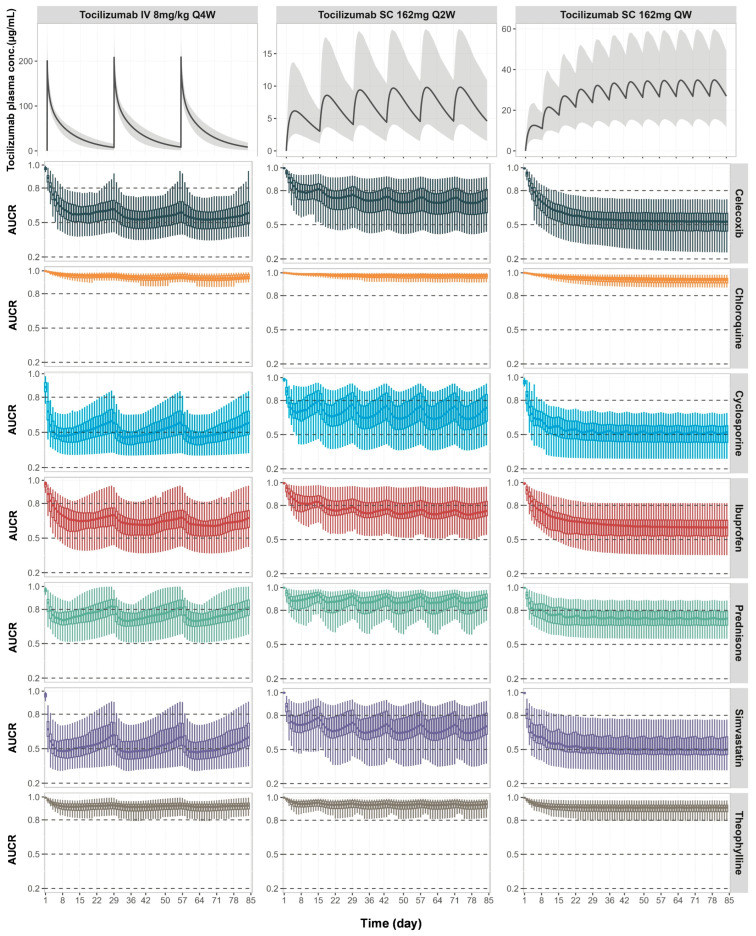
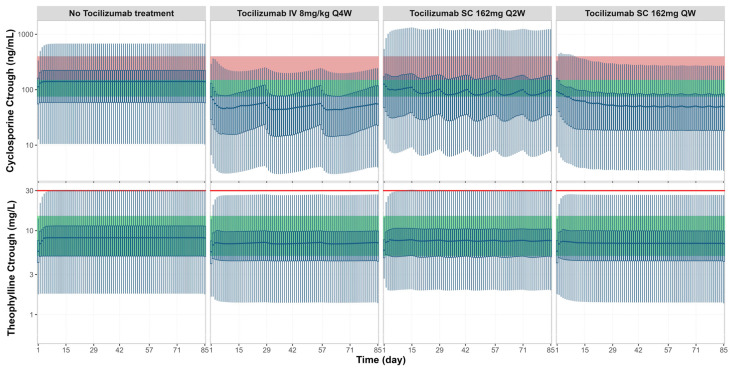
Background: Understanding interactions between cytokine antagonists and drugs is essential for effective medication management in inflammatory conditions. Recent regulatory authority guidelines emphasise a systematic, risk-based approach to evaluating these interactions, underscoring the need for mechanistic insight. Proinflammatory cytokines, such as interleukin-6 (IL-6), modulate cytochrome P450 (CYP) enzymes, reducing the metabolism of CYP substrates. Cytokine antagonists (such as IL-6 receptor antagonists) can counteract this effect, restoring CYP activity and increasing drug clearance. However, quantitative prediction of cytokine-mediated drug interactions remains challenging, as existing models often lack the mechanistic detail needed to capture the dynamic relationship between cytokine signalling, receptor engagement, and downstream modulation of drug metabolism. Methods: A physiologically based pharmacokinetic (PBPK) framework incorporating cytokine-receptor binding, subsequent downregulation of CYP expression, and blockade of the cytokine signalling by a therapeutic protein antagonist was developed to simulate and investigate cytokine antagonist-drug interactions. Tocilizumab, a humanised IL-6 receptor antagonist used to treat several inflammatory conditions associated with elevated IL-6 levels, was selected as a model drug to demonstrate the utility of the framework. Results: The developed PBPK model accurately predicted the pharmacokinetics profiles of tocilizumab and captured clinically observed dynamic changes in simvastatin exposure before and after tocilizumab treatment in rheumatoid arthritis (RA) patients. Simulated IL-6 dynamics aligned with observed clinical profiles, showing transient elevation following receptor blockade and associated restoration of CYP3A4 activity. Prospective simulations with commonly co-administered CYP substrates (celecoxib, chloroquine, cyclosporine, ibuprofen, prednisone, simvastatin, and theophylline) in RA patients revealed dose regimen- and drug-dependent differences in interaction magnitude. Conclusions: This study demonstrated the utility of PBPK models in providing a mechanistic understanding of cytokine antagonist-drug interactions, supporting enhanced therapeutic decision-making and optimising patient care in inflammatory conditions.
Keywords: PBPK modelling; cytokine antagonist; interleukine-6; therapeutic protein-drug interaction; tocilizumab.
Conflict of interest statement
X.P., C.L., F.S., A.D., M.J., and I.G. are employees of Certara UK Limited and may hold shares in Certara.
Figures
Similar articles
-
Interleukin-6 and cytochrome-P450, reason for concern?Rheumatol Int. 2012 Sep;32(9):2601-4. doi: 10.1007/s00296-012-2423-3. Epub 2012 Mar 27. Rheumatol Int. 2012. PMID: 22451032
-
The Black Book of Psychotropic Dosing and Monitoring.Psychopharmacol Bull. 2024 Jul 8;54(3):8-59. Psychopharmacol Bull. 2024. PMID: 38993656 Free PMC article. Review.
-
Understanding Voriconazole Metabolism: A Middle-Out Physiologically-Based Pharmacokinetic Modelling Framework Integrating In Vitro and Clinical Insights.Clin Pharmacokinet. 2024 Nov;63(11):1609-1630. doi: 10.1007/s40262-024-01434-8. Epub 2024 Oct 30. Clin Pharmacokinet. 2024. PMID: 39476315 Free PMC article.
-
[Guidelines for the prevention and management of bronchial asthma (2024 edition)].Zhonghua Jie He He Hu Xi Za Zhi. 2025 Mar 12;48(3):208-248. doi: 10.3760/cma.j.cn112147-20241013-00601. Zhonghua Jie He He Hu Xi Za Zhi. 2025. PMID: 40050074 Chinese.
-
The Cytokine Release Syndrome and/or the Proinflammatory Cytokines as Underlying Mechanisms of Downregulation of Drug Metabolism and Drug Transport: A Systematic Review of the Clinical Pharmacokinetics of Victim Drugs of this Drug-Disease Interaction Under Different Clinical Conditions.Clin Pharmacokinet. 2022 Nov;61(11):1519-1544. doi: 10.1007/s40262-022-01173-8. Epub 2022 Sep 5. Clin Pharmacokinet. 2022. PMID: 36059001 Free PMC article.
References
-
- U.S. Food & Drug Administration, Drug-Drug Interaction Assessment for Therapeutic Proteins, Guidance for Industry. [(accessed on 6 June 2023)]; Available online: www.fda.gov/regulatory-information/search-fda-guidance-documents/drug-dr....
-
- ICH Guideline M12 on Drug Interaction Studies. [(accessed on 10 June 2024)]. Available online: https://database.ich.org/sites/default/files/ICH_M12_Step4_Guideline_202....
-
- Morgan E.T., Goralski K.B., Piquette-Miller M., Renton K.W., Robertson G.R., Chaluvadi M.R., Charles K.A., Clarke S.J., Kacevska M., Liddle C., et al. Regulation of drug-metabolizing enzymes and transporters in infection, inflammation, and cancer. Drug Metab. Dispos. 2008;36:205–216. doi: 10.1124/dmd.107.018747. - DOI - PubMed
Grants and funding
LinkOut - more resources
Full Text Sources
