. 2025 Jul 12;17(7):905.
doi: 10.3390/pharmaceutics17070905.

Electroporation- and Liposome-Mediated Co-Transfection of Single and Multiple Plasmids

Affiliations

Electroporation- and Liposome-Mediated Co-Transfection of Single and Multiple Plasmids

Uday K Baliga et al. Pharmaceutics. .

Abstract

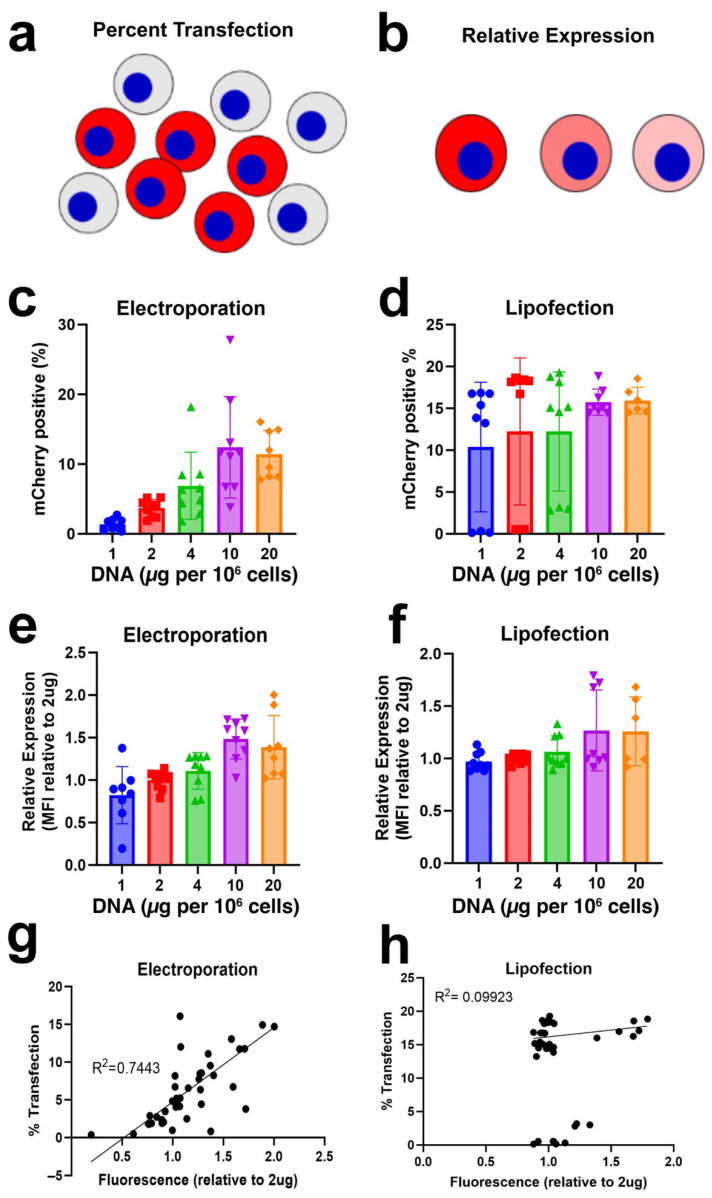
Background/Objectives: Co-transfection of multiple DNAs is important to many research and therapeutic applications. While the optimization of single plasmid transfection is common, multiple plasmid co-transfection analyses are limited. Here we provide empirical data regarding multiple plasmid co-transfection while altering the number of species of plasmids transfected (up to four different plasmids) and the amount of plasmids/cell using the two most common non-viral techniques, electroporation and lipofection. Methods: A549 human lung epithelial cells were transfected using lipofectamine 2000 or electroporation with combinations of plasmids, each expressing one of four different fluorescent proteins from the CAGG promoter. Twenty-four hours later, cells were analyzed by spectral flow cytometry to determine the number of cells expressing each fluorescent protein and the amount of fluorescent signal of each protein in a cell. Results and Conclusions: For electroporation, while the fraction of cells expressing plasmids increased with increasing amounts of DNA, increasing the number of plasmid species did not alter the fraction of expressing cells and had no effect on levels of expression in individual cells. By contrast, for lipofection, the fraction of cells expressing plasmids was not affected by the amount of DNA added but both the fraction of cells expressing and the level of protein produced in these cells decreased for each plasmid species as the number of delivered species increased. For both lipofection and electroporation after single plasmid transfection, the expressing cells had greater numbers of plasmid copies/cell than non-expressing cells. Multiple plasmid lipofection resulted in more plasmid copies/cell in co-expressing than non-expressing cells. Multiple plasmid electroporation was the inverse of this with fewer plasmid copies/cell in co-expressing than non-expressing cells.

Keywords: electroporation; gene delivery; gene electrotransfer; lipofection; multiple plasmids; plasmids; transfection.


Conflict of interest statement

David Dean serves as a member of the Scientific Advisory Board of Seawolf Therapeutics and has equity interest in the company. Uday Baliga, Anthony Gurunian, Aitor Nogales, and Luis Martinez-Sobrido have no conflicting interests to declare.

Figures

Figure 1
Figure 1
Mathematical modeling of plasmid co-transfection. (a) Probability of delivering at least one of each plasmid species (κ) to a cell when multiple plasmids (λ) are delivered. (b) A Poisson distribution prediction of transfecting exactly as many plasmids (κ) as one is attempting to deliver (λ). Both plots were generated in Matlab.
Figure 2
Figure 2
Single transfection of varying DNA amount. (a). Graphical representation of the percent of cells expressing mCherry (red) resulting from transfection. (b). Graphical representation of relative mCherry expression (red) in individual cells. (c). Percent of mCherry-expressing cells 24 h after electroporation as a function of increasing amounts of transfected mCherry plasmid. Cells were electroporated using the same conditions but with increasing amounts of plasmid. (d). Percent of mCherry-positive cells 24 h after lipofection with increasing amounts of an mCherry plasmid. (e). Relative fluorescent intensity of mCherry-positive cells from C after electroporation. (f). Relative fluorescence of mCherry-positive cells from D after lipofection. (g). Relationship between the percent of mCherry-positive cells and relative fluorescence of positive cells after electroporation. (h). Relationship between the percent of mCherry-positive cells and the relative fluorescence of positive cells after lipofection. The percentage of positive cells was determined by spectral flow cytometry and the fluorescence intensity was measured as the normalized geometric mean fluorescence intensity as described in the Methods Section. In all cases, 8–9 transfections were used for analysis (3 experiments with 3 replicates each). Statistical analysis was by one way ANOVA followed by post hoc Tukey tests for multiple comparisons.
Figure 3
Figure 3
Transfection and relative fluorescent intensity of multiple plasmids. (a) Graphical representation of mCherry and GFP co-transfection. Cells transfected with a mixture of pCAGG-mCherry and pCAGG-eGFP can show no expression (non-transfected; gray), GFP or mCherry alone, or both mCherry and GFP. Any cell expressing a fluorescent protein is considered transfected, but only cells expressing both at the same time are considered completely co-transfected. (b) Graphical representation of relative mCherry and eGFP expression in individual cells. (c) Percent of cells that are expressing any fluorescent protein (total transfection) 24 h after electroporation as a function of increasing amounts of transfected plasmids (single, triple, or quadruple transfection). Cells were electroporated using the same conditions but with increasing numbers of plasmid species (1, 3, or 4) and varying amounts of plasmid (2, 0.67, or 0.5 µg of each plasmid). (d) Percent of cells that are expressing any fluorescent protein (total transfection) 24 h after lipofection as a function of increasing amounts of transfected plasmids (single, triple, or quadruple transfection). Cells were transfected with Lipofectamine at a DNA/lipid ratio of 2:5 with increasing numbers of plasmid species (1, 3, or 4) and varying amounts of plasmid (2, 0.67, or 0.5 µg of each plasmid). (e) Relative fluorescence intensity of fluorescent-protein-positive cells from (c) after electroporation. (f) Relative fluorescence intensity of fluorescent-protein-positive cells from (d) after lipofection. (g) Percent co-transfection in cells after electroporation. The percentage of cells expressing all delivered species in each transfection is shown for 3- and 4-plasmid transfections from (c) is shown as a function of total cells present. (h) Percent of co-transfection in cells after electroporation. The percentage of cells expressing all delivered species in each transfection is shown for 3- and 4-plasmid transfections from (d) is shown as a function of total cells present. (i) Percent of co-transfection within the population of transfected cells following electroporation. The percentage of cells expressing all transferred plasmid species as a function of cells that express any or all plasmid species following electroporation-mediated transfection from (c) is shown. Partially co-transfected cells (“expresses some”) express fewer than all the transferred plasmid species and completely co-transfected (“expresses all”) express all plasmid species. (j) Percent of co-transfection within the population of transfected cells following lipofection. All samples were analyzed via spectral flow cytometry with fresh unmixing controls (single plasmid) and FMOs for each experiment. The percentage of positive cells was determined by spectral flow cytometry and the fluorescence intensity was measured as the normalized geometric mean fluorescence intensity as described in the Methods Section. In all cases, 6–24 transfections were used for analysis (3–8 experiments with 3 replicates each). Statistical analysis was by one way ANOVA followed by post hoc Tukey tests for multiple comparisons. *, p < 0.05; **, p < 0.01; ***, p < 0.001; and ****, p < 0.0001.
Figure 4
Figure 4
Cytotoxicity. Twenty-four hours after transfection, media was removed from transfected cells and assayed spectrophotometrically for lactate dehydrogenase as a measure of cytotoxicity. Cell lysates also were prepared, and total cellular lactate dehydrogenase was set to 100%. (a) Cytotoxicity after electroporation with varying amounts of pCAGG-mCherry. (b) Cytotoxicity after lipofection with varying amount of pCAGG-mCherry. (c) Cytotoxicity after electroporation with multiple plasmid species and/or increased amount of total DNA. (d) Cytotoxicity after lipofection with multiple plasmids and/or increased amount of DNA. In all cases, 6–9 transfections (from Figure 3) were used for analysis (at least 3 experiments with 3 replicates each). Statistical analysis was by one way ANOVA followed by post hoc Tukey tests for multiple comparisons. *, p < 0.05; **, p < 0.01; ***, p < 0.001; and ****, p < 0.0001.
Figure 5
Figure 5
Plasmid copy number. (a) Plasmid copy number in electroporated cells as determined by qPCR. DNA was isolated from cells 24 h after electroporation and used for qPCR. A standard curve made with plasmid was used for quantification based on ∆∆Ct analysis. (b) Plasmid copy number in electroporated cells as a function of transgene expression; 24 h after electroporation, cells were sorted for fluorescent protein expression into non-expressing (blue), expressing some but not all plasmid species (yellow), or expressing all plasmid species (green) populations. (c) Plasmid numbers in Lipofectamine 2000-transfected cells determined by qPCR. DNA was isolated from cells 24 h after electroporation and used for qPCR. A standard curve made with plasmid was used for quantification based on ∆∆Ct analysis. (d) Plasmid copy number in lipofected cells as a function of transgene expression; 24 h after electroporation, cells were sorted for fluorescent protein expression into non-expressing (blue), expressing some but not all plasmid species (yellow), or expressing all plasmid species (green) populations. GAPDH gDNA as a standard curve to determine cell number in (a,c). Cell numbers in (b,d) were determined during cell sorting. Statistical analysis was by one way ANOVA followed by post hoc Tukey tests for multiple comparisons. **, p < 0.01; ***, p < 0.001.

Similar articles

References

    1. Cardarelli F., Digiacomo L., Marchini C., Amici A., Salomone F., Fiume G., Rossetta A., Gratton E., Pozzi D., Caracciolo G. The intracellular trafficking mechanism of Lipofectamine-based transfection reagents and its implication for gene delivery. Sci. Rep. 2016;6:25879. doi: 10.1038/srep25879. - DOI - PMC - PubMed
    1. González-Cuevas J.A., Argüello R., Florentin M., André F.M., Mir L.M. Experimental and Theoretical Brownian Dynamics Analysis of Ion Transport During Cellular Electroporation of E. coli Bacteria. Ann. Biomed. Eng. 2024;52:103–123. doi: 10.1007/s10439-023-03353-4. - DOI - PubMed
    1. Ávila-Pérez G., Nogales A., Martín V., Almazán F., Martínez-Sobrido L. Reverse Genetic Approaches for the Generation of Recombinant Zika Virus. Viruses. 2018;10:597. doi: 10.3390/v10110597. - DOI - PMC - PubMed
    1. Ortiz-Riaño E., Cheng B.Y.H., Carlos de la Torre J., Martínez-Sobrido L. Arenavirus reverse genetics for vaccine development. J. Gen. Virol. 2013;94:1175–1188. doi: 10.1099/vir.0.051102-0. - DOI - PMC - PubMed
    1. Hou Y.J., Okuda K., Edwards C.E., Martinez D.R., Asakura T., Dinnon K.H., 3rd, Kato T., Lee R.E., Yount B.L., Mascenik T.M., et al. SARS-CoV-2 Reverse Genetics Reveals a Variable Infection Gradient in the Respiratory Tract. Cell. 2020;182:429–446.e14. doi: 10.1016/j.cell.2020.05.042. - DOI - PMC - PubMed

LinkOut - more resources