. 2025 Jul 20;17(7):935.
doi: 10.3390/pharmaceutics17070935.

Modeling the Influence of CYP2C9 and ABCB1 Gene Polymorphisms on the Pharmacokinetics and Pharmacodynamics of Losartan

Affiliations

Modeling the Influence of CYP2C9 and ABCB1 Gene Polymorphisms on the Pharmacokinetics and Pharmacodynamics of Losartan

Dmitry Babaev et al. Pharmaceutics. .

Abstract

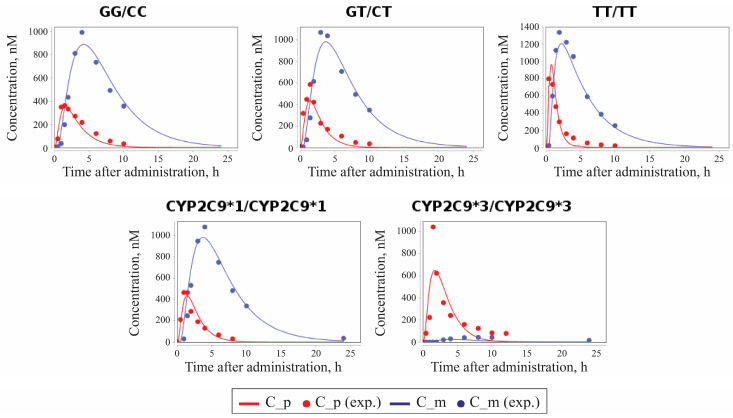
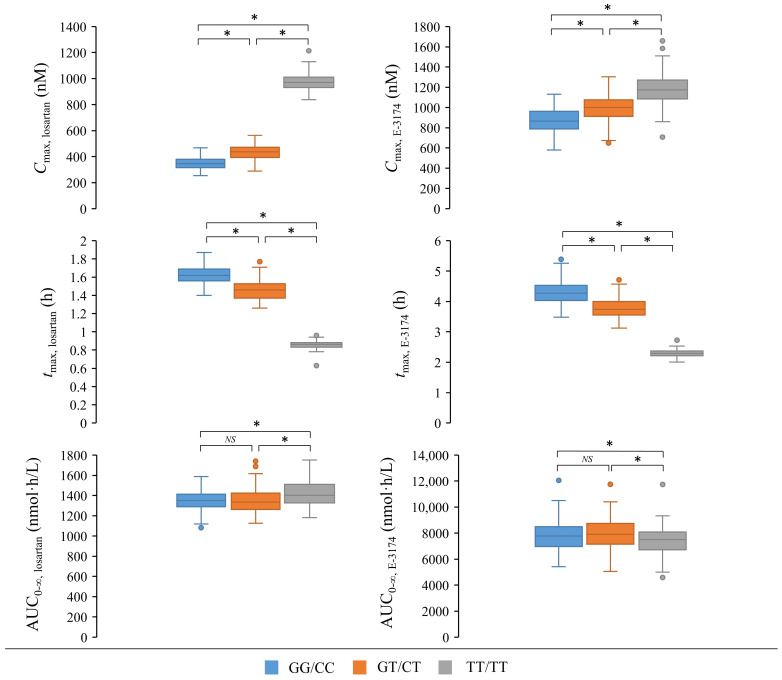
Background/Objectives: Hypertension is a pathological condition characterized by elevated systolic and/or diastolic blood pressure. A range of pharmacotherapeutic agents are available to treat this condition and prevent complications, including the angiotensin II AT1-receptor blocker losartan. Following oral administration, losartan is exposed to a variety of enzymes that facilitate its metabolism or transportation. The structural characteristics of the genes that encode the enzymes may potentially impact the pharmacokinetics and pharmacodynamics of losartan, thereby modulating its effects on the treatment process. Methods: In this study, a computational model of losartan pharmacokinetics was developed, taking into account the influence of different alleles of the CYP2C9 gene, which plays a pivotal role in losartan metabolism, and the ABCB1 gene, which is responsible for losartan transport. Results: Alterations in the modeled activities of the enzymes encoded by CYP2C9 and ABCB1 result in changes in the losartan and its metabolite profiles that are consistent with known experimental data in real patients with different CYP2C9 and ABCB1 genotypes. Conclusions: The findings of the modeling can potentially be used to personalize drug therapy for arterial hypertension.

Keywords: ABCB1; BioUML; CYP2C9; arterial hypertension; losartan; mathematical modeling; personalized medicine; pharmacodynamics; pharmacokinetics.


Conflict of interest statement

The authors declare no conflicts of interest.

Figures

Figure 1
Figure 1
ABCB1 allele frequencies (data from gnomAD v4.1.0 https://gnomad.broadinstitute.org/, accessed on 5 June 2025).
Figure 2
Figure 2
A model of losartan metabolism with a new compartment, “Enterocyte”. Numbers 1 through 9 denote reactions, compartments are shown as gray rectangles, purple ovals represent chemical compounds, excreted substances are shown as crossed-out red circles, and green rectangles denote enzymes.
Figure 3
Figure 3
Comparisons between the profiles of losartan (A) and E-3174 (B) after a single 50 mg oral dose of losartan potassium in CYP2C9*1/CYP2C9*1 individuals of different ethnicities: Korean [52], Swedish [33], and Chinese [59].
Figure 4
Figure 4
Comparison of the concentration–time curves for losartan (blue) and E-3174 (orange) between CYP2C9*1/CYP2C9*1 [52] (dashed lines) and different ABCB1 genotypes: GG/CC (A), GT/CT (B), and TT/TT (C) [41] (solid lines).
Figure 5
Figure 5
Model prediction of losartan and E-3174 plasma concentrations for two CYP2C9 and three ABCB1 genotypes after a single 50 mg oral dose of losartan potassium. C_p, predicted profile of losartan; C_m, predicted profile of E-3174; C_p (exp.), experimental time-course of losartan; C_m (exp.), experimental time-course of E-3174. In experimental works, 13 patients were included in GG/CC group, 12 patients in the GT/CT group, 13 patients in the TT/TT group [41], 12 patients in the CYP2C9*1/CYP2C9*1 group, and only 1 patient in the CYP2C9*3/CYP2C9*3 group [52].
Figure 6
Figure 6
Plots demonstrating the ratio of predicted to experimental values or fold change (FC) for all pharmacokinetic parameters for the following genotypes: CYP2C9*1/CYP2C9*1, CYP2C9*3/CYP2C9*3, GG/CC, GT/CT, and TT/TT. Cmax, maximum plasma concentration; tmax, time at which Cmax occurred; t1/2, terminal elimination half-life; AUC0–∞, area under the concentration–time curve from zero to infinity; CL/F, apparent oral clearance of losartan. Red dashed lines indicate the level of FC = 1.
Figure 7
Figure 7
Comparison of the Cmax (maximum plasma concentration), tmax (time at which Cmax occurred), and AUC0–∞ (area under the concentration–time curve from zero to infinity) of losartan and E-3174 for simulated ABCB1 genotypes. Box plots show medians, interquartile ranges, maximum, minimum, and outliers. *, p-value < 0.0167 (0.05/number of ABCB1 genotypes, Bonferroni cutoff for significance). NS, p-value > 0.0167 (0.05/number of ABCB1 genotypes, Bonferroni cutoff for significance). A total of 100 values were used to create each boxplot. The most significant differences were observed between TT/TT and other genotypes (GG/CC+GT/CT) for Cmax, losartan, tmax, losartan, and tmax, E-3174.
Figure 8
Figure 8
Relative coefficients SS of the model parameters for the GG/CC genotype. a—the amplitude of the sinusoidal equation, which describes open–close cycles of the gastric pyloric valve (h−1); b—the period of the sinusoidal equation, which describes open–close cycles of the gastric pyloric valve (h); k_int_ent—rate constant of losartan absorption from the intestinal lumen into enterocytes (h−1); k_ent_int—rate constant of reverse transport of losartan from enterocytes to the intestinal lumen by ABCB1 (h−1); k_ent_cc—rate constant of losartan absorption from enterocytes into the blood (h−1); k_m—rate constant of the conversion of losartan to E-3174 by CYP2C9 (h−1); T—time delay in the conversion of losartan to E-3174 (h); CL_m—apparent clearance of E-3174 (L/h); Vm—apparent volume of distribution of E-3174 in the blood (L); CL_p—apparent clearance of losartan (L/h); Vp_1—apparent volume of distribution of losartan in the blood (L); Q—apparent clearance of losartan transfer between the blood and other organs and tissues (L/h); Vp_2—apparent volume of distribution of losartan in other organs and tissues (L). AUC0–∞—area under the concentration–time curve from zero to infinity (nmol·h/L); Cmax—maximum plasma concentration (nM).
Figure 9
Figure 9
Comparison of simulated and experimentally obtained [53] systolic (A) and diastolic (B) blood pressure (SBP and DBP, respectively) responses to losartan treatment in real patients with the CC/GG/CC and TT/TT/TT genotypes and in virtual patients (regardless of genotype) using 100 mg oral dose of losartan potassium. Comparison of simulated systolic (C) and diastolic (D) blood pressure responses to losartan monotherapy in virtual patients with GG/CC, GT/CT, and TT/TT genotypes using 50 mg oral dose of losartan potassium. Box plots show medians, interquartile ranges, maximum, minimum, and outliers. *, p-value < 0.0167 (0.05/number of comparison groups, Bonferroni cutoff for significance). NS, p-value > 0.0167 (0.05/number of comparison groups, Bonferroni cutoff for significance).

Similar articles

References

    1. Childs S., Ling V. The MDR Superfamily of Genes and Its Biological Implications. Important Adv. Oncol. 1994;98:21–36. - PubMed
    1. Dean M., Allikmets R. Evolution of ATP-Binding Cassette Transporter Genes. Curr. Opin. Genet. Dev. 1995;5:779–785. doi: 10.1016/0959-437X(95)80011-S. - DOI - PubMed
    1. Ambudkar S.V., Lelong I.H., Zhang J., Cardarelli C. Purification and Reconstitution of Human P-Glycoprotein. Methods Enzymol. 1998;292:492–504. doi: 10.1016/s0076-6879(98)92038-9. - DOI - PubMed
    1. Gottesman M.M., Ling V. The Molecular Basis of Multidrug Resistance in Cancer: The Early Years of P-Glycoprotein Research. FEBS Lett. 2006;580:998–1009. doi: 10.1016/j.febslet.2005.12.060. - DOI - PubMed
    1. Sauna Z.E., Smith M.M., Müller M., Kerr K.M., Ambudkar S.V. The Mechanism of Action of Multidrug-Resistance-Linked P-Glycoprotein. J. Bioenerg. Biomembr. 2001;33:481–491. doi: 10.1023/A:1012875105006. - DOI - PubMed

LinkOut - more resources