. 2025 Jul 21;17(7):940.
doi: 10.3390/pharmaceutics17070940.

ROS/Enzyme Dual-Responsive Drug Delivery System for Targeted Colorectal Cancer Therapy: Synergistic Chemotherapy, Anti-Inflammatory, and Gut Microbiota Modulation

Affiliations

ROS/Enzyme Dual-Responsive Drug Delivery System for Targeted Colorectal Cancer Therapy: Synergistic Chemotherapy, Anti-Inflammatory, and Gut Microbiota Modulation

Xin Zhang et al. Pharmaceutics. .

Abstract

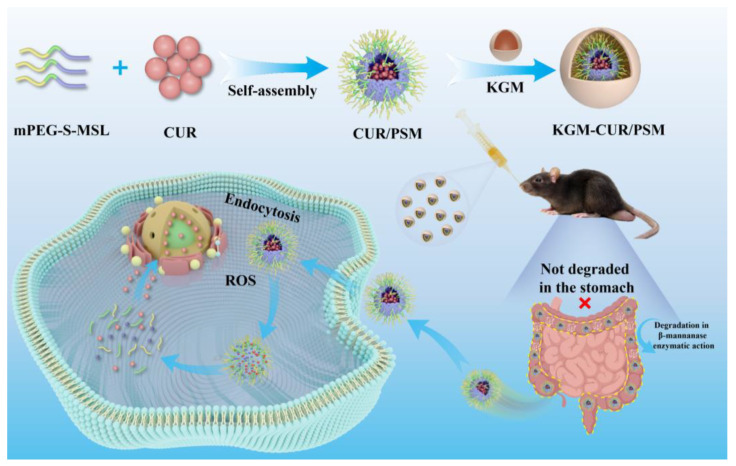
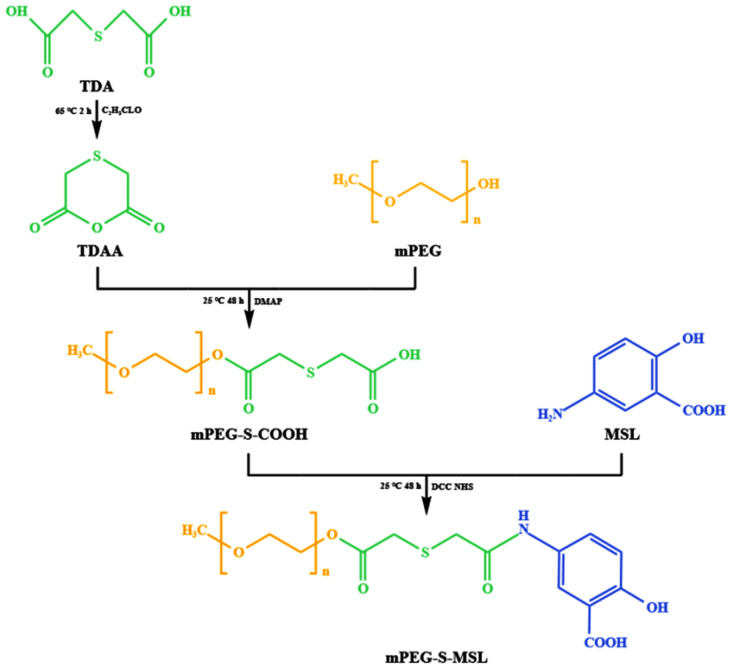
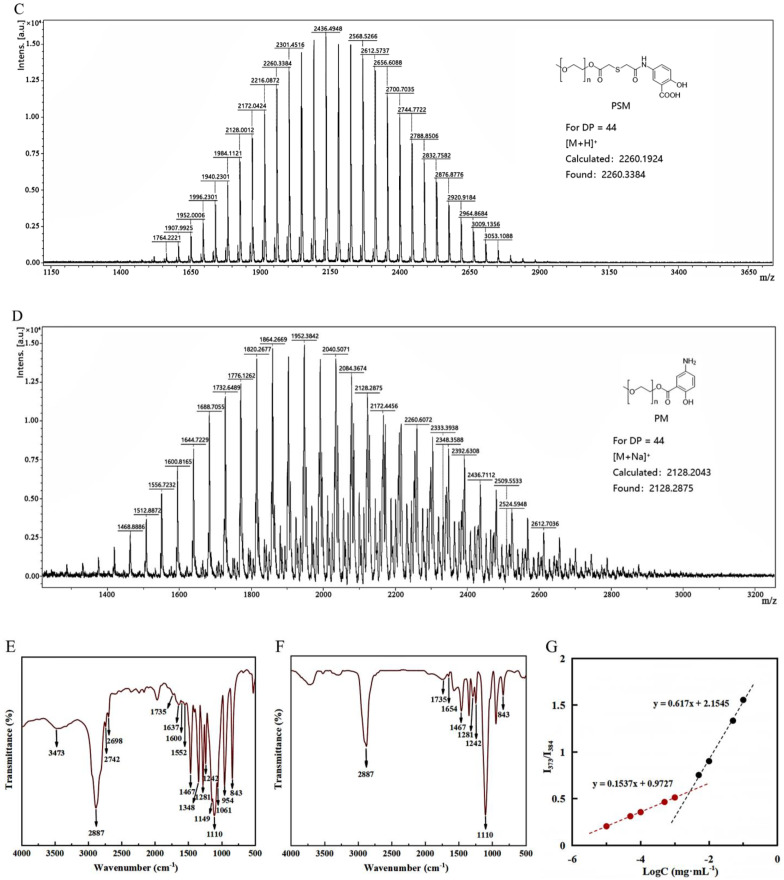
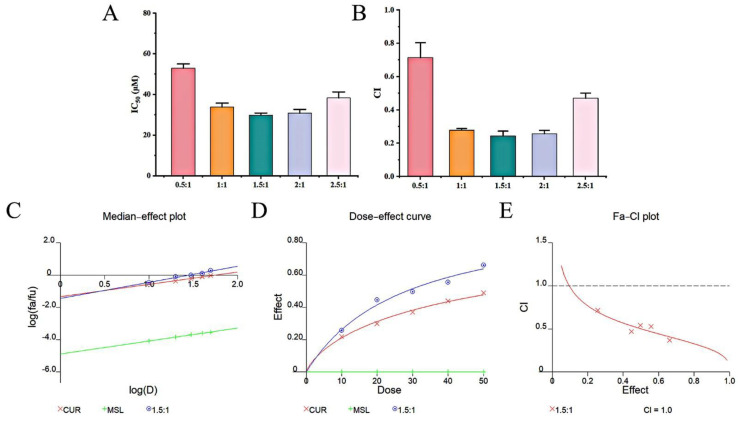
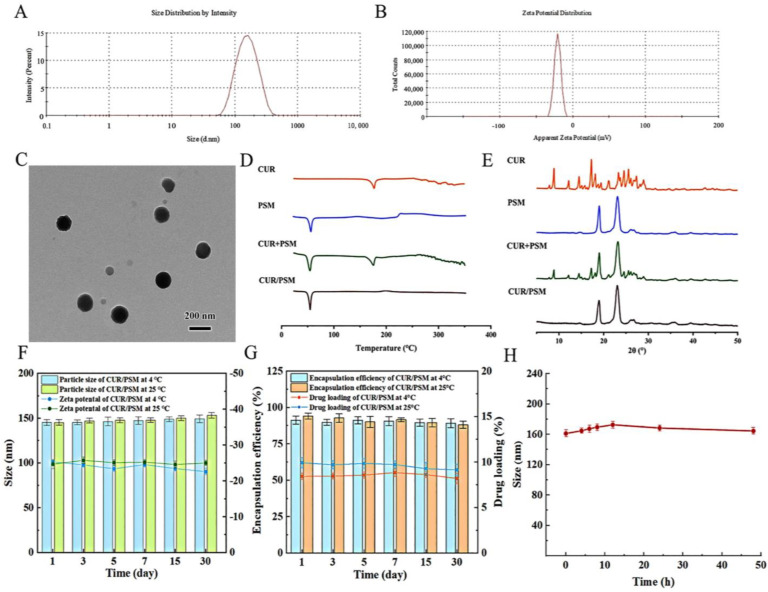
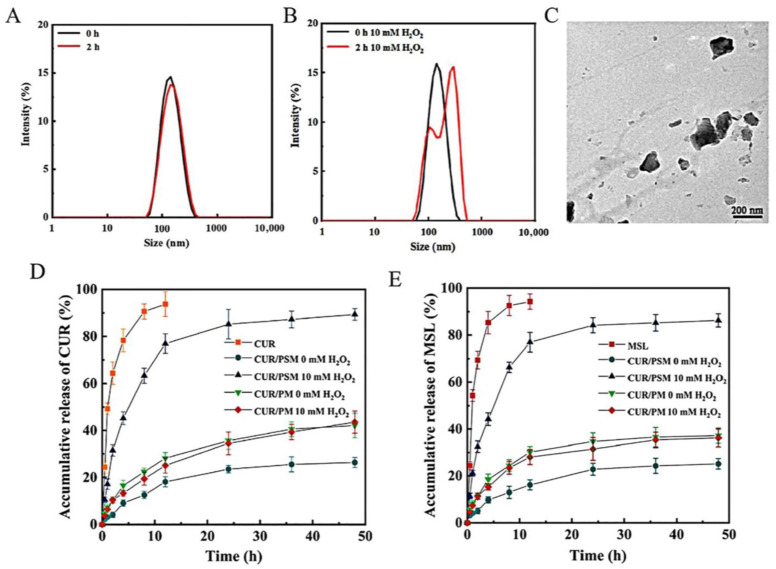
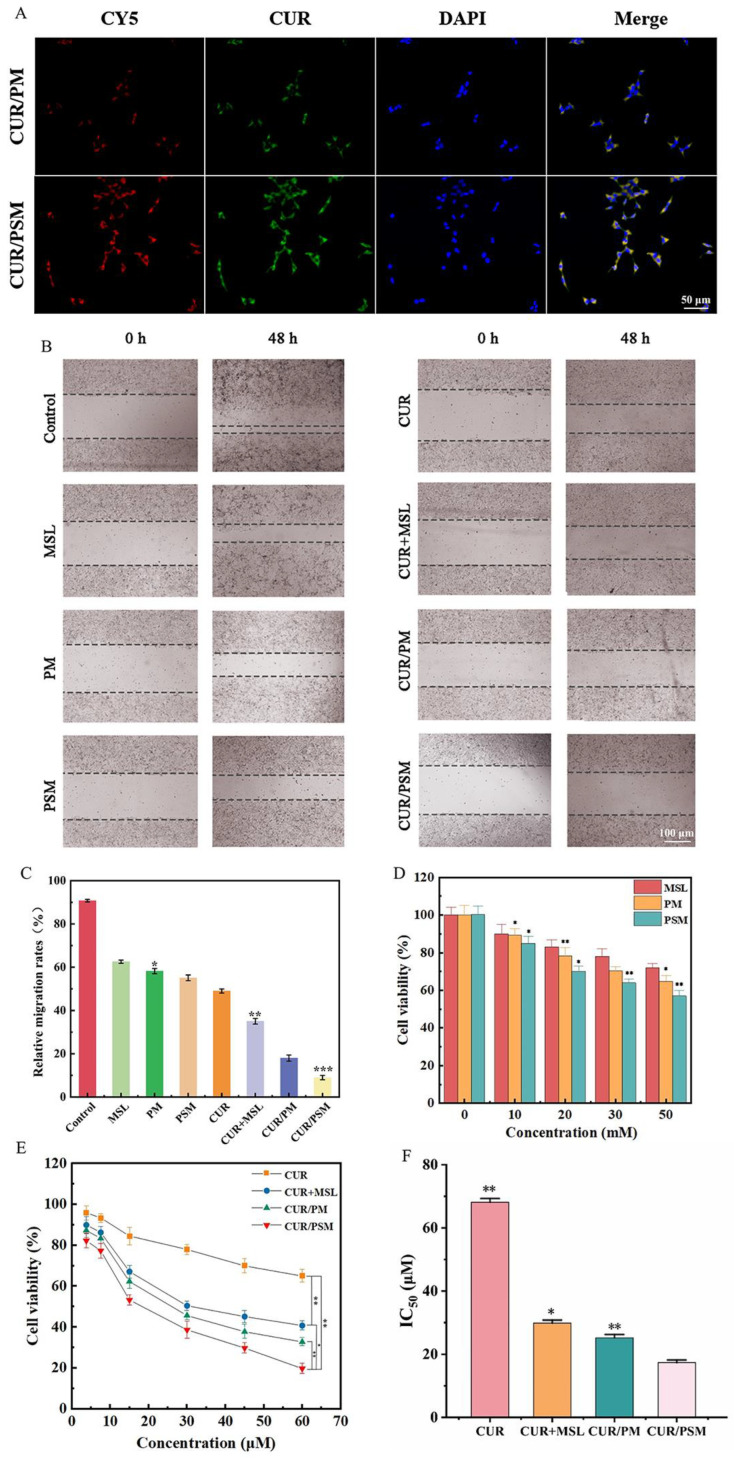
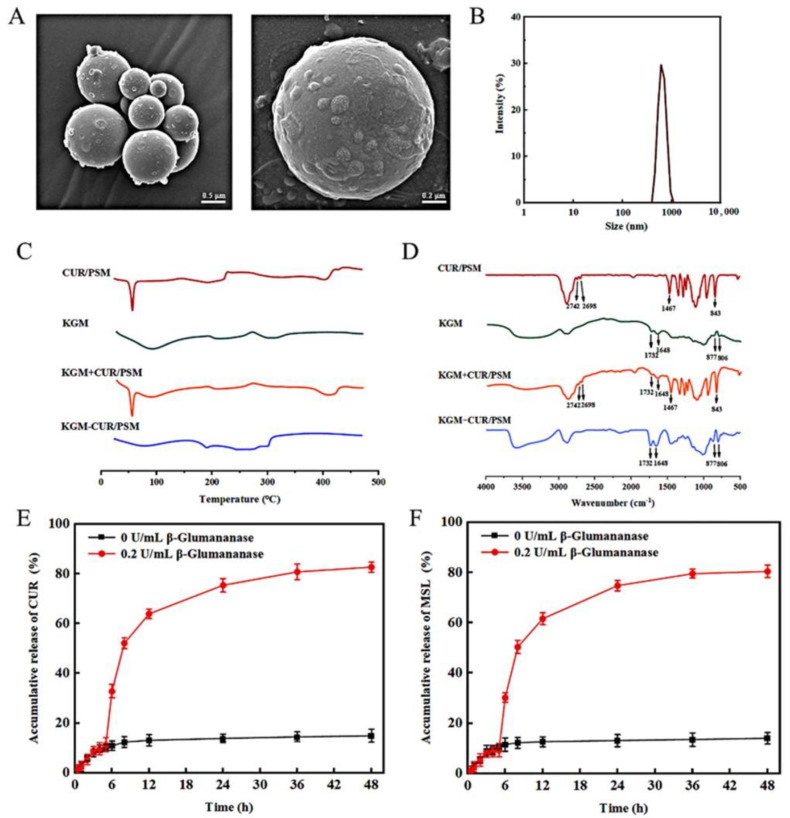
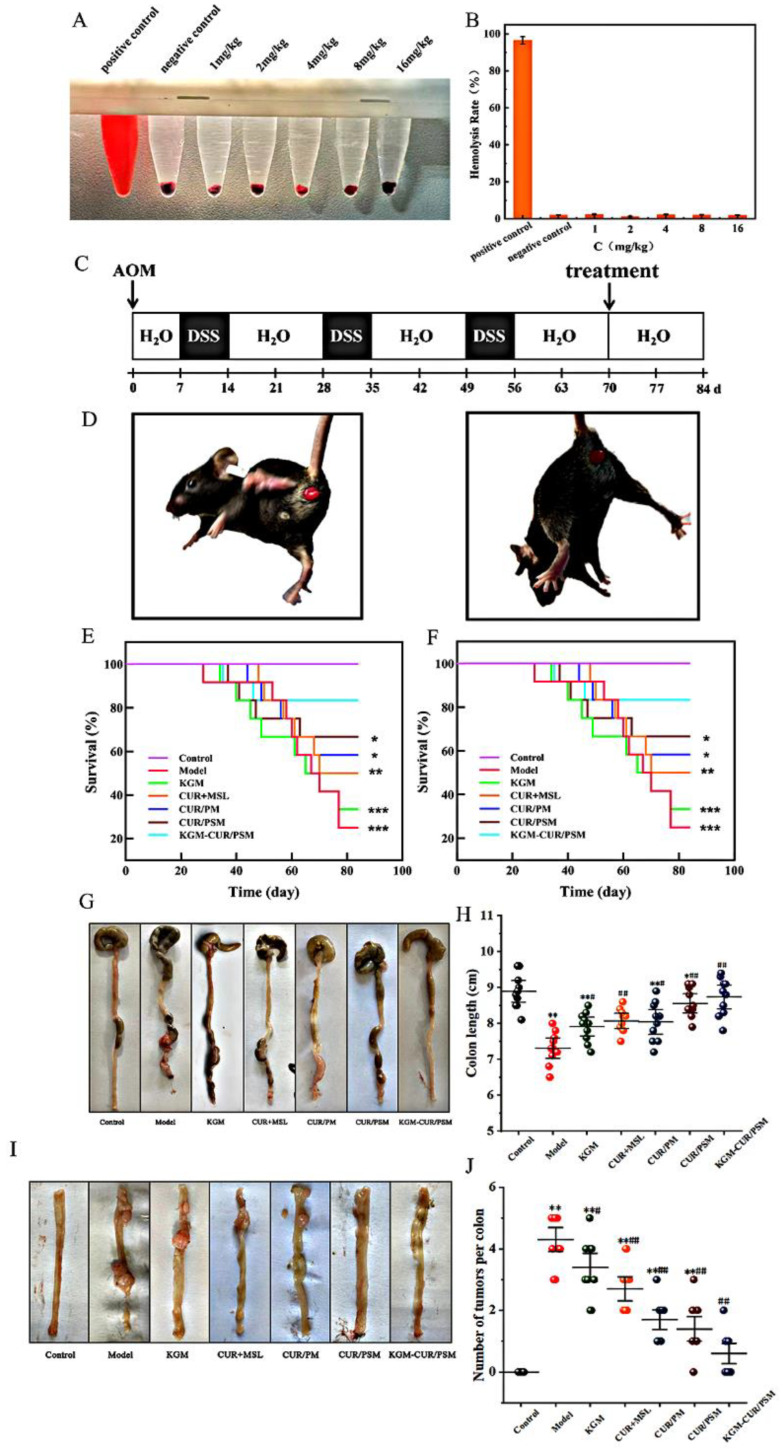
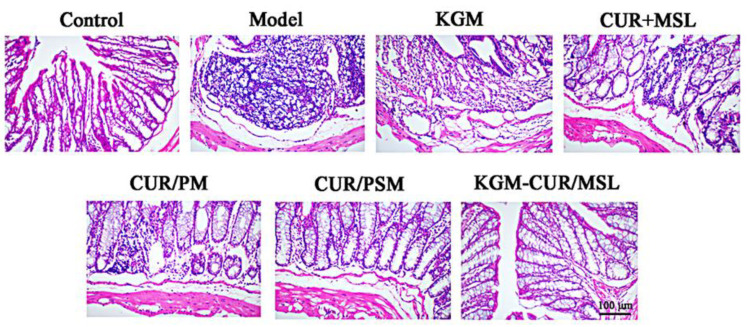
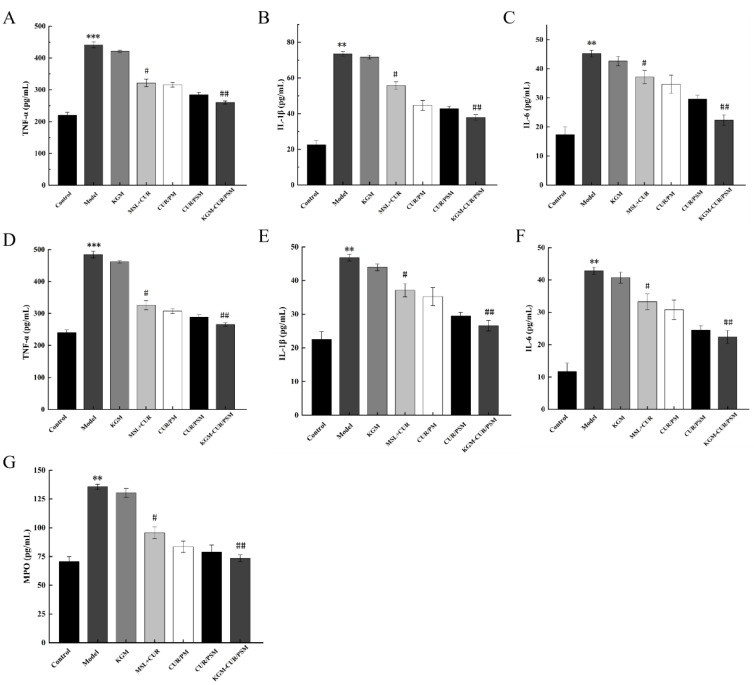
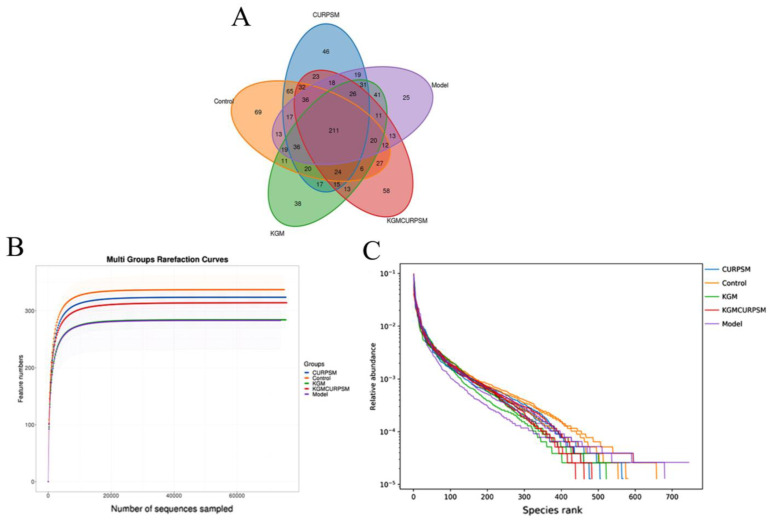
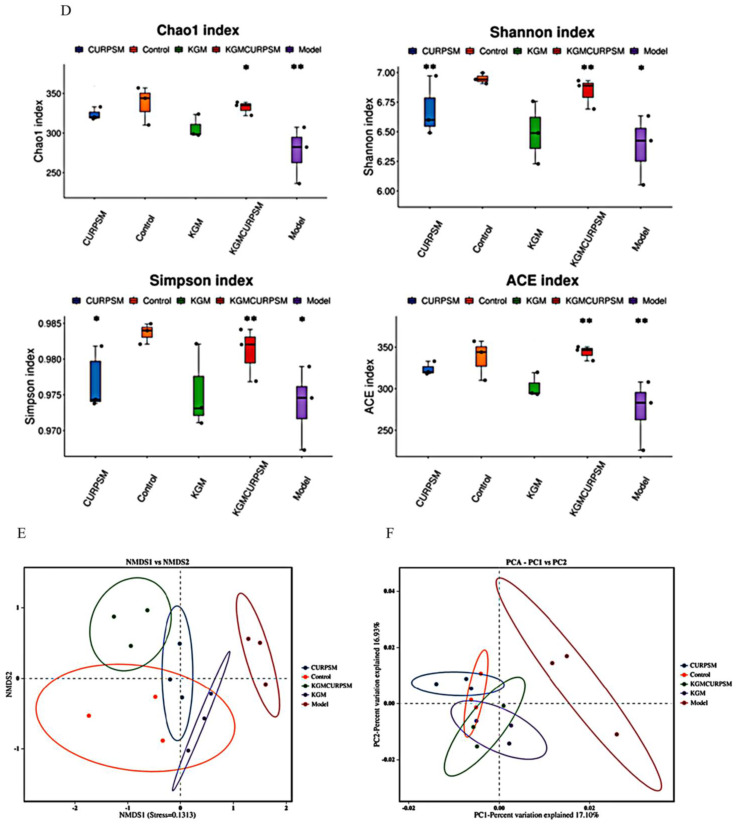
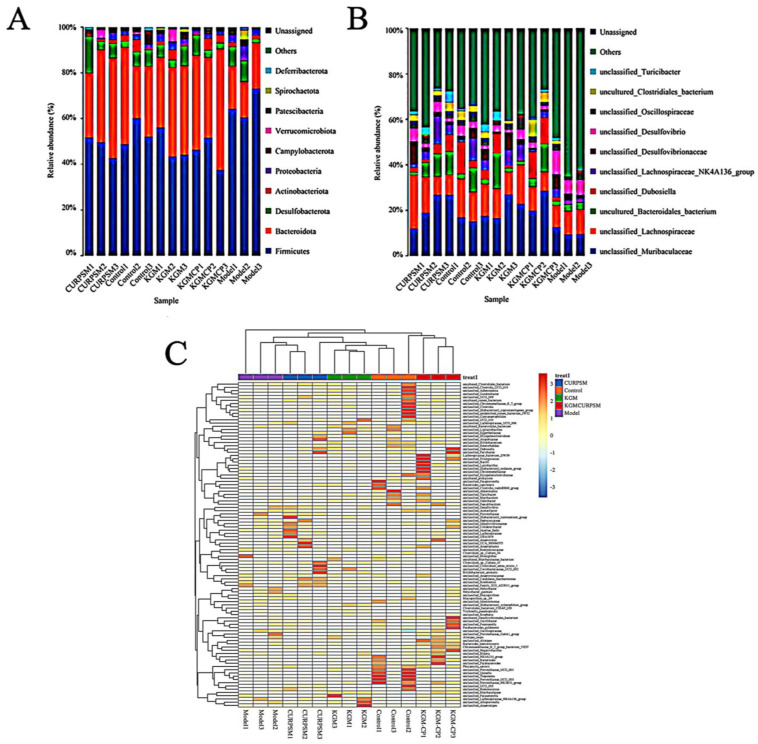
Objectives: Colorectal cancer (CRC) is a leading cause of cancer-related mortality, driven by chronic inflammation, gut microbiota dysbiosis, and complex tumor microenvironment interactions. Current therapies are limited by systemic toxicity and poor tumor accumulation. This study aimed to develop a ROS/enzyme dual-responsive oral drug delivery system, KGM-CUR/PSM microspheres, to achieve precise drug release in CRC and enhance tumor-specific drug accumulation, which leverages high ROS levels in CRC and the β-mannanase overexpression in colorectal tissues. Methods: In this study, we synthesized a ROS-responsive prodrug polymer (PSM) by conjugating polyethylene glycol monomethyl ether (mPEG) and mesalazine (MSL) via a thioether bond. CUR was then encapsulated into PSM using thin-film hydration to form tumor microenvironment-responsive micelles (CUR/PSM). Subsequently, konjac glucomannan (KGM) was employed to fabricate KGM-CUR/PSM microspheres, enabling targeted delivery for colorectal cancer therapy. The ROS/enzyme dual-response properties were confirmed through in vitro drug release studies. Cytotoxicity, cellular uptake, and cell migration were assessed in SW480 cells. In vivo efficacy was evaluated in AOM/DSS-induced CRC mice, monitoring tumor growth, inflammatory markers (TNF-α, IL-1β, IL-6, MPO), and gut microbiota composition. Results: In vitro drug release studies demonstrated that KGM-CUR/PSM microspheres exhibited ROS/enzyme-responsive release profiles. CUR/PSM micelles demonstrated significant anti-CRC efficacy in cytotoxicity assays, cellular uptake studies, and cell migration assays. In AOM/DSS-induced CRC mice, KGM-CUR/PSM microspheres significantly improved survival and inhibited CRC tumor growth, and effectively reduced the expression of inflammatory cytokines (TNF-α, IL-1β, IL-6) and myeloperoxidase (MPO). Histopathological and microbiological analyses revealed near-normal colon architecture and microbial diversity in the KGM-CUR/PSM group, confirming the system's ability to disrupt the "inflammation-microbiota-tumor" axis. Conclusions: The KGM-CUR/PSM microspheres demonstrated a synergistic enhancement of anti-tumor efficacy by inducing apoptosis, alleviating inflammation, and modulating the intestinal microbiota, which offers a promising stimuli-responsive drug delivery system for future clinical treatment of CRC.

Keywords: ROS/enzyme dual-responsive; colorectal cancer; gut microbiota; inflammations; microsphere; prodrug micelles; synergistic treatment.


Conflict of interest statement

The authors declare no conflicts of interest.

Figures

Figure 1
Figure 1
Schematic of KGM-CUR/PSM microsphere preparation and its dual-responsive therapeutic action in colorectal cancer. The preparation involves synthesizing ROS-responsive prodrug polymer mPEG-S-MSL (PSM) and loading it with curcumin (CUR) to form CUR/PSM micelles, which are encapsulated in konjac glucomannan (KGM) microspheres. Upon oral administration, microspheres protect the payload in the upper GI tract, with KGM degrading via colonic β-mannanase to release CUR/PSM micelles at the tumor site. Elevated tumor ROS cleaves the thioether bond in PSM, triggering release of active CUR and mesalazine (MSL). The released CUR exerts anti-CRC effects by inducing apoptosis, inhibiting proliferation, and modulating gut microbiota, while MSL provides anti-inflammatory action. KGM metabolites further modulate microbiota, synergistically disrupting the “inflammation-microbiota-tumor” axis.
Figure 2
Figure 2
Synthesis process of PSM. (Orange (mPEG): represents the hydrophilic polyethylene glycol monomethyl ether segment; Green (TDA and TDAA): indicates the thioether linker (2,2′-thiodiacetic acid and its anhydride); Blue (MSL): Denotes the anti-inflammatory drug mesalazine, serving as hydrophobic segment.
Figure 3
Figure 3
Synthesis process of PM. (Orange (mPEG): Hydrophilic polyethylene glycol monomethyl ether segment; Blue (MSL): Mesalazine directly conjugated via ester bond.
Figure 4
Figure 4
The 1H NMR spectra of TDA, TDAA, mPEG-S-COOH, PSM, and PM (TDA, TDAA, mPEG-S-COOH, PSM, MSL, and PM were dissolved in chloroform and determined by 400 MHz 1H-NMR spectrometry) (A). The mass spectrometry analysis spectra of mPEG-S-COOH (B), PSM (C), and PM (D). FT-IR spectra of PSM (E) and PM (F). Plot of the fluorescence intensity ratio (I373/I384) against the logarithm of PSM concentration (G).
Figure 4
Figure 4
The 1H NMR spectra of TDA, TDAA, mPEG-S-COOH, PSM, and PM (TDA, TDAA, mPEG-S-COOH, PSM, MSL, and PM were dissolved in chloroform and determined by 400 MHz 1H-NMR spectrometry) (A). The mass spectrometry analysis spectra of mPEG-S-COOH (B), PSM (C), and PM (D). FT-IR spectra of PSM (E) and PM (F). Plot of the fluorescence intensity ratio (I373/I384) against the logarithm of PSM concentration (G).
Figure 5
Figure 5
IC50 values (A) and CI values (B) for different proportions of CUR and MSL, median–effect plot (C), dose–effect curve (D), and Fa-CI plot (E) of CUR and MSL. The dotted line indicates the threshold for Combination Index (CI) values, where CI < 1 signifies synergy, CI = 1 indicates additive effects, and CI > 1 represents antagonism between CUR and MSL.
Figure 6
Figure 6
Dynamic light scattering particle size distribution (A) and zeta potential (B) of the CUR/PSM micelles. Transmission electron micrograph of CUR/PSM micelles (C). DSC profiles of CUR/PSM micelles (D). XRD spectra of CUR/PSM micelles (E). Particle size distribution and zeta potential of CUR/PSM micelles (F), EE% and DL% of CUR/PSM micelles (G), and stability in plasma of CUR/PSM micelles (n = 3) (H).
Figure 7
Figure 7
Particle size distribution of CUR/PSM micelles at different time points in 0 (A) and 100 (B) mM H2O2. Transmission electron micrograph of CUR/PSM micelles in 10 mM H2O2 (C). Drug release profiles of CUR (D) and MSL (E) in CUR/PSM micelles at 0.5, 1, 2, 4, 6, 8, 12, 24, 36, and 48 h (n = 3).
Figure 8
Figure 8
Cellular uptake of loaded CUR micelles in SW480 cells (A). Effects of different treated groups on migration of SW480 cells (CUR concentration: 50 pg/mL). (scale bars: 100 μm) (B) and relative migration rates (C) (n = 3, compared with control, * p < 0.05, ** p < 0.01, *** p < 0.001). Effects of cells survival rate of MSL, PM, and PSM on SW480 cells (D) (n = 3, compared with MSL, * p < 0.05, ** p < 0.01). Cell viability rate using different CUR formulations after 48 h (E). (n = 3, compared with CUR/PSM, * p < 0.05, ** p < 0.01). IC50 values of different drug groups (F). (n = 3, compared with CUR/PSM, * p < 0.05, ** p < 0.01).
Figure 9
Figure 9
SEM plot of KGM-CUR/PSM microspheres (A). Particle size distribution of KGM-CUR/PSM microspheres (B). DSC profiles of KGM-CUR/PSM microspheres (C). FT-IR spectra of KGM-CUR/PSM microspheres (D). Cumulative drug release curves of KGM-CUR/PSM microspheres, CUR (E) MSL (F) (n = 3). Notably, 0–2 h: artificial gastric fluid (pH 1.2); 2–5 h: artificial small bowel fluid (pH 6.8); 5–36 h: artificial colon fluid (pH 7.4 PBS solution + 0.5% Tween-80 + 10 mM H2O2 + 0.2 U/mL β-mannanase).
Figure 10
Figure 10
Hemolysis assay: visual samples (A) and quantitative hemolysis rates (B). Establishment process of the CRC mouse model (C). Appearance of CRC mice during the dosing intervention (D), body weight growth curve (E) (n = 12, compared with control, * p < 0.05, ** p < 0.01, *** p < 0.001), and survival rate (F) during the molding of CRC mice (n = 12, compared with control, * p < 0.05, ** p < 0.01, *** p < 0.001). Appearance (G), length distribution (H), physical tumor (I), and distribution of tumor number (J) of CRC mice (n = 12, compared with control, ** p < 0.01; compared with model, # p < 0.05, ## p < 0.01).
Figure 11
Figure 11
Histopathological analysis of colon tissues from CRC mice (×100).
Figure 12
Figure 12
Detection of the expression levels of TNF-α (A), IL-1β (B), and IL-6 (C) in CRC mice (n = 5, compared with control, ** p < 0.01, *** p < 0.001; compared with model, # p < 0.05, ## p < 0.01). Detection of the expression levels of TNF-α (D), IL-1β (E), and IL-6 (F) in colorectal tissues of CRC mice (n = 5, compared with control, ** p < 0.01, *** p < 0.001; compared with model, # p < 0.05, ## p < 0.01). MPO expression levels (G) in CRC mice, compared with model (n = 5, compared with control, ** p < 0.01; compared with model, # p < 0.05, ## p < 0.01).
Figure 13
Figure 13
OTU analysis of the gut microbiota (A), dilution curves (B), and abundance distribution curves (C). Alpha diversity index (D) Note: compared with control, * p < 0.05, ** p < 0.01. Non-metric multidimensional scaling analysis (E) and principal component analysis (F).
Figure 13
Figure 13
OTU analysis of the gut microbiota (A), dilution curves (B), and abundance distribution curves (C). Alpha diversity index (D) Note: compared with control, * p < 0.05, ** p < 0.01. Non-metric multidimensional scaling analysis (E) and principal component analysis (F).
Figure 14
Figure 14
Relative abundance at the phylum level, showing dominance of Firmicutes and Bacteroidota in all groups, with increased Proteobacteria (a pathogenic phylum) in the model group (A), genus-level distribution, highlighting restoration of beneficial genera (e.g., Turicibacter, Lachnospiraceae) and suppression of harmful bacteria (e.g., Desulfovibrio) by KGM-CUR/PSM treatment (B), and genus-level species composition heat map of species clustering (C).

Similar articles

References

    1. Li M., Zhao Y., Sun J., Chen H., Liu Z., Lin K., Ma P., Zhang W., Zhen Y., Zhang S., et al. pH/reduction dual-responsive hyaluronic acid-podophyllotoxin prodrug micelles for tumor targeted delivery. Carbohydr. Polym. 2022;288:119402. doi: 10.1016/j.carbpol.2022.119402. - DOI - PubMed
    1. Siegel R.L., Wagle N.S., Cercek A., Smith R.A., Jemal A. Colorectal cancer statistics. CA Cancer J. Clin. 2023;73:233–254. doi: 10.3322/caac.21772. - DOI - PubMed
    1. Almeida A., Castro F., Resende C., Lúcio M., Schwartz S., Jr., Sarmento B. Oral delivery of camptothecin-loaded multifunctional chitosan-based micelles is effective in reduce colorectal cancer. J. Control. Release Off. J. Control. Release Soc. 2022;349:731–743. doi: 10.1016/j.jconrel.2022.07.029. - DOI - PubMed
    1. Li M., Zhang L., Xuan Y., Zhi D., Wang W., Zhang W., Zhao Y., Zhang S., Zhang S. pH-sensitive hyaluronic acid-targeted prodrug micelles constructed via a one-step reaction for enhanced chemotherapy. Int. J. Biol. Macromol. 2022;206:489–500. doi: 10.1016/j.ijbiomac.2022.02.131. - DOI - PubMed
    1. Wong C.C., Yu J. Gut microbiota in colorectal cancer development and therapy. Nat. Rev. Clin. Oncol. 2023;20:429–452. doi: 10.1038/s41571-023-00766-x. - DOI - PubMed

LinkOut - more resources