

The Potential Anti-Cancer Effects of Polish Ethanolic Extract of Propolis and Quercetin on Glioma Cells Under Hypoxic Conditions
- PMID: 40733274
- PMCID: PMC12298029
- DOI: 10.3390/molecules30143008
The Potential Anti-Cancer Effects of Polish Ethanolic Extract of Propolis and Quercetin on Glioma Cells Under Hypoxic Conditions
Abstract
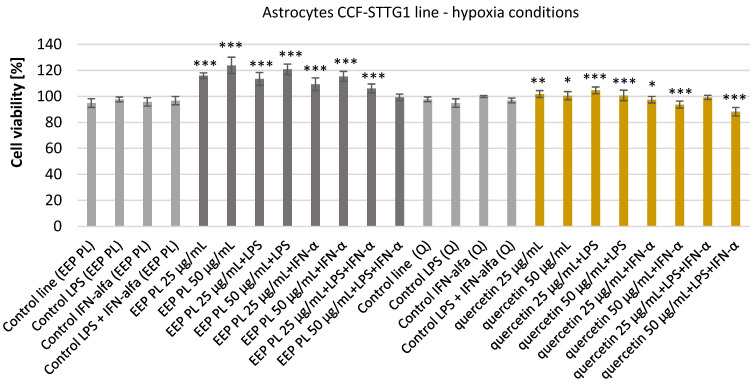
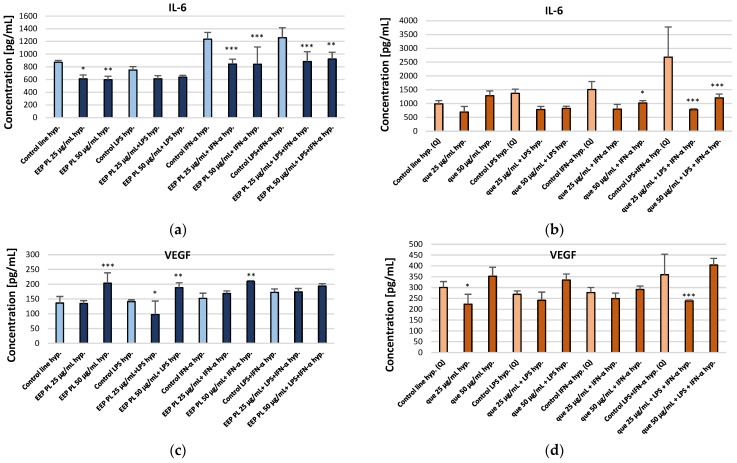
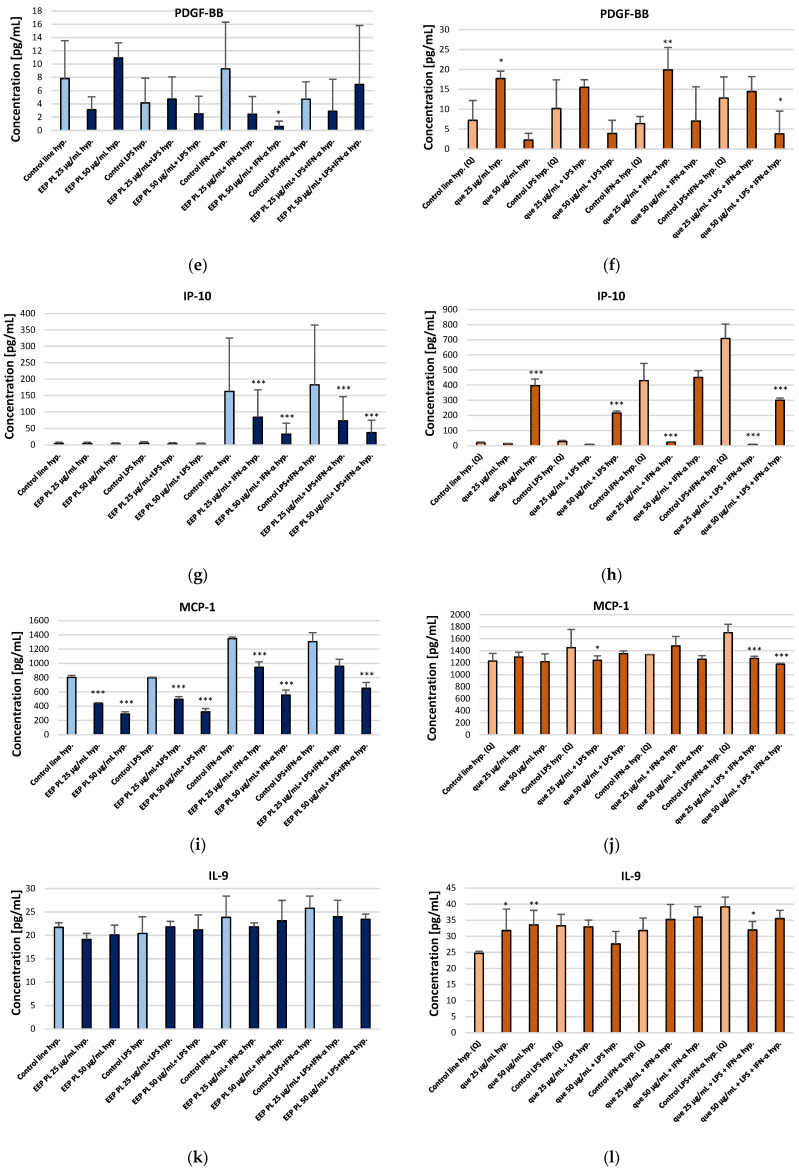
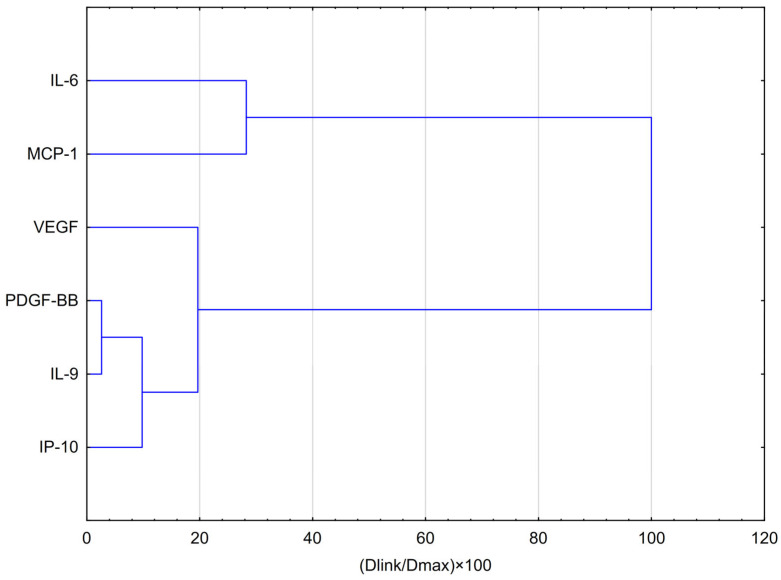
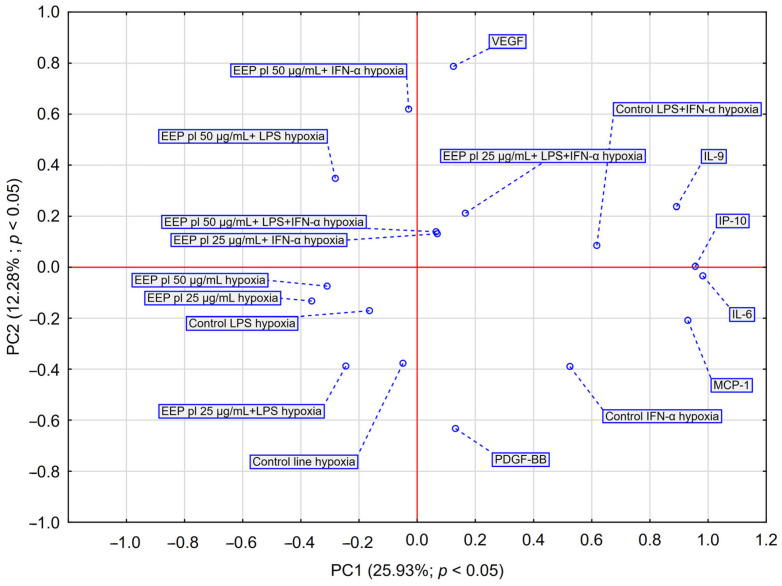
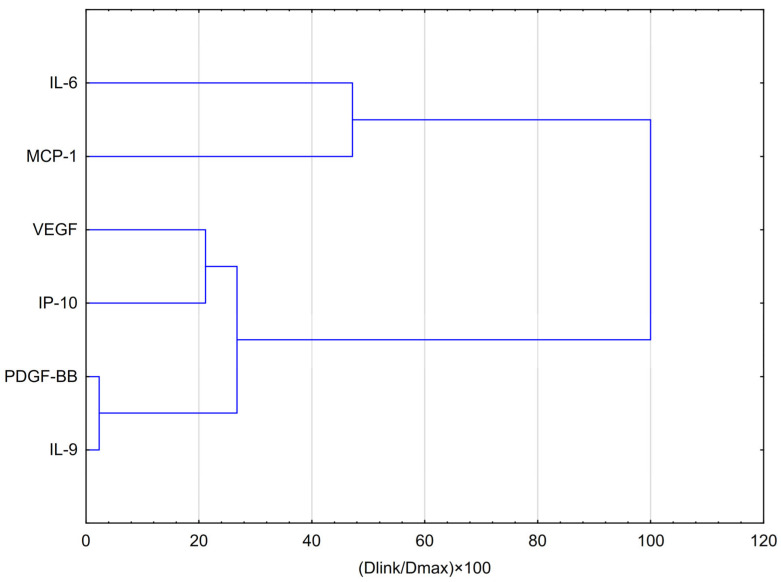
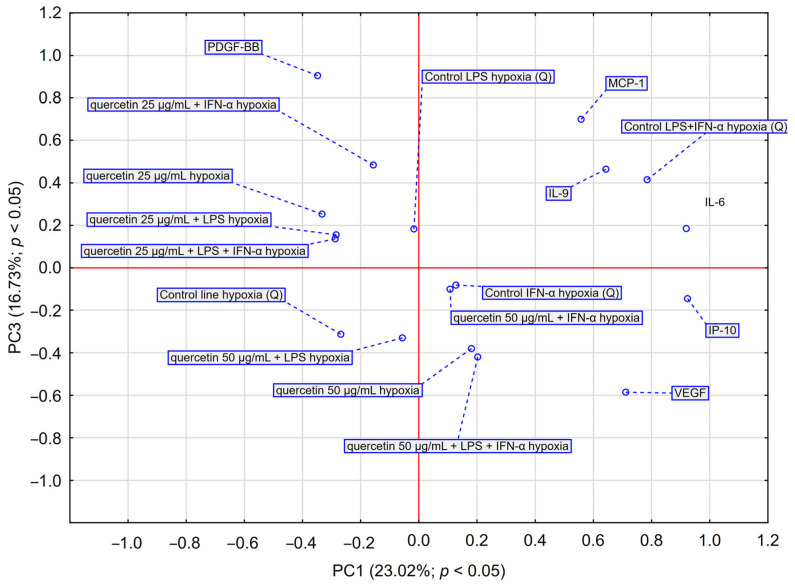
Tissue hypoxia is commonly observed in head cancers and contributes to both molecular and functional changes in tumour cells. It is known to stimulate erythropoiesis, angiogenesis, and metabolic alterations within tumour cells. Glioblastoma, a type of brain tumour, is characterized by rapid proliferation and aggressive growth. Recent studies have indicated that natural products may hold potential as components of cancer therapy. Among these, Polish propolis and its active compound, quercetin, have demonstrated promising anti-cancer properties. The aim of this study was to evaluate the concentrations of selected cytokines-specifically IL-6, IL-9, vascular endothelial growth factor (VEGF), platelet-derived growth factor (PDGF-BB), interferon gamma-induced protein 10 (IP-10), and monocyte chemoattractant protein-1 (MCP-1)-produced by astrocytes of the CCF-STTG1 cell line. The cytotoxic effects of ethanolic extract of propolis (EEP) and quercetin were assessed using the MTT assay. Astrocytes were stimulated with lipopolysaccharide (LPS, 200 ng/mL) and/or IFN-α (100 U/mL), followed by treatment with EEP or quercetin (25-50 µg/mL) under hypoxic conditions for two hours. Cytokine concentrations were measured using the xMAP Luminex Multiplex Immunoassay and the Multiplex Bead-Based Cytokine Kit. Our study demonstrated that Polish propolis and its component quercetin modulate the tumour microenvironment in vitro, primarily by altering the levels of specific cytokines. The HCA analysis revealed that IL-6 and MCP-1 formed a distinct cluster at the highest linkage distance (approximately 100% of Dmax), suggesting that their expression patterns are significantly different from those of the other cytokines and that they are more similar to each other than to the rest. PCA analysis showed that EEP-PL (50 μg/mL) with IFN-α and EEP-PL (50 μg/mL) with LPS exert similar activities on cytokine secretion by astrocytes. Similar effects were demonstrated for EEP-PL 50 μg/mL + LPS + IFN-α, EEP-PL 25 μg/mL + IFN-α and EEP-PL 25 μg/mL + LPS + IFN-α. Our findings suggest that Polish propolis and quercetin may serve as promising natural agents to support the treatment of stage IV malignant astrocytoma. Nonetheless, further research is needed to confirm these results.
Keywords: astrocytes; cytokine; glioma cells; hypoxia; propolis; quercetin.
Conflict of interest statement
The authors declare no conflicts of interest.
Figures
Similar articles
-
In vitro investigation of monoglycerides and zinc glycinate: anti-inflammatory and epithelial barrier function.J Anim Sci. 2023 Jan 3;101:skae372. doi: 10.1093/jas/skae372. J Anim Sci. 2023. PMID: 39657118
-
Adefovir dipivoxil and pegylated interferon alfa-2a for the treatment of chronic hepatitis B: a systematic review and economic evaluation.Health Technol Assess. 2006 Aug;10(28):iii-iv, xi-xiv, 1-183. doi: 10.3310/hta10280. Health Technol Assess. 2006. PMID: 16904047
-
Systemic pharmacological treatments for chronic plaque psoriasis: a network meta-analysis.Cochrane Database Syst Rev. 2021 Apr 19;4(4):CD011535. doi: 10.1002/14651858.CD011535.pub4. Cochrane Database Syst Rev. 2021. Update in: Cochrane Database Syst Rev. 2022 May 23;5:CD011535. doi: 10.1002/14651858.CD011535.pub5. PMID: 33871055 Free PMC article. Updated.
-
The Black Book of Psychotropic Dosing and Monitoring.Psychopharmacol Bull. 2024 Jul 8;54(3):8-59. Psychopharmacol Bull. 2024. PMID: 38993656 Free PMC article. Review.
-
Systemic pharmacological treatments for chronic plaque psoriasis: a network meta-analysis.Cochrane Database Syst Rev. 2020 Jan 9;1(1):CD011535. doi: 10.1002/14651858.CD011535.pub3. Cochrane Database Syst Rev. 2020. Update in: Cochrane Database Syst Rev. 2021 Apr 19;4:CD011535. doi: 10.1002/14651858.CD011535.pub4. PMID: 31917873 Free PMC article. Updated.
References
-
- Janus-Szymanska G., Waszczuk L., Jacków-Nowicka J. Significance of Genetic and Radiological Examinations in Diagnosis and Therapy of Brain Glioma in Adult Patients. Nowotw. J. Oncol. 2021;71:328–334. doi: 10.5603/NJO.2021.0062. - DOI
-
- Sejda A., Grajkowska W., Trubicka J., Szutowicz E., Wojdacz T.K., Kloc W., Izycka-Świeszewska E. WHO CNS5 2021 Classification of Gliomas: A Practical Review and Road Signs for Diagnosing Pathologists and Proper Patho-Clinical and Neuro-Oncological Cooperation. Folia Neuropathol. 2022;60:137–152. doi: 10.5114/fn.2022.118183. - DOI - PubMed
MeSH terms
Substances
Grants and funding
LinkOut - more resources
Full Text Sources
Research Materials
Miscellaneous
