

Transcriptome and Coexpression Network Analyses Provide Insights into the Resistance of Chinese Cabbage During Different Stages of Plasmodiophora brassicae Infection
- PMID: 40733342
- PMCID: PMC12300438
- DOI: 10.3390/plants14142105
Transcriptome and Coexpression Network Analyses Provide Insights into the Resistance of Chinese Cabbage During Different Stages of Plasmodiophora brassicae Infection
Abstract
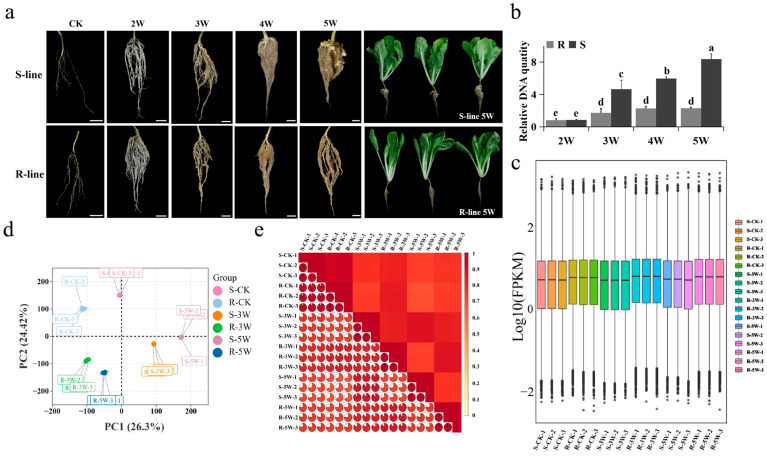
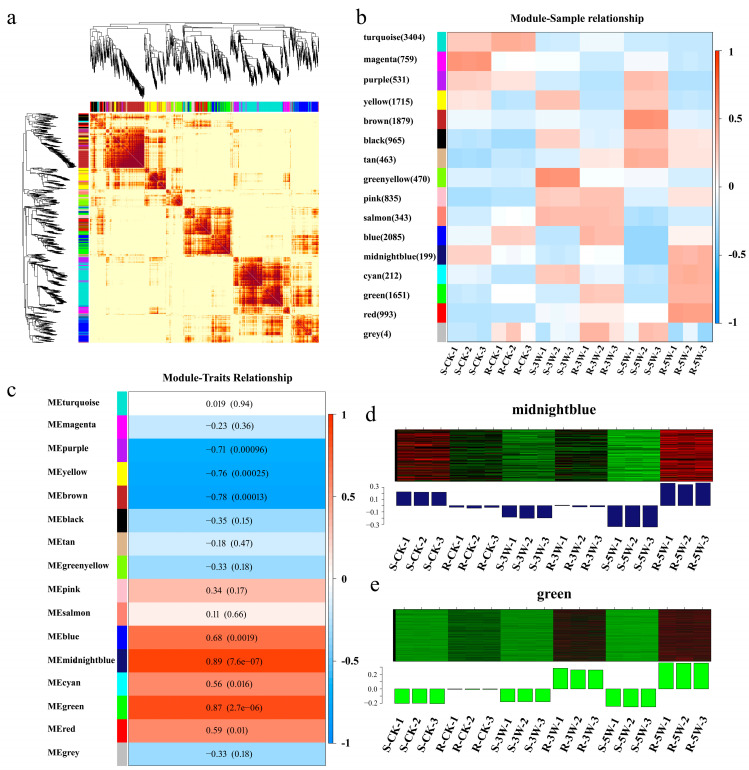
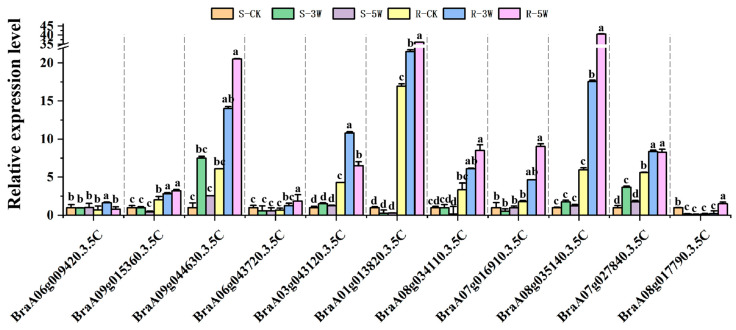
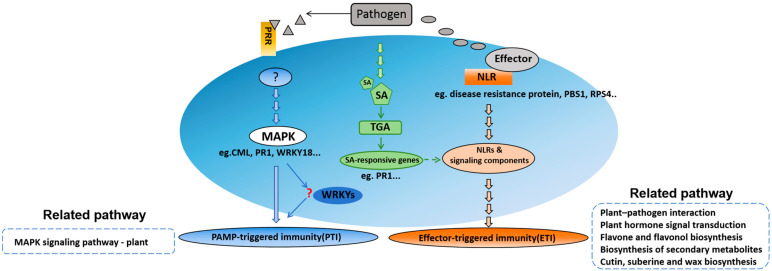
Clubroot is a destructive soilborne disease caused by Plasmodiophora brassicae that threatens the production of Chinese cabbage. The molecular mechanisms underlying the resistance of Chinese cabbage to clubroot remains unclear, making the identification and analysis of resistance genes crucial for developing resistant varieties. Comparative transcriptome analysis of roots from the resistant line "JJ S5-1" and the susceptible line "SYY10-1" revealed significant differences in gene expression profiles at various stages after inoculation. Weighted gene coexpression network analysis revealed midnight blue and green modules as substantially associated with disease response, with each showing positive regulatory patterns. Several defense-related genes and transcription factors important for resistance to Plasmodiophora brassicae were identified, including disease resistance proteins, PR1, PBS1, and TGA, and WRKY transcription factors, most of which were upregulated following inoculation. Key genes associated with trait-related expression patterns were analyzed and a working model was proposed to explain the mechanism of clubroot disease resistance to Plasmodiophora brassicae infection in Chinese cabbage. These findings offer a valuable resource for further investigation of the immune response in the resistance of "JJ S5-1" to clubroot disease.
Keywords: Chinese cabbage; clubroot; regulatory network; weighted gene coexpression network analysis.
Conflict of interest statement
The authors declare no conflicts of interest.
Figures


Similar articles
-
Rapid introgression of the clubroot resistance gene CRa into cabbage skeleton inbred lines through marker assisted selection.Mol Breed. 2025 Jan 22;45(2):19. doi: 10.1007/s11032-024-01532-2. eCollection 2025 Feb. Mol Breed. 2025. PMID: 39866858
-
Transcriptome and Coexpression Network Analyses Reveal Hub Genes in Chinese Cabbage (Brassica rapa L. ssp. pekinensis) During Different Stages of Plasmodiophora brassicae Infection.Front Plant Sci. 2021 Aug 10;12:650252. doi: 10.3389/fpls.2021.650252. eCollection 2021. Front Plant Sci. 2021. PMID: 34447397 Free PMC article.
-
Transcriptome analysis of Brassica napus near-isogenic lines carrying clubroot resistance from turnip (Brassica rapa var. rapifera).Genome. 2025 Jan 1;68:1-17. doi: 10.1139/gen-2024-0182. Genome. 2025. PMID: 40479738
-
Systemic pharmacological treatments for chronic plaque psoriasis: a network meta-analysis.Cochrane Database Syst Rev. 2021 Apr 19;4(4):CD011535. doi: 10.1002/14651858.CD011535.pub4. Cochrane Database Syst Rev. 2021. Update in: Cochrane Database Syst Rev. 2022 May 23;5:CD011535. doi: 10.1002/14651858.CD011535.pub5. PMID: 33871055 Free PMC article. Updated.
-
Systemic pharmacological treatments for chronic plaque psoriasis: a network meta-analysis.Cochrane Database Syst Rev. 2020 Jan 9;1(1):CD011535. doi: 10.1002/14651858.CD011535.pub3. Cochrane Database Syst Rev. 2020. Update in: Cochrane Database Syst Rev. 2021 Apr 19;4:CD011535. doi: 10.1002/14651858.CD011535.pub4. PMID: 31917873 Free PMC article. Updated.
References
-
- Dixon G.R. The occurrence and economic impact of Plasmodiophora brassicae and clubroot disease. J. Plant Growth Regul. 2009;28:194–202. doi: 10.1007/s00344-009-9090-y. - DOI
Grants and funding
LinkOut - more resources
Full Text Sources
