. 2025 Jul 18;14(14):2224.
doi: 10.3390/plants14142224.

Impact of Plant Developmental Stage on Photosynthetic Acclimation to Elevated [CO2] in Durum Wheat

Affiliations

Impact of Plant Developmental Stage on Photosynthetic Acclimation to Elevated [CO2] in Durum Wheat

Fernando Torralbo et al. Plants (Basel). .

Abstract

The response of plants to elevated atmospheric [CO2] is highly dynamic and influenced by developmental stage, yet its role in photosynthetic acclimation remains underexplored. This study examines the physiological and molecular responses of wheat (Triticum durum, var. Amilcar) to elevated [CO2] (700 ppm vs. 400 ppm) at two distinct developmental stages: the vegetative stage at the end of the elongation stage and the reproductive stage at the beginning of ear emergence (Z39 and Z51, respectively). Wheat plants at the developmental stage Z39, cultivated under elevated [CO2], maintained photosynthetic rates despite a carbohydrate build-up. However, at Z51, photosynthetic acclimation became more evident as the decline in Rubisco carboxylation capacity (Vcmax) persisted, but also stomatal conductance and diffusion were decreased. This was accompanied by the up-regulation of the CA1 and CA2 genes, likely as a compensatory mechanism to maintain CO2 supply. Additionally, hormonal adjustments under elevated [CO2], including increased auxin and bioactive cytokinins (zeatin and isopentenyl adenine), may have contributed to delayed senescence and nitrogen remobilization, sustaining carbon assimilation despite biochemical constraints. These findings highlight the developmental regulation of photosynthetic acclimation, emphasizing the need for the stage-specific assessments of crop responses to future atmospheric conditions.

Keywords: carbohydrates; elevated [CO2]; nitrogen; photosynthetic acclimation; phytohormones.


Conflict of interest statement

The authors declare that the research was conducted in the absence of any commercial, financial or personal relationships that could be construed as a potential conflict of interest.

Figures
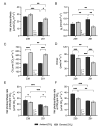
Figure 1
Figure 1
The effect of elevated CO2 (400 vs. 700 ppm) on (A) net photosynthesis (μmol CO2 m−2 s−1), (B) stomatal conductance (gs; mol CO2 m−2 s−1), (C) Rubisco maximum carboxylation rate (Vcmax, μmol m–2 s–1), (D) intercellular [CO2] (Ci, μmol m−2 s−1) photosynthesis rates under reciprocal [CO2] conditions at (E) 400 ppm [CO2] (μmol CO2 m−2 s−1) and, (F) 700 ppm [CO2] (μmol CO2 m−2 s−1) in leaves of wheat fertilized with 15 mM of nitrate as the N source under ambient or elevated [CO2] levels (400 vs. 700 ppm, respectively) at two developmental stages (Z39 and Z51). Values are shown as the mean ± standard error (SE) of four biological replicates. Statistical analysis was performed by ANOVA (p < 0.05). Asterisks indicate significant differences (p < 0.05) between treatments according to Fisher’s LSD multiple comparisons test. Asterisks denote significance levels: * p < 0.05; ** p < 0.01; *** p < 0.001. [CO2], CO2 concentration; Dev., Developmental stage; [CO2]xDev., interaction of CO2 concentration and developmental stage.
Figure 2
Figure 2
Effect of elevated CO2 (400 vs. 700 ppm) on relative gene expression of (A) ferredoxin-NADP(H) oxidoreductase and (B) ferredoxin and (C) and thylakoid electron transport rate (ETR, μmol e m–2 s–1) in leaves of wheat fertilized with 15 mM of nitrate as N source under ambient or elevated [CO2] levels (400 vs. 700 ppm, respectively) at two developmental stages (Z39 and Z51). Values are shown as mean ± standard error (SE) of four biological replicates. Statistical analysis was performed by ANOVA (p < 0.05). Asterisks indicate significant differences (p < 0.05) between treatments according to Fisher’s LSD multiple comparisons test. Asterisks denote significance levels: * p < 0.05; ** p < 0.01; *** p < 0.001. [CO2], CO2 concentration; Dev., Developmental stage; [CO2]xDev., interaction CO2 concentration and developmental stage.
Figure 3
Figure 3
Effect of elevated CO2 (400 vs. 700 ppm) on relative gene expression of (A) carbonic anhydrase 1, (B) carbonic anhydrase 2, (C) ammonium transporter AMT1.2, and (D) nitrate transporter NRT1.1 in leaves of wheat fertilized with 15 mM of nitrate as N source under ambient or elevated [CO2] levels (400 vs. 700 ppm, respectively) at two developmental stages (Z39 and Z51). Values are shown as mean ± standard error (SE) of four biological replicates. Statistical analysis was performed by ANOVA (p < 0.05). Asterisks indicate significant differences (p < 0.05) between treatments according to Fisher’s LSD multiple comparisons test. Asterisks denote significance levels: * p < 0.05; ** p < 0.01; *** p < 0.001. [CO2], CO2 concentration; Dev., Developmental stage; [CO2]xDev., interaction CO2 concentration and developmental stage.
Figure 4
Figure 4
Effect of elevated CO2 (400 vs. 700 ppm) on (A) sucrose (nmol Gluc g−1 DW), (B) starch (nmol Gluc g−1 DW), (C) glucose (nmol Gluc g−1 DW) and (D) sucrose/starch ratio in leaves of wheat fertilized with 15 mM of nitrate as the N source under ambient and elevated [CO2] levels (400 vs. 700 ppm, respectively) at two developmental stages (Z39 and Z51). Values are shown as mean ± standard error (SE) of four biological replicates. Statistical analysis was performed by ANOVA (p < 0.05). Asterisks indicate significant differences (p < 0.05) between treatments according to Fisher’s LSD multiple comparisons test. Asterisks denote significance levels: * p < 0.05; ** p < 0.01; *** p < 0.001. [CO2], CO2 concentration; Dev., Developmental stage; [CO2]xDev., interaction CO2 concentration and developmental stage.
Figure 5
Figure 5
Effect of elevated CO2 (400 vs. 700 ppm) on (A) GA1 (nmol g−1 DW), (B) ACC (nmol g−1 DW) and (C) IAA (nmol g−1 DW) in leaves of Amilcar wheat plants (Triticum durum) grown with 15 mM of nitrate as the N source under ambient (dark bars) or elevated (gray bars) CO2 concentrations. Each value represents the mean ± SE of 4 biological replicates. Statistical analysis was performed by ANOVA (p < 0.05). Asterisks indicate significant differences (p < 0.05) between treatments according to Fisher’s LSD multiple comparisons test. Asterisks denote significance levels: * p < 0.05; ** p < 0.01. [CO2], CO2 concentration; Dev., Developmental stage; [CO2]xDev., interaction CO2 concentration and developmental stage.
Figure 6
Figure 6
Effect of elevated CO2 (400 vs. 700 ppm) on (A) trans-zeatin (nmol Z g−1 DW), (B) trans-zeatin riboside (nmol ZR g−1 DW), (C) isopentenyl adenine (nmol 2-IP g−1 DW), and (D) endogenous isopentenyladenosine (nmol IPA g−1 DW) in leaves of Amilcar wheat plants (Triticum durum) grown with 15 mM of nitrate as N source under ambient (dark bars) or elevated (gray bars) CO2 concentrations. Each value represents mean ± SE of 4 biological replicates. Statistical analysis was performed by ANOVA (p < 0.05). Asterisks indicate significant differences (p < 0.05) between treatments according to Fisher’s LSD multiple comparisons test. Asterisks denote significance levels: * p < 0.05; ** p < 0.01; *** p < 0.001. [CO2], CO2 concentration; Dev., Developmental stage; [CO2]xDev., interaction CO2 concentration and developmental stage.

Similar articles

References

    1. IPCC . In: Climate Change 2022: Impacts, Adaptation and Vulnerability. Pörtner H.-O., Roberts D.C., Tignor M., Poloczanska E.S., Mintenbeck K., Alegría A., Craig M., Langsdorf S., Löschke S., Möller V., et al., editors. Cambridge University Press; Cambridge, UK: New York, NY, USA: 2022. 3056p. Contribution of Working Group II to the Sixth Assessment Report of the Intergovernmental Panel on Climate Change. - DOI
    1. Ainsworth E.A., Long S.P. 30 Years of Free-Air Carbon Dioxide Enrichment (FACE): What Have We Learned about Future Crop Productivity and Its Potential for Adaptation? Glob. Change Biol. 2021;27:27–49. doi: 10.1111/gcb.15375. - DOI - PubMed
    1. Drake B.G., Gonzàlez-Meler M.A. More Efficient Plants: A Consequence of Rising Atmospheric CO2? Annu. Rev. Plant Physiol. Plant Mol. Biol. 1997;48:609–639. doi: 10.1146/annurev.arplant.48.1.609. - DOI - PubMed
    1. Ainsworth E.A., Rogers A., Nelson R., Long S.P. Testing the “Source-Sink” Hypothesis of down-Regulation of Photosynthesis in Elevated [CO2] in the Field with Single Gene Substitutions in Glycine Max. Agric. For. Meteorol. 2004;122:85–94. doi: 10.1016/j.agrformet.2003.09.002. - DOI
    1. Xu Z., Jiang Y., Jia B., Zhou G. Elevated-CO2 Response of Stomata and Its Dependence on Environmental Factors. Front. Plant Sci. 2016;7:657. doi: 10.3389/fpls.2016.00657. - DOI - PMC - PubMed

LinkOut - more resources