

Genome-Wide Identification and Expression Analysis of Auxin-Responsive GH3 Gene Family in Pepper (Capsicum annuum L.)
- PMID: 40733468
- PMCID: PMC12298254
- DOI: 10.3390/plants14142231
Genome-Wide Identification and Expression Analysis of Auxin-Responsive GH3 Gene Family in Pepper (Capsicum annuum L.)
Abstract
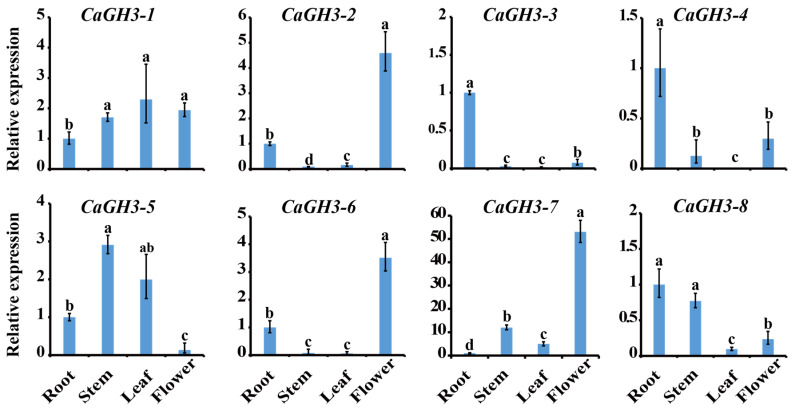
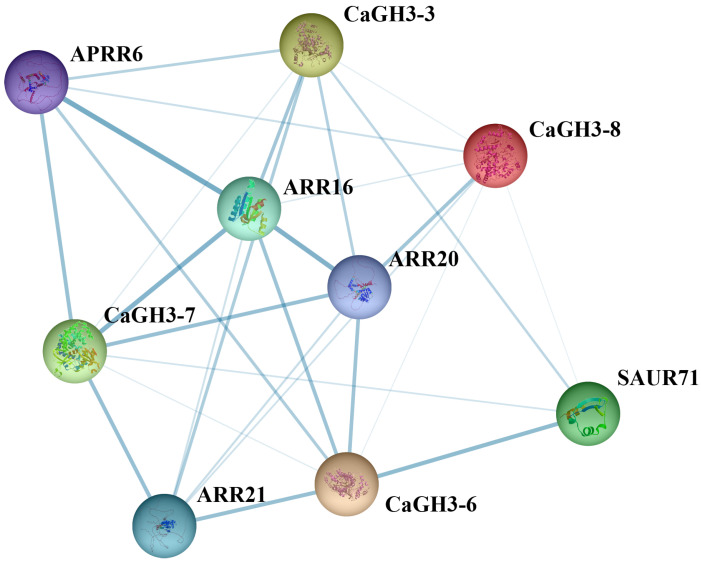
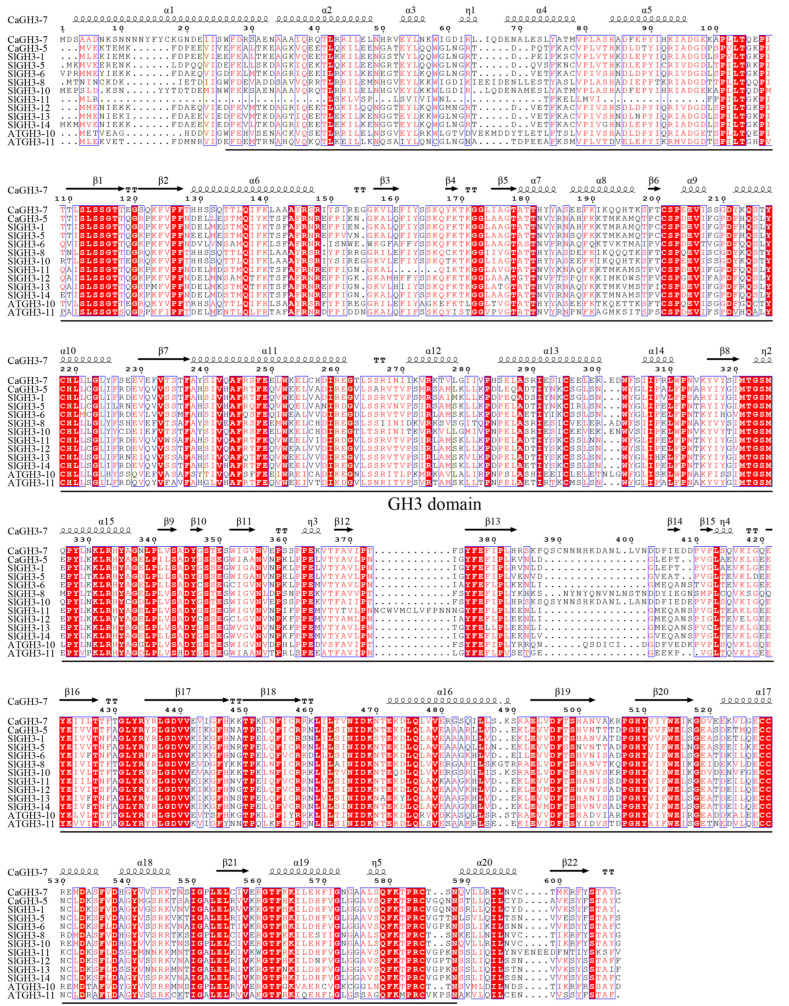
As an auxin-responsive gene, Gretchen Hagen 3 (GH3) maintains hormonal homeostasis by conjugating excess auxin with amino acids in plant stress-related signaling pathways. GH3 genes have been characterized in many plant species, but the characteristics of pepper (Capsicum annuum L.) GH3 (CaGH3) gene family members in response to multiple stimulants are largely unknown. In this study, we systematically identified the CaGH3 gene family at the genome level and identified eight members on four chromosomes in pepper. CaGH3s were divided into two groups (I and III) and shared conserved motifs, domains, and gene structures. Moreover, CaGH3s had close evolutionary relationships with tomato (Solanum lycopersicum L.), and the promoters of most CaGH3 genes contained hormone and abiotic stress response elements. A protein interaction prediction analysis demonstrated that the CaGH3-3/3-6/3-7/3-8 proteins were possibly core members of the CaGH3 family interaction. In addition, qRT-PCR results showed that CaGH3 genes were differentially expressed in pepper tissues and could be induced by phytohormones (IAA, ABA, and MeJA) and abiotic stresses (salt, low temperature, and drought) with different patterns. In addition, CaGH3-5 and CaGH3-7 were cloned, and the sequences showed a high degree of conservation. Moreover, the results of subcellular localization indicated that they were located in the membrane and chloroplast. Notably, after overexpressing CaGH3-7 in tomato, RNA-seq was performed on wild-type and transgenic lines, and the differentially expressed genes were mainly enriched in response to external stimuli. This study not only lays the foundation for a comprehensive understanding of the function of the CaGH3 gene family during plant growth and stress responses but also provides potential genetic resources for pepper resistance breeding.
Keywords: Gretchen Hagen 3 gene family; auxin; expression pattern; pepper.
Conflict of interest statement
The authors declare no conflicts of interest.
Figures


Similar articles
-
Characterization and Expression Analysis of β-Glucosidase Gene Under Abiotic Stresses in Pepper (Capsicum annuum L.).Genes (Basel). 2025 Jul 27;16(8):889. doi: 10.3390/genes16080889. Genes (Basel). 2025. PMID: 40869937 Free PMC article.
-
Comparative Genomic Analysis of COMT Family Genes in Three Vitis Species Reveals Evolutionary Relationships and Functional Divergence.Plants (Basel). 2025 Jul 7;14(13):2079. doi: 10.3390/plants14132079. Plants (Basel). 2025. PMID: 40648090 Free PMC article.
-
Genome-Wide Identification of the DOG1 Gene Family in Pepper (Capsicum annuum) and Its Expression Profiles During Seed Germination.Plants (Basel). 2025 Jun 22;14(13):1913. doi: 10.3390/plants14131913. Plants (Basel). 2025. PMID: 40647924 Free PMC article.
-
Signs and symptoms to determine if a patient presenting in primary care or hospital outpatient settings has COVID-19.Cochrane Database Syst Rev. 2022 May 20;5(5):CD013665. doi: 10.1002/14651858.CD013665.pub3. Cochrane Database Syst Rev. 2022. PMID: 35593186 Free PMC article.
-
The Black Book of Psychotropic Dosing and Monitoring.Psychopharmacol Bull. 2024 Jul 8;54(3):8-59. Psychopharmacol Bull. 2024. PMID: 38993656 Free PMC article. Review.
References
Grants and funding
- SCHHZDSYS2024-14/Shanxi Key Laboratory of Germplasm Resources Innovation and Utilization of Vegetable and Flower
- 202202140601006/the Key Research and Development Program of Shanxi Province
- 2022BQ13/the PhD Start-up Fund of Shanxi Agricultural University
- 202203021212454/the Shanxi Provincial Basic Research Program - Free Exploration Category
- CYJSTX08/the Earmarked Fund for Shanxi Modern Agro-industry Technology Research System
LinkOut - more resources
Full Text Sources
Research Materials
