

Temporal Transcriptome Analysis Reveals Core Pathways and Orphan Gene EARLY FLOWERING 1 Regulating Floral Transition in Chinese Cabbage
- PMID: 40733473
- PMCID: PMC12300883
- DOI: 10.3390/plants14142236
Temporal Transcriptome Analysis Reveals Core Pathways and Orphan Gene EARLY FLOWERING 1 Regulating Floral Transition in Chinese Cabbage
Abstract
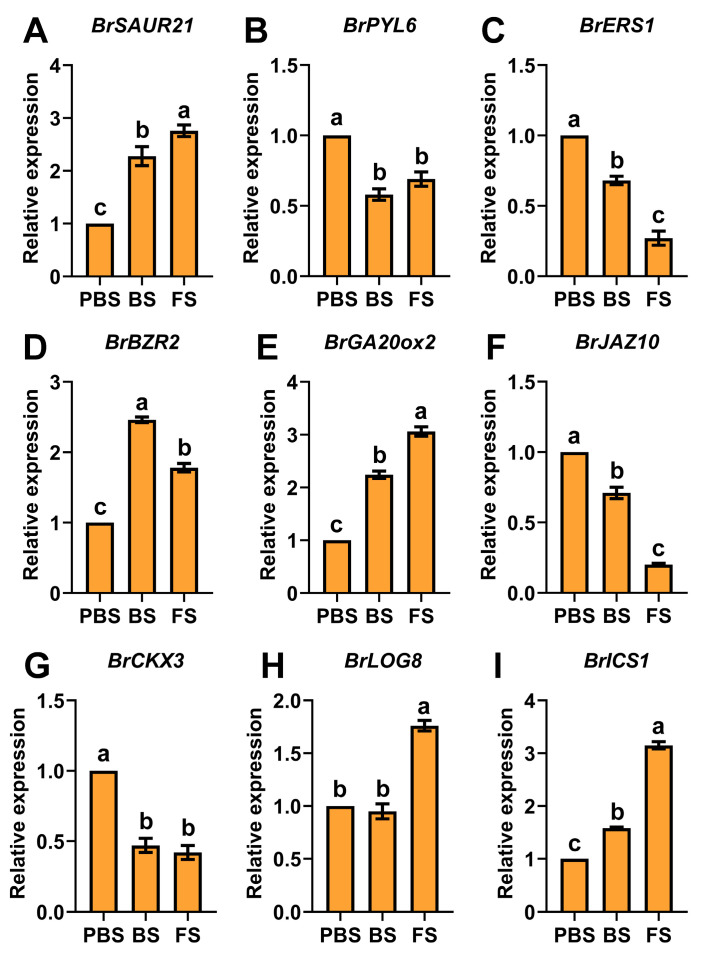
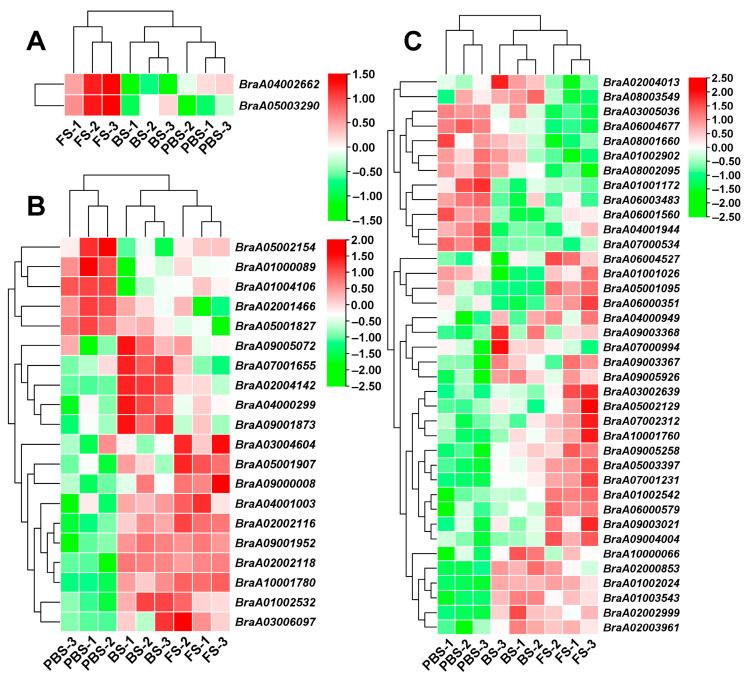
The floral transition in Chinese cabbage (Brassica rapa ssp. pekinensis) is governed by a complex interplay of gene expression and hormonal regulation. Temporal transcriptome profiling was conducted across three developmental stages: pre-bolting (PBS), bolting (BS), and flowering stages (FS), to investigate the underlying molecular mechanisms. A total of 7092 differentially expressed genes (DEGs) were identified, exhibiting distinct expression trajectories during the transition. Moreover, functional enrichment analyses revealed strong associations with plant hormone signaling, MAPK pathways, and developmental regulation processes. Key flowering-related genes, such as BrFLM, BrAP2, BrFD, BrFT, and BrSOC1s displayed antagonistic expression patterns. Hormonal pathways involving auxin, ABA, ET, BR, GA, JA, CK, and SA showed stage-dependent modulation. Further, orphan genes (OGs), especially EARLY FLOWERING 1 (EF1), showed significant upregulation during the transition, which exhibited 1.84-fold and 1.93-fold increases at BS and FS compared to PBS, respectively (p < 0.05). Functional validation through EF1 overexpression (EF1OE) in Arabidopsis consistently promoted early flowering. The expression levels of AtFT and AtSOC1 were significantly upregulated in EF1OE lines compared to wild-type (WT) plants. The findings contribute to understanding the coordinated genetic and hormonal events driving floral development in Chinese cabbage, suggesting EF1 as a candidate for bolting resistance breeding. This work also expands the existing regulatory framework through the successful integration of OGs into the complex floral induction system of Brassica crops.
Keywords: Chinese cabbage; EARLY FLOWERING 1; MAPK signaling; floral transition; hormone signaling; orphan genes; transcriptome profiling.
Conflict of interest statement
The authors declare that they have no known competing financial interests or personal relationships that could have appeared to influence the work reported in this paper.
Figures


Similar articles
-
Construction of an Overexpression Library for Chinese Cabbage Orphan Genes in Arabidopsis and Functional Analysis of BOLTING RESISTANCE 4-Mediated Flowering Delay.Plants (Basel). 2025 Jun 25;14(13):1947. doi: 10.3390/plants14131947. Plants (Basel). 2025. PMID: 40647955 Free PMC article.
-
Key genes BpMYB80 and BpMYB59 play important roles in regulating floral development in birch male flower mutants.Plant Physiol Biochem. 2025 Jun 19;227:110177. doi: 10.1016/j.plaphy.2025.110177. Online ahead of print. Plant Physiol Biochem. 2025. PMID: 40555040
-
Genome-wide identification of SWEET gene family and functional analysis of BcSWEET1-2 associated with flowering in flowering Chinese cabbage (Brassica campestris).BMC Genomics. 2025 Jul 1;26(1):605. doi: 10.1186/s12864-025-11808-2. BMC Genomics. 2025. PMID: 40597649 Free PMC article.
-
Gene co-expression network analysis reveals key pathways and hub genes in Chinese cabbage (Brassica rapa L.) during vernalization.BMC Genomics. 2021 Apr 6;22(1):236. doi: 10.1186/s12864-021-07510-8. BMC Genomics. 2021. PMID: 33823810 Free PMC article. Review.
-
Treatments for breast engorgement during lactation.Cochrane Database Syst Rev. 2016 Jun 28;2016(6):CD006946. doi: 10.1002/14651858.CD006946.pub3. Cochrane Database Syst Rev. 2016. Update in: Cochrane Database Syst Rev. 2020 Sep 18;9:CD006946. doi: 10.1002/14651858.CD006946.pub4. PMID: 27351423 Free PMC article. Updated.
References
-
- Gao X., Li Y., Dai Y., Li X., Huang C., Zhang S., Li F., Zhang H., Li G., Sun R., et al. Identification of the MADS-Box Gene Family and the Key Role of BrAGL27 in the Regulation of Flowering in Chinese Cabbage (Brassica rapa L. ssp. pekinensis) Int. J. Mol. Sci. 2025;26:2635. doi: 10.3390/ijms26062635. - DOI - PMC - PubMed
-
- Wang W., Qu G., Sun Y., Chen J., Feng H., Gao Y. Genome-wide identification of ADF gene family in Chinese cabbage (Brassica rapa L. ssp. pekinensis) and functional characterization of BrADF11 under heat stress. Plant Physiol. Biochem. 2025;223:109796. - PubMed
Grants and funding
LinkOut - more resources
Full Text Sources
Research Materials
