. 2025 Jul 20;14(14):2240.
doi: 10.3390/plants14142240.

Genome-Wide Analysis of GmMYB S20 Transcription Factors Reveals Their Critical Role in Soybean Nodulation

Affiliations

Genome-Wide Analysis of GmMYB S20 Transcription Factors Reveals Their Critical Role in Soybean Nodulation

Junchen Leng et al. Plants (Basel). .

Abstract

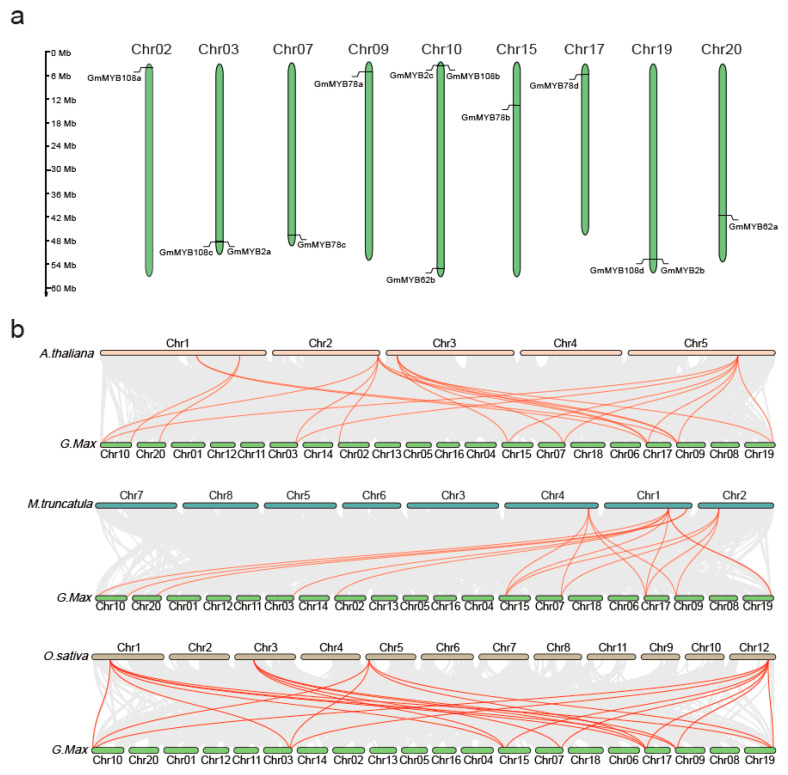
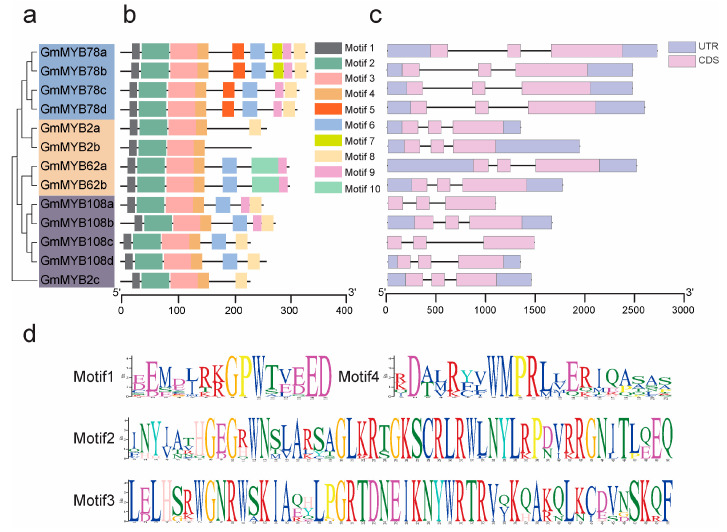
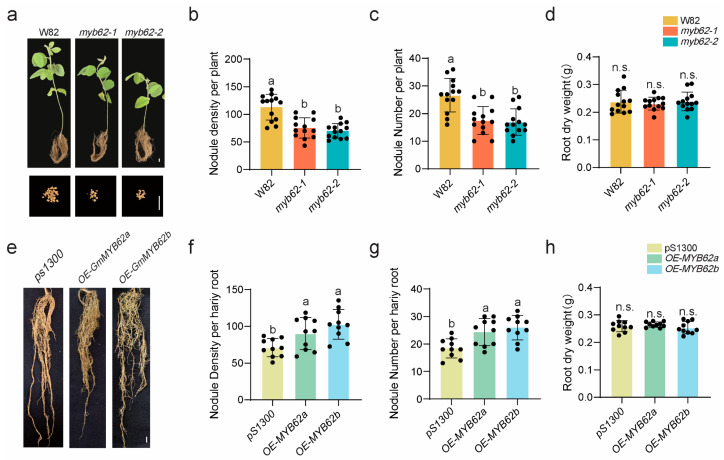
Soybean relies on symbiotic nitrogen fixation (SNF) to support sustainable agriculture. In this study, we conducted a comprehensive analysis of the GmMYB transcription factor subfamily 20, with a focus on GmMYB62a and GmMYB62b. Phylogenetic and structural analyses revealed that these genes are evolutionarily conserved among legumes and possess distinct domain architectures. Expression profiling and GUS staining showed that GmMYB62a and GmMYB62b are constitutively expressed in nodules. Functional analyses revealed that loss of GmMYB62s function significantly reduced nodule density, while overexpression promoted nodulation. Transcriptomic analysis (RNA-seq) further demonstrated that GmMYB62s regulate key pathways, including hormone signaling, immune responses, and cell wall metabolism, thereby coordinating symbiotic interactions. Collectively, our findings identify GmMYB62a and GmMYB62b as critical molecular regulators of nodulation in soybean, providing promising targets for improving symbiotic nitrogen fixation efficiency in legume crops.

Keywords: GmMYB62a and GmMYB62b; nodulation; soybean; transcription factor.


Conflict of interest statement

The authors declare no conflicts of interest.

Figures

Figure 1
Figure 1
Phylogenetic analysis of MYB-S20 proteins from Glycine max, Arabidopsis thaliana, Medicago truncatula, and Oryza sativa. Based on sequences, a neighbor-joining tree constructed using MEGA11 software reveals the evolutionary relationships of S20 members in soybean, Arabidopsis, alfalfa, and rice. Soybean genes are denoted by circles, Arabidopsis genes by squares, Medicago genes by triangles, and rice genes by stars. Color-shaded areas demarcate the three S20 subgroups: Subgroup-I, Subgroup-II, and Subgroup-III. Accession number amino acid sequences for all S20 proteins are detailed in Supplementary Table S1. Bootstrap values = 1000.
Figure 2
Figure 2
Chromosomal localization of soybean GmMYB S20 genes and collinearity analysis among species. (a) Chromosomal distribution of soybean GmMYB S20 genes. The diagram was generated using the MapGene2 Chrom web v2 tool, with 13 genes distributed across nine chromosomes. The vertical bars represent soybean chromosomes, and the scale on the left indicates chromosome length. (b) Collinearity analysis of MYB S20 among G. max, A. thaliana, O. sativa, and M. truncatula. Gray background lines indicate collinear blocks between soybean and other plant genomes, while red lines highlight syntenic MYB S20 gene pairs.
Figure 3
Figure 3
Phylogenetic tree, gene structure, and conserved motifs of GmMYB S20 proteins. (a) Phylogenetic tree of GmMYB S20 proteins constructed using the neighbor-joining method. (b) Distribution of conserved motifs in GmMYB S20 proteins. Distinct colors represent different motif types. Detailed information on the GmMYB S20 motifs are provided in Supplementary Table S3. (c) Gene structure composition of GmMYB S20 genes, including exons, introns, and untranslated regions (UTRs). Light purple boxes: UTRs; light blue boxes: exons; black lines: introns. The gene structure information of GmMYB S20 is provided in Supplementary Table S4 (d). Sequence logos of conserved residues. Conserved motifs in GmMYB S20 amino acid sequences predicted by the MEME Suite. The letter size in motifs 1–4 indicates conservation level at each position.
Figure 4
Figure 4
Analysis of cis-acting elements in the promoter regions of GmMYB S20 genes. (a) Distribution map of predicted cis-acting elements in GmMYB S20 promoter regions. (b) Functional classification and quantitative analysis of cis-acting elements. Elements are categorized into three functional groups: stress response, hormone response, and growth/development. A grid heatmap with color bars indicates the quantitative distribution of elements.
Figure 5
Figure 5
Predicted three-dimensional protein structure of the R2R3-conserved motif in GmMYB S20 protein. (a) Predicted three-dimensional structure of the GmMYB62a protein by AlphaFold. The N-terminus indicates the start of the protein synthesis sequence, and the C-terminal indicates the end of the protein synthesis sequence. Blue represents the R2 motif, magenta represents the R3 motif, and green represents the remaining structure. The labels 1, 2, and 3 denote the three alpha-helices within both the R2 and R3 motifs, respectively. (b) R2R3 motif of GmMYB62a. The R2R3 motif from (a) is magnified, excluding the non-conserved regions (green structure) for closer observation. (c,d) Conservation analysis of the R2R3 motif sequences across the GmMYB S20 protein. The red dashed boxes highlight the critical regions of the conserved motifs.
Figure 6
Figure 6
Expression patterns of GmMYB S20 genes in different tissues. (a) Expression levels of GmMYB S20 genes were determined in the following samples Root, Root-USDA110 (Bradyrhizobium japonicum USDA110), Nodule. Differentially expressed genes were identified using thresholds of p < 0.05 and |log2FC| ≥ 2. Detailed data are provided in Supplementary Table S6. (b) Histochemical staining of transgenic roots and nodules expressing proGmMYB62a: GUS and proGmMYB62b: GUS detected GUS activity in untreated roots, inoculated roots, and nodules at 21 days post inoculation (21 dpi). Scale bar: 100 μm.
Figure 7
Figure 7
GmMYB62s positively regulate nodulation. (a) Nodulation phenotypes of wild-type Williams 82 (W82), myb62-1 and myb62-2 at 28 dpi. Scale bar = 1 cm. (b) Nodule number per plant and nodule dry weight of wild-type W82, myb62-1 and myb62-2 at 28 dpi. Error bars represent mean ± SE, n = 13. Different letters indicate statistically significant differences (p < 0.05) based on one-way ANOVA followed by Tukey’s multiple comparison test. (c) Nodule number per plant of wild-type W82, myb62-1, and myb62-2 after 28 dpi. Error bars represent mean ± SE, n = 13. Different letters indicate statistically significant differences (p < 0.05) based on one-way ANOVA followed by Tukey’s multiple comparison test. n = 13. (d) Root dry weight per plant (g) of wild-type W82, myb62-1 and myb62-2. Error bars represent mean ± SE, n = 13. “n.s.” indicates no significant difference. (e) Nodulation phenotypes of empty vector control (pS1300), OE-GmMYB62a, and OE-GmMYB62b transgenic hairy roots at 28 dpi. Scale bar = 1 cm. (f) Nodule density per hair root of empty vector control (pS1300), OE-GmMYB62a, and OE-GmMYB62b at 28 dpi. Different letters indicate statistically significant differences (p < 0.05) based on one-way ANOVA followed by Tukey’s multiple comparison test. (g) Nodule number per plant of empty vector control (pS1300), OE-GmMYB62a, and OE-GmMYB62b at 28 dpi. Error bars represent mean ± SE, n = 10. Different letters indicate statistically significant differences (p < 0.05) based on one-way ANOVA followed by Tukey’s multiple comparison test. (h) Root dry weight per hair root (g) of empty vector control (pS1300), OE-GmMYB62a, and OE-GmMYB62b transgenic hairy roots at 28 dpi. Error bars represent mean ± SE, n = 10. “n.s.” indicates no significant difference.
Figure 8
Figure 8
RNA-Seq analysis of W82 and myb62-1, and RT-qPCR validation of related gene expression. (a) Volcano plot of differentially expressed genes (DEGs) in myb62-1 vs. W82 roots under B. japonicum USDA110 inoculation 7dpi. Red: 399 significantly upregulated genes; blue: 394 significantly downregulated genes. (b) Significantly enriched Go terms for DEGs identified in W82 vs. myb62-1 under B. japonicum USDA110 inoculation. The vertical axis displays Go term names, while the horizontal axis represents the Rich Factor, a higher value indicates greater enrichment significance. The size of the data points corresponds to the number of genes associated with the term, and the color corresponds to the range of adjusted p-values (p-adjust). (ch) Expression of selected genes was assessed by RT-qPCR in root samples collected 7 days post-inoculation (dpi) with rhizobia from wild-type W82 and myb62-1. (c,d) Validation of RNA-Seq-upregulated genes: TIR-NB-LRR (Glyma.13G194900) and G-type leucine-rich repeat (G-type LRR, Glyma.13G188800). (e,f) Validation of RNA-Seq-downregulated genes: Proprotein Convertase Subtilisin/Kexin (PCSK) and leucine-rich repeat protein (LRR protein). (g,h) Expression of symbiosis marker genes Nodule inception 2 (NIN2, Glyma.02G311000) and Early Nodulin 11 (ENOD11, Glyma.09G092700). GmActin was used as the reference gene for normalization. Data represent means ± SD from four biological replicates. Different letters indicate statistically significant differences (p < 0.05) determined by one-way ANOVA with multiple comparisons.

Similar articles

References

    1. Li J.H., Wang E.T., Chen W.F., Chen W.X. Genetic diversity and potential for promotion of plant growth detected in nodule endophytic bacteria of soybean grown in Heilongjiang province of China. Soil Biol. Biochem. 2008;40:238–246. doi: 10.1016/j.soilbio.2007.08.014. - DOI
    1. Roy S., Liu W., Nandety R.S., Crook A., Mysore K.S., Pislariu C.I., Frugoli J., Dickstein R., Udvardi M.K. Celebrating 20 Years of Genetic Discoveries in Legume Nodulation and Symbiotic Nitrogen Fixation. Plant Cell. 2020;32:15–41. doi: 10.1105/tpc.19.00279. - DOI - PMC - PubMed
    1. Foyer C.H., Lam H.-M., Nguyen H.T., Siddique K.H.M., Varshney R.K., Colmer T.D., Cowling W., Bramley H., Mori T.A., Hodgson J.M., et al. Neglecting legumes has compromised human health and sustainable food production. Nat. Plants. 2016;2:16112. doi: 10.1038/nplants.2016.112. - DOI - PubMed
    1. Cernay C., Ben-Ari T., Pelzer E., Meynard J.-M., Makowski D. Estimating variability in grain legume yields across Europe and the Americas. Sci. Rep. 2015;5:11171. doi: 10.1038/srep11171. - DOI - PMC - PubMed
    1. Wang Y., Wang L., Zou Y., Chen L., Cai Z., Zhang S., Zhao F., Tian Y., Jiang Q., Ferguson B.J., et al. Soybean miR172c Targets the Repressive AP2 Transcription Factor NNC1 to Activate ENOD40 Expression and Regulate Nodule Initiation. Plant Cell. 2014;26:4782–4801. doi: 10.1105/tpc.114.131607. - DOI - PMC - PubMed

LinkOut - more resources