. 2025 Jul 2;17(7):940.
doi: 10.3390/v17070940.

Interactions Between Hantavirus Nucleoprotein and Glycoproteins: A Quantitative Fluorescence Microscopy Study

Affiliations

Interactions Between Hantavirus Nucleoprotein and Glycoproteins: A Quantitative Fluorescence Microscopy Study

Amit Koikkarah Aji et al. Viruses. .

Abstract

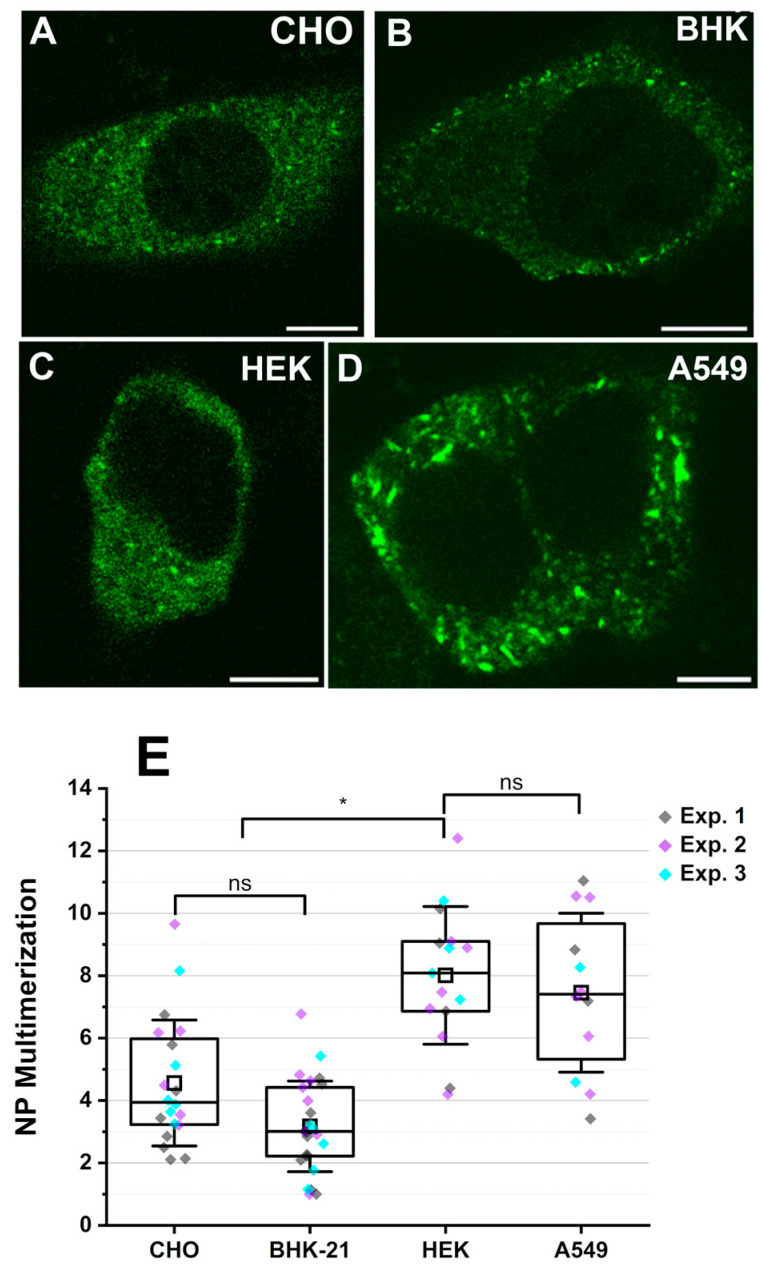
Orthohantaviruses are tri-segmented negative-sense RNA viruses that can cause severe pathologies in humans. Currently, limited information exists on the molecular interactions driving orthohantavirus assembly in infected cells. Specifically, it is not clear how its glycoproteins (i.e., Gn and Gc) interact with other viral or host molecules. In this study, we use one- and two-color Number and Brightness fluorescence microscopy approaches to quantitatively characterize the interactions between orthohantavirus glycoproteins and the nucleoprotein in transfected cells. Our results indicate that orthohantavirus nucleoprotein homo-interactions are strongly affected by the host environment. Furthermore, we report evidence of Gc-nucleoprotein interactions, based on (i) the high fluorescence cross-correlation between these two proteins and (ii) the increased Gc-Gc interactions observed in the presence of nucleoprotein. Finally, experiments on a Gc deletion mutant suggest that the observed protein-protein interactions are mediated by the cytoplasmic tail of Gc. In conclusion, this study provides new insights into the role of the interactions between orthohantavirus glycoproteins and nucleoprotein in the context of viral assembly.

Keywords: fluorescence fluctuations; fluorescence microscopy; fluorescent proteins; multimerization; protein–protein interactions; virus assembly.


Conflict of interest statement

The authors declare no conflicts of interest.

Figures

Figure 1
Figure 1
Hantavirus structure and structural proteins. The glycoproteins Gn and Gc are embedded in the lipid bilayer (light blue) and form hetero-complexes. Nucleoproteins bound to the viral RNA might interact with the cytoplasmic tails (green lines) of glycoproteins. The three RNA segments S, M, and L are labelled accordingly. Adapted from Hepojoki et al. [2].
Figure 2
Figure 2
Average multimerization of fluorescently labelled PUUV NP is higher in human cell models compared to rodent epithelial cell models. YFP-NP was expressed in multiple epithelial cell models and observed 16 to 20 hpt. Panels (AD) show representative confocal microscopy images of (A) CHO, (B) BHK-21, (C) HEK 293T, and (D) A549 cells expressing YFP-NP. Panel (E) shows a quantitative comparison of YFP-NP multimerization between different cell models. For this analysis, cells expressing YFP-NP within the concentration range 0.1–0.5 µM were chosen. Data points for NP multimerization in CHO cells are from Welke et al. [11] and incorporated as reference values. Each point in the boxplot represents the average multimerization in one cell. At least 12 cells were analyzed for each case, with three technical replicates denoted in different colors (see Supplementary Information for quantitative details). In all box plots, the horizontal line is the median, ‘□’ marks the mean, with the first and third quartile as the boundaries and whiskers as standard deviation (SD). Statistical analysis was performed using the pairwise Kruskal–Wallis one-way ANOVA test (ns: not significant, * p < 0.01). Scale bars are 10 µm.
Figure 3
Figure 3
Single-cell analysis and spatial maps of the interactions between NP and GPs. Panels (AC) show representative images of CHO cells co-expressing PUUV YFP-NP and PUUV mCh2-Gc, 20 to 24 hpt. Panel (D) shows the pixel-by-pixel relative CC map of the same CHO cell, within a ROI as indicated by a white line in panels (AC). Red arrows in panel (D) denote localized regions characterized by high relative CC values. Panel (E) shows the pixel-by-pixel relative CC map of the same CHO cell, within a ROI as indicated by a white line in panels (FH). Panels (FH) show representative images of CHO cells co-expressing PUUV YFP-NP and PUUV mCh2-Gn, 20 to 24 hpt. Panel (I) shows a box plot of the relative CC values averaged over whole-cell ROIs and measured for different constructs expressed in CHO cells. Positive control is a tandem YFP-mCh2 construct that localizes in the cytoplasm. The negative control refers to cells co-expressing YFP-NP and cytosolic mCherry2. ROIs in cells with intensity values less than 1 MHz in the YFP and mCherry2 channel were chosen for evaluating the average relative CC within each cell. Each point in panel (I) represents the average relative CC value from one ROI in one cell. Number of points for each case >15, from three independent experiments denoted in individual colors (see Supplementary Information for quantitative details). In all box plots, the horizontal line is the median, ‘□’ marks the mean, with first and third quartile as the boundaries and whiskers as SD. Scale bars are 5 µm.
Figure 4
Figure 4
PUUV Gc (but not Gn) multimerization behavior is altered in the presence of NP. Panel (A) shows the concentration-dependent multimerization analysis of PUUV Gc in the presence of PUUV NP using N&B, in different epithelial cell models: CHO (red), A549 (green), and HEK 293T (dark green). PUUV Gc multimerization in the presence of PUUV NP is compared to that measured in the absence of NP in CHO cells (black, data from [4]). Each point in the graph represents the binned average multimerization values from two cells. The solid lines represent a fit to an empirical power growth model [31] in the form of y = 1 + a∙xk. Fit results and statistical analysis are shown in Table S2. Panel (B) shows the concentration-dependent multimerization analysis of PUUV Gn in the presence of PUUV NP using N&B, in the same epithelial cell models as for panel A. PUUV Gn multimerization in the presence of PUUV NP is compared to that measured in the absence of NP in CHO cells (black, data from [4]). Each point in the graph represents the binned average multimerization values from two cells. The solid lines represent a fit to a monomer–tetramer equilibrium model [32]. Fit results and statistical analysis are shown in Table S3.
Figure 5
Figure 5
Deletion of Gc∆CT inhibits the formation of large Gc assemblies in the presence of NP. Panel (A) shows a representative image of CHO cells expressing PUUV mEGFP-Gc∆CT and observed 24 hpt. Panels (BD) show typical confocal image of CHO cells co-expressing YFP-NP and mCh2-Gc∆CT. Panel (E) shows the concentration-dependent multimerization analysis of PUUV Gc∆CT in the absence (black) and presence (red) of PUUV NP, calculated using N&B analysis. Each point in the graph represents the binned average multimerization from two cells. The solid lines represent a fit to a monomer–dimer equilibrium model [32]. Fit results and statistical analysis are shown in Table S4. Scale bars are 10 µm.

Similar articles

References

    1. Kim W.K., Cho S., Lee S.H., No J.S., Lee G.Y., Park K., Lee D., Jeong S.T., Song J.W. Genomic Epidemiology and Active Surveillance to Investigate Outbreaks of Hantaviruses. Front. Cell Infect. Microbiol. 2020;10:532388. doi: 10.3389/fcimb.2020.532388. - DOI - PMC - PubMed
    1. Hepojoki J., Strandin T., Lankinen H., Vaheri A. Hantavirus structure--molecular interactions behind the scene. J. Gen. Virol. 2012;93:1631–1644. doi: 10.1099/vir.0.042218-0. - DOI - PubMed
    1. Bignon E.A., Albornoz A., Guardado-Calvo P., Rey F.A., Tischler N.D. Molecular organization and dynamics of the fusion protein Gc at the hantavirus surface. Elife. 2019;8:e46028. doi: 10.7554/eLife.46028. - DOI - PMC - PubMed
    1. Petazzi R.A., Koikkarah A.A., Tischler N.D., Chiantia S. Detection of Envelope Glycoprotein Assembly from Old-World Hantaviruses in the Golgi Apparatus of Living Cells. J. Virol. 2021;95:10–1128. doi: 10.1128/JVI.01238-20. - DOI - PMC - PubMed
    1. Olal D., Daumke O. Structure of the Hantavirus Nucleoprotein Provides Insights into the Mechanism of RNA Encapsidation. Cell Rep. 2016;14:2092–2099. doi: 10.1016/j.celrep.2016.02.005. - DOI - PubMed

Publication types

LinkOut - more resources