. 2025 Jul 9;17(7):963.
doi: 10.3390/v17070963.

Spatiotemporal Characterization of Changes in the Respiratory Tract and the Nervous System, Including the Eyes in SARS-CoV-2-Infected K18-hACE2 Mice

Affiliations

Spatiotemporal Characterization of Changes in the Respiratory Tract and the Nervous System, Including the Eyes in SARS-CoV-2-Infected K18-hACE2 Mice

Malgorzata Rosiak et al. Viruses. .

Abstract

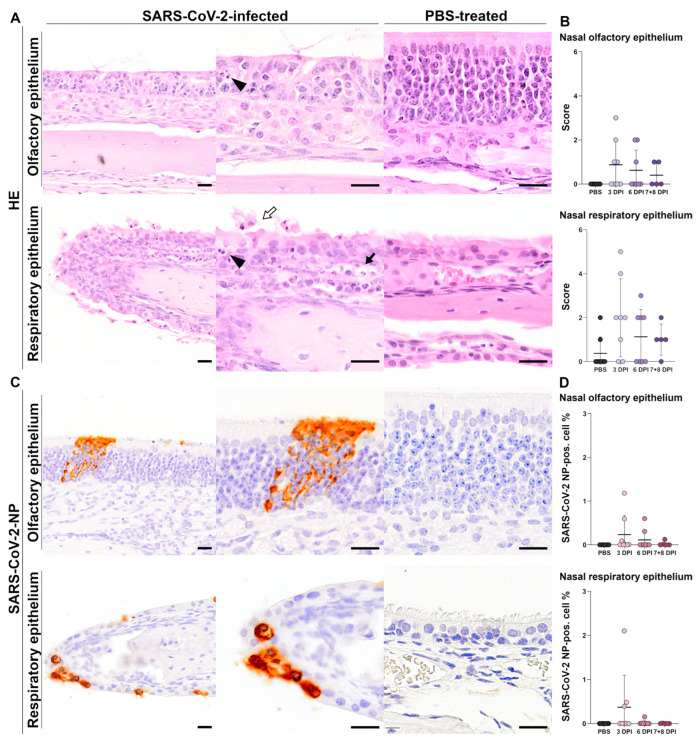
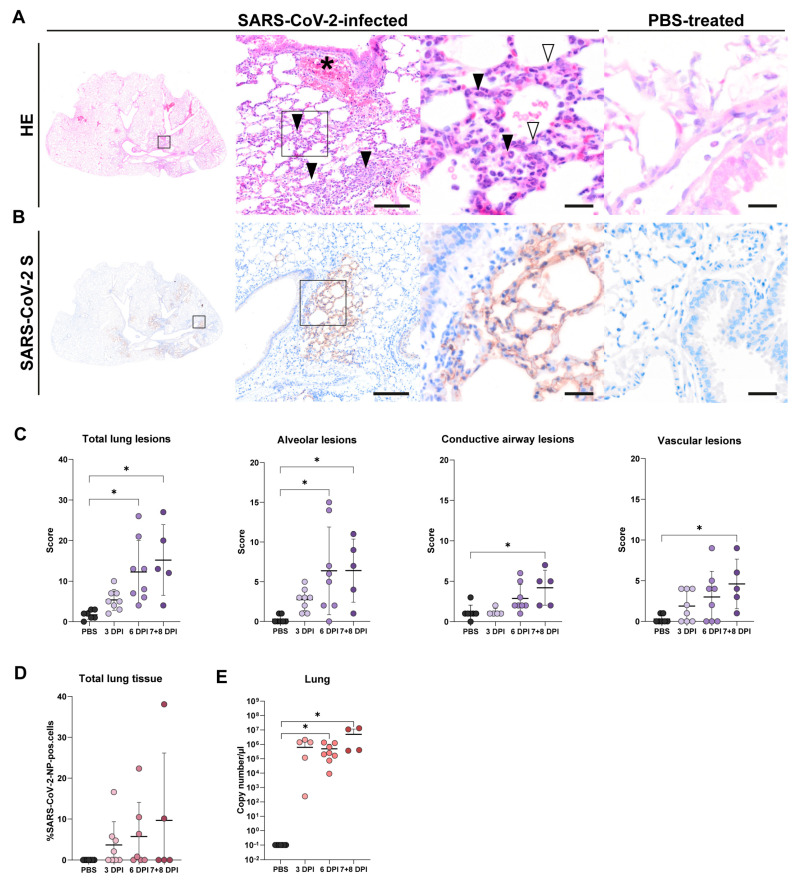
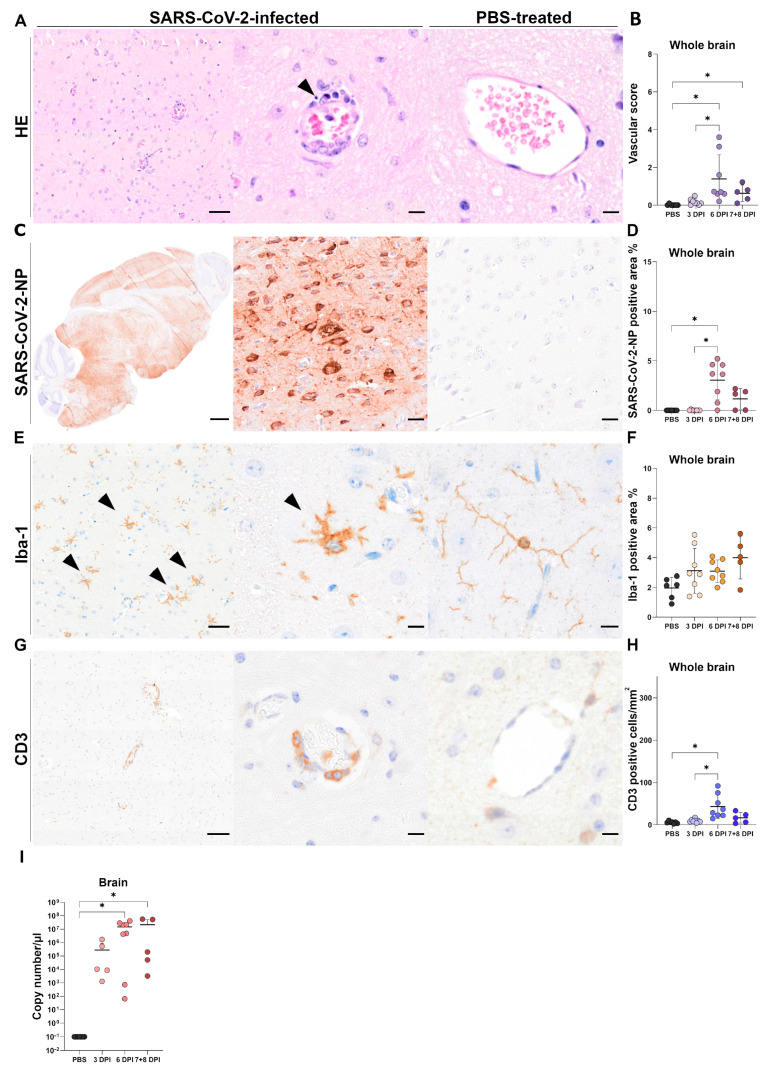
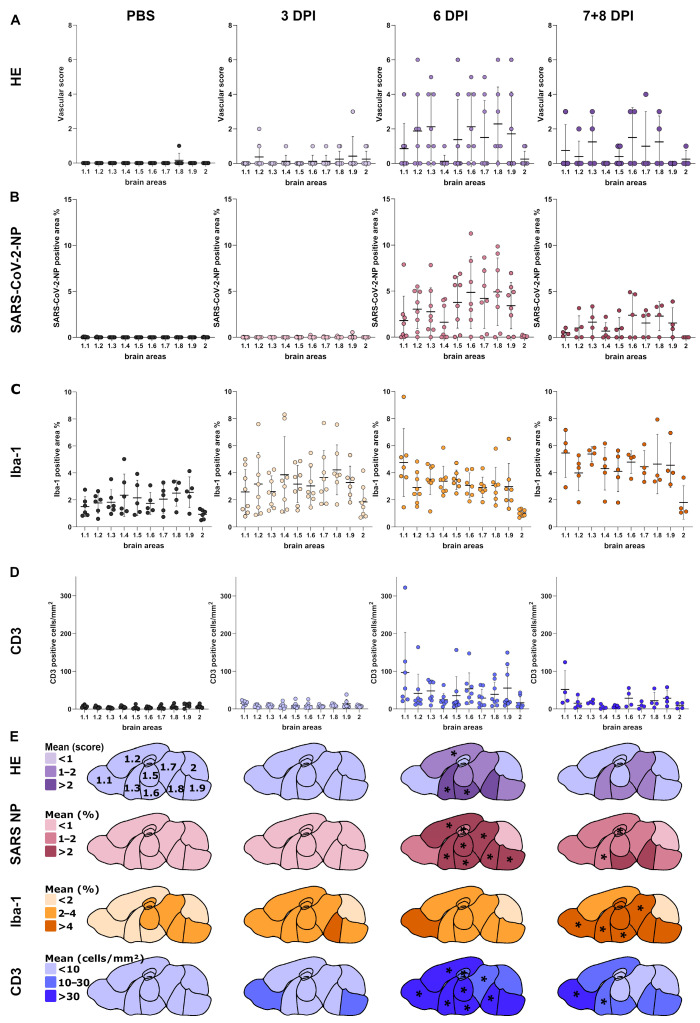
Severe acute respiratory syndrome coronavirus 2 (SARS-CoV-2), the causative agent of coronavirus disease 2019 (COVID-19), is known to affect multiple organ systems, including the respiratory tract and nervous and ocular systems. This retrospective study aimed to characterize the spatiotemporal distribution of viral antigen and associated pathological changes in the nose, lungs, brain, and eyes of K18-hACE2 mice intranasally infected with SARS-CoV-2. Using histology and immunohistochemistry, tissues were examined at 3, 6, and 7/8 days post-infection (dpi). In addition, lung and brain tissues were analyzed by means of RT-qPCR to determine viral RNA titers. Viral antigen was most pronounced in the nose, brain, and lung at 3, 6, and 7/8 dpi, respectively, whereas viral antigen was detected at 6 and 7/8 dpi in the retina. Quantitative PCR confirmed increasing viral RNA levels in both lung and brain, peaking at 7/8 dpi. Nasal and lung inflammation mirrored viral antigen distribution and localization. In the brain, the predominantly basal viral spread correlated with lymphohistiocytic meningoencephalitis, neuronal vacuolation, and altered neurofilament immunoreactivity. Retinal ganglion cells showed viral antigen expression without associated lesions. Microglial activation was evident in both the optic chiasm and the brain. These findings highlight the K18-hACE2 model's utility for studying extrapulmonary SARS-CoV-2 pathogenesis. Understanding the temporal and spatial dynamics of viral spread enhances insights into SARS-CoV-2 neurotropism and its clinical manifestations.

Keywords: BavPat1; CNS; COVID-19; K18-hACE2 mice; SARS-CoV-2; central nervous system; neuropathology; ocular manifestation; severe acute respiratory syndrome coronavirus 2; spatiotemporal distribution; upper and lower respiratory tract.


Conflict of interest statement

The authors declare no conflicts of interest.

Figures

Figure 1
Figure 1
Schematic of the brain areas evaluated. The figure was adapted from the Allen Mouse Brain Atlas, mouse.brain-map.org, and atlas.brain-map.org [49]. 1.1, olfactory areas; 1.2, isocortex; 1.3, cerebral nuclei; 1.4, hippocampus; 1.5, thalamus; 1.6, hypothalamus; 1.7, midbrain; 1.8, pons; 1.9, medulla; 2, cerebellum. Nissl stain.
Figure 2
Figure 2
SARS-CoV-2-infected K18-hACE2 mice show mild inflammatory lesions with low amounts of epithelial SARS-CoV-2 nucleoprotein (SARS-CoV-2-NP) antigen in the nasal cavity. (A) Representative nasal sections of olfactory epithelium (OE) and respiratory epithelium (RE), stained with hematoxylin and eosin (HE), of SARS-CoV-2-infected animal (left, low and high magnification) and mock-infected animal (right, high magnification). OE of SARS-CoV-2-infected animal 3 days post-infection (dpi) with mild loss of epithelial architecture, fine strands of intraluminal mucus, occasional intraepithelial and nuclear fragmentation with karyopyknosis and -rrhexis (arrowhead). RE of SARS-CoV-2-infected animal 3 dpi with mild single-cell death characterized by karyopyknosis and -rrhexis (arrowhead), desquamation of ciliated cells (white arrow), and mild sub- and intraepithelial infiltration (exocytosis) of neutrophils (black arrow) compared to intact RE in a mock-infected control animal. (B) Semiquantitative scoring of histopathological nose lesions in the OE and RE of SARS-CoV-2- and mock-infected animals. (C) Representative nasal sections of OE and RE immunolabeled for SARS-CoV-2-NP of SARS-CoV-2-infected animal (left, low and high magnification) and mock-infected animal (right, high magnification). OE of SARS-CoV-2-infected animal 7/8 dpi presents low numbers of positive epithelial cells with cytoplasmic immunolabeling. SARS-CoV-2-NP was not detected in the OE of mock-infected control animals. RE of SARS-CoV-2-infected animal at 3 dpi presents low numbers of positive epithelial cells with cytoplasmic immunolabeling. SARS-CoV-2-NP was not detected in the RE of mock-infected control animals. (D) Quantification of SARS-CoV-2-NP immunolabeling in the total OE and RE of SARS-CoV-2 and mock-infected animals. Bars: 20 µm. The graphs show mean (solid line), individual values (dots), and standard deviation (vertical bars). Data were tested using the Kruskal–Wallis test followed by Dunn–Bonferroni post hoc testing.
Figure 3
Figure 3
Progressing pneumonia and SARS-CoV-2 nucleoprotein (SARS-CoV-2-NP) antigen expression in lungs of K18-hACE2 mice during the initial 8 days of infection with SARS-CoV-2. (A) Representative images of lung lesions in infected animals compared to PBS-treated control tissue. Hematoxylin and eosin (HE) stained overview and higher magnification images show multifocal areas of septal and interalveolar immune cell infiltration (black arrowheads) as well as perivascular hemorrhage (asterisk). Higher magnification reveals multifocal single-cell necrosis within alveolar septae (white arrowheads, SARS-CoV-2-infected animal at 6 dpi). (B) Representative images of pulmonary SARS-CoV-2-NP in infected animals compared to PBS-treated controls. SARS-CoV-2-NP antigen was expressed multifocally throughout the alveolar tissue (brown signal). High magnification image shows SARS-CoV-2 S antigen expression in type I and II pneumocytes at 6 days post-infection (dpi). Rectangles indicate magnified areas in subsequent images. Bars = 100 and 20 µm, respectively. (C) Semiquantitative scoring of histopathological lung lesions. (D) Quantitative analysis of SARS-CoV-2-S immunolabeling in the total lung tissue of infected mice compared to mock-infected mice. (E) RT-qPCR targeting RNA-dependent RNA polymerase (RDRP) of SARS-CoV-2 in lung tissue of SARS-CoV-2-infected mice compared to mock-infected mice. The graphs show mean (solid line), individual values (dots), and standard deviation (vertical bars). Data were tested using the Kruskal–Wallis test followed by Dunn–Bonferroni post hoc testing. Statistical significance was accepted at a p-value of ≤0.05 (*).
Figure 4
Figure 4
SARS-CoV-2-infected K18-hACE2 mice show lymphohistiocytic meningoencephalitis with microgliosis and diffuse intraneuronal SARS-CoV-2 nucleoprotein (SARS-CoV-2-NP) antigen. (A) Representative images of the thalamus stained with hematoxylin and eosin (HE) showing predominantly perivascular mononuclear infiltration with the presence of pyknotic nucleus (arrowhead) in infected animal 6 days post-infection (dpi; left, low and high magnification), and lack of inflammatory infiltrates in the mock-infected animal (right, high magnification). (B) Semiquantitative scoring of histopathological lesions in whole brains (cerebrum and cerebellum), with peak of inflammatory changes occurring in the infected animals at 6 dpi. Histological lesions, although less pronounced, were also present at 7/8 dpi. (C) Representative brain sections immunolabeled for SARS-CoV-2-NP with diffuse, neuronal viral antigen spread throughout the cerebrum and brain stem, but not cerebellum, in the infected animal at 6 dpi (left, low and high magnification), and no positive staining in the thalamus of the mock-infected animal (right, high magnification). (D) Quantification of SARS-CoV-2-NP-positive area (%) in the whole brain (cerebrum and cerebellum). (E) Representative thalamus sections immunolabeled for Iba-1 presenting hypertrophied microglial morphology characterized by shortened, thickened processes in the infected animal at 6 dpi (left, low and high magnification) in contrast to ramified microglia with long, thin processes in the mock-infected animal (right, high magnification). (F) Quantification of Iba-1-positive area (%). (G) Representative thalamus section immunolabeled for CD3, demonstrating the presence of numerous T cells in the perivascular infiltrates in the infected animal at 6 dpi (left, low and high magnification), and absence of perivascular T cell infiltrates in the mock-infected animal (right, high magnification). (H) Quantification of CD3-positive cells in the whole brain. (I) RT-qPCR targeting RNA-dependent RNA polymerase (RDRP) of SARS-CoV-2 in brain tissue of SARS-CoV-2-infected mice compared to mock-infected mice. Bars: overview = 1 mm; low magnification = 50 µm; high magnification = 10 µm. The graphs show mean (solid line), individual values (dots), and standard deviation (vertical bars). Data were tested using the Kruskal–Wallis test followed by Dunn–Bonferroni post hoc testing. Statistical significance was accepted at a p-value of ≤0.05 (*).
Figure 5
Figure 5
Histological lesions, viral antigen, and T cell infiltration in SARS-CoV-2-infected K18-hACE2 mice were most prominent at 6 dpi, while the highest Iba-1 immunoreactivity was observed at 7/8 dpi. (AD) Quantification of histopathology on hematoxylin and eosin-stained brains (A), semiquantitative score), SARS-CoV-2-NP-positive area (B), Iba-1-positive area (C), and CD3-positive T cells (D), in separate brain regions (see also Figure 1). (E) Schematic representation of quantitative data. The color scheme is used to visualize quantitative differences. Asterisks indicate significant differences between infected animals sacrificed at 3, 6, or 7/8 dpi and mock-infected controls in the respective brain region. Data were tested using the Kruskal–Wallis test followed by Dunn–Bonferroni post hoc testing. Statistical significance was accepted at a p-value of ≤0.05 (*). The graphs show mean (solid line), individual values (dots), and standard deviation (vertical bars).
Figure 6
Figure 6
Axonal damage in SARS-CoV-2-infected K18-hACE2 mice. Multifocal round to oval accumulations of non-phosphorylated neurofilament (nNF; arrowheads) were observed in the cerebellar white matter of SARS-CoV-2-infected K18-hACE2 mice at 6 dpi (left, low and high magnification), but not in the control animals (right, high magnification). Bar = 50 µm.
Figure 7
Figure 7
Retinal infection in SARS-CoV-2-infected K18-hACE2 mice. SARS-CoV-2-NP immunohistochemistry of retinas from infected K18-hACE2 mice reveals the presence of multiple neurons with intracytoplasmic SARS-CoV-2-NP antigen (arrowheads) at 6 dpi (left, low and high magnification), but not in the control animals (right, high magnification). Bar = 50 µm.

Similar articles

References

    1. Gupta A., Madhavan M.V., Sehgal K., Nair N., Mahajan S., Sehrawat T.S., Bikdeli B., Ahluwalia N., Ausiello J.C., Wan E.Y., et al. Extrapulmonary manifestations of COVID-19. Nat. Med. 2020;26:1017–1032. doi: 10.1038/s41591-020-0968-3. - DOI - PMC - PubMed
    1. Champion S.N., Williams I.M., Martinez Lage M., Stagner A.M. Pathology of the brain and the eye in Severe Acute Respiratory Syndrome Coronavirus-2-infected patients: A review. J. Neuroopthalmol. 2021;41:285–292. doi: 10.1097/WNO.0000000000001275. - DOI - PubMed
    1. Nasiri N., Sharifi H., Bazrafshan A., Noori A., Karamouzian M., Sharifi A. Ocular manifestations of COVID-19: A systematic review and meta-analysis. J. Ophthalmic Vis. Res. 2021;16:103–112. doi: 10.18502/jovr.v16i1.8256. - DOI - PMC - PubMed
    1. Vashishtha V.M., Kumar P. Preliminary clinical characteristics of pediatric COVID-19 cases during the ongoing Omicron XBB.1.16 driven surge in a north Indian city. medRxiv. 2023:2023.2004.2018.23288715. doi: 10.1101/2023.04.18.23288715. - DOI
    1. Dai J., He F., Chen Q., Li Q., Zhao L., Du Y. Animal models of post-acute COVID-19 syndrome: A call for longitudinal animal studies. Front. Immunol. 2025;16:1521029. doi: 10.3389/fimmu.2025.1521029. - DOI - PMC - PubMed

MeSH terms

LinkOut - more resources