. 2025 Jul 13;17(7):978.
doi: 10.3390/v17070978.

Characterization of Gene Expression Suppression by Bovine Coronavirus Non-Structural Protein 1

Affiliations

Characterization of Gene Expression Suppression by Bovine Coronavirus Non-Structural Protein 1

Takehiro Ohkami et al. Viruses. .

Abstract

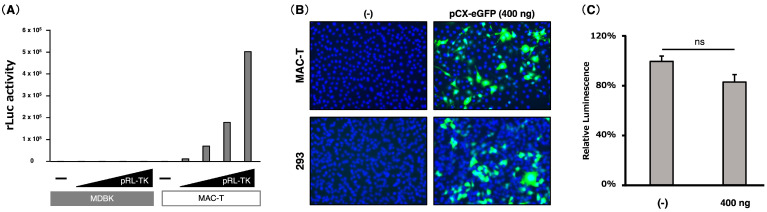
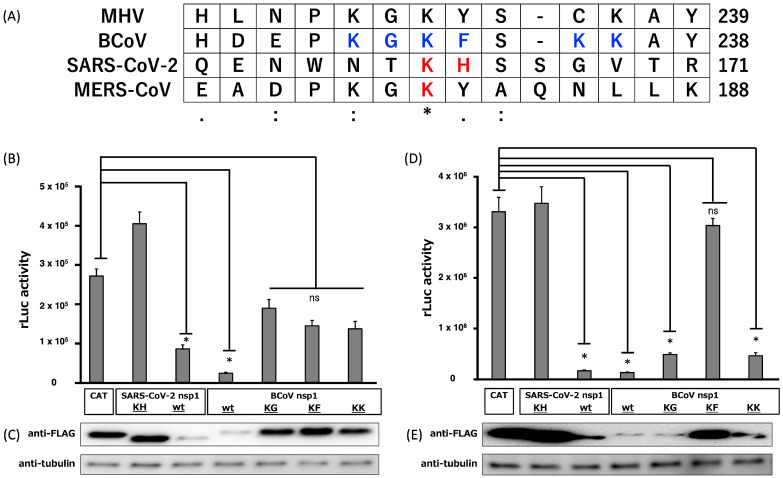
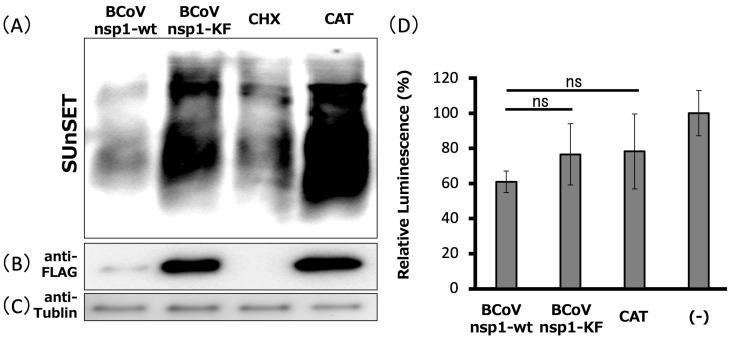
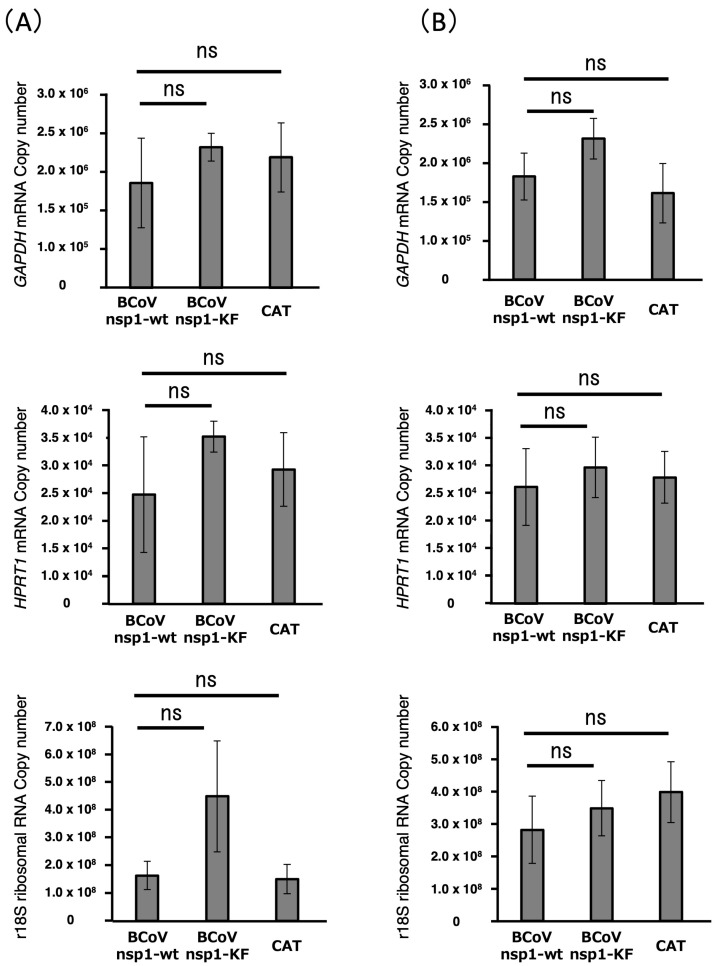
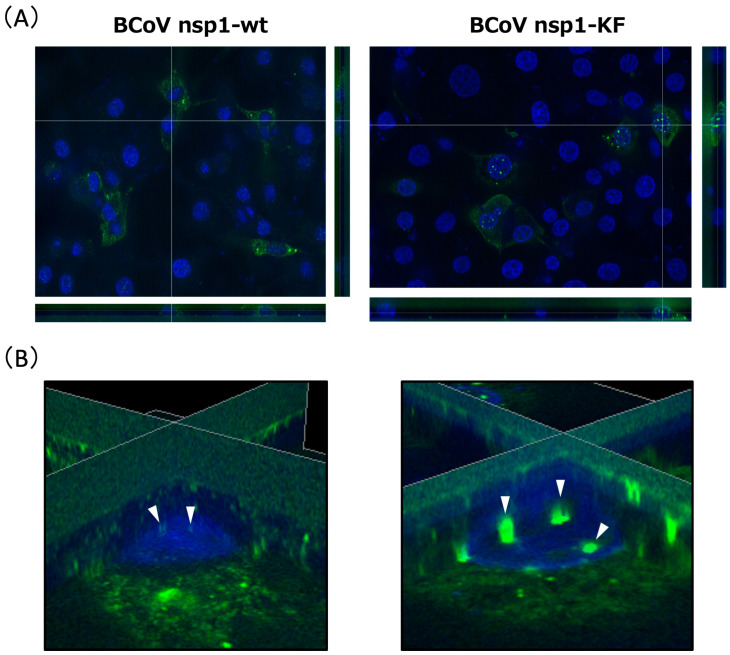
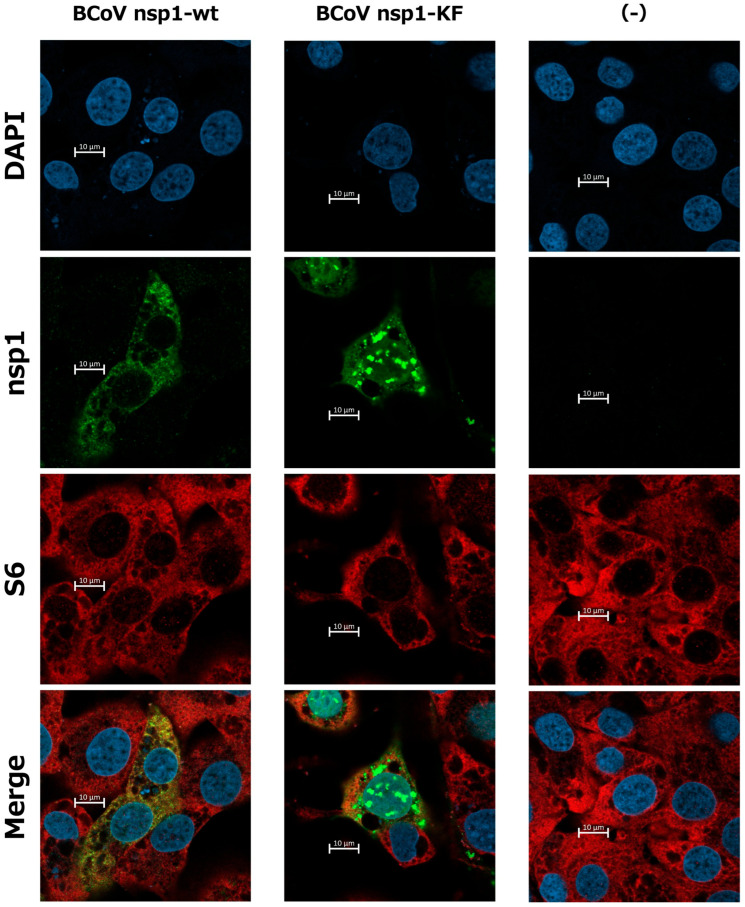
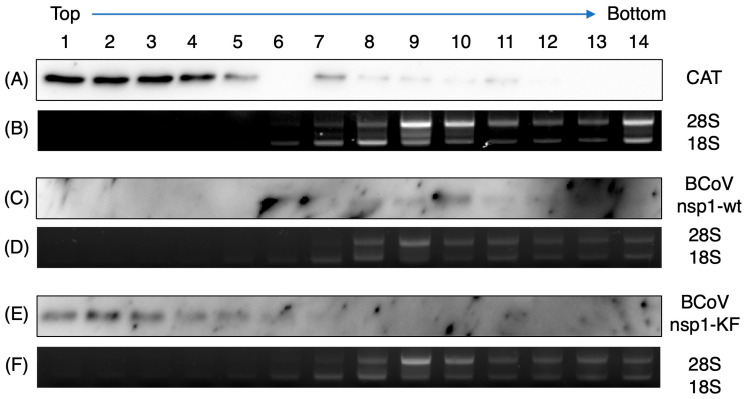
Coronavirus non-structural protein 1 (nsp1) is a pathogenic determinant of Betacoronaviruses. Previous studies demonstrated that the nsp1 of various coronaviruses induces host shutoff through a variety of mechanisms; however, there is little information on the function of bovine coronavirus (BCoV) nsp1. We aimed to characterize the host gene expression suppression function of BCoV nsp1. We first confirmed that the expression of BCoV nsp1 in MAC-T cells, a bovine mammary epithelial cell line, suppressed host and reporter gene expression. Subsequently, lysine and phenylalanine at amino acid positions 232 and 233, respectively, were identified as key residues required for this suppressive effect. Expression levels of housekeeping genes are comparable in cells expressing wild-type BCoV nsp1 and a mutant with alanine substitutions at positions 232 and 233 (BCoV nsp1-KF). Wild-type BCoV nsp1 localized to both the cytoplasm and nucleus; however, BCoV nsp1-KF exhibited prominent nuclear accumulation with dot-like structures. Using confocal microscopy and co-sedimentation analysis, we identified an association between wild-type BCoV nsp1, but not BCoV nsp1-KF, and ribosomes, suggesting that ribosome binding is required for BCoV nsp1-mediated suppression of host gene expression. This is the first study of the characterization of host gene expression suppression by BCoV nsp1.

Keywords: bovine coronavirus; non-structural protein 1; ribosome; shutoff function.


Conflict of interest statement

The authors declare no conflict of interest.

Figures

Figure 1
Figure 1
Assessment of the appropriateness of MAC-T cells in transfection experiments. (A) MDBK or MAC-T cells were transfected with 0, 50, 100, 200, or 400 ng of pRL-TK (encoding the rLuc gene), and rLuc activities were measured at 24 h post-transfection. (B) MAC-T cells were transfected with 400 ng of pCX-eGFP (encoding the eGFP gene), and GFP signals (Green) were observed at 24 h post-transfection. The nucleus was stained with Hoechst 33342 (Blue). (C) Cell viability was measured using Cell Titer-GLO at 24 h post-transfection. Error bars show the standard deviations of results from three independent experiments. ns, not significant (p > 0.01).
Figure 2
Figure 2
Alignment of the partial amino acid sequences of the nsp1s of MERS-CoV, SARS-CoV-2, MHV, and BCoV, and reporter assay in HEK-293 and MAC-T cells expressing BCoV nsp1 and the mutants. (A) Nsp1 sequences of the MERS-CoV strain EMC2012 (accession No.: YP_009047229), SARS-CoV-2 isolate Wuhan-Hu-1 (accession No.: MN908947.3), MHV (accession No.: AF029248.1), and BCoV (accession No.: LC642814.1) are aligned using the Multiple Sequence Comparison by Log-Expectation alignment algorithm. Perfect matches, high amino acid similarities, and low amino acid similarities are represented by asterisks, double dots, and single dots, respectively. A dash “-” indicates a gap in the sequence. The numbers beside the aligned sequences show the positions of amino acid residues. The residues shown in red represent the amino acids that are important for translation inhibition by SARS-CoV-2 nsp1 and MERS-CoV nsp1. The residues shown in blue represent the amino acids in which alanine mutations (KG-to-AA, KF-to-AA, or KK-to-AA mutations) were introduced in the present study. (BE) We co-transfected 293 cells (B,C) or MAC-T cells (D,E) with pRL-TK (encoding the rLuc gene) and pCAGGS-BCoV nsp1-wt (encoding BCoV nsp1), pCAGGS-BCoV nsp1-KF (encoding BCoV nsp1-KF), pCAGGS-BCoV nsp1-KG (encoding BCoV nsp1-KG), or pCAGGS-BCoV nsp1-KK (encoding BCoV nsp1-KK). As a control, pCAGGS-CAT (encoding the CAT gene), pCAGGS- SARS-CoV-2 nsp1-wt (encoding SARS-CoV-2 nsp1), or pCAGGS-SARS-CoV-2 nsp1-KH mt (encoding biologically inactive SARS-CoV-2 nsp1-mt) was used in place of pCAGGS-BCoV nsp1-wt and -mts. Expressed CAT and nsp1s carried the C-terminal FLAG tag. (B,D) At 24 h post-transfection, cell lysates were prepared and subjected to a luciferase assay. Error bars show the standard deviations of results from three independent experiments. Asterisks represent significant differences in rLuc activity (p < 0.01). ns, not significant. Western blot analysis of the cell extracts was performed to detect plasmid-expressing proteins ((C,E), top) and tubulin ((C,E), bottom).
Figure 3
Figure 3
Expression of BCoV nsp1-wt, but not BCoV nsp1-KF, induces inhibition of cellular translation. (A) MAC-T cells were transfected with pCAGGS-BCoV nsp1-wt (encoding BCoV nsp1) or pCAGGS-BCoV nsp1-KF (encoding BCoV nsp1-KF). At 24 h post-transfection, cells were incubated for 30 min in media supplemented with 0.5 μg/mL of puromycin. MAC-T cells labeled with puromycin in the presence or absence of cycloheximide were used as the control for translation inhibition. Lysates were resolved using SDS–10% PAGE, followed by Western blot analysis with an anti-puromycin (A), anti-FLAG (B), or anti-tubulin antibody (C), and cell viability assay measured using CellTiter-GLO (D). Error bars show the standard deviations of results from three independent experiments. ns, not significant (p > 0.01).
Figure 4
Figure 4
Expression of housekeeping genes in MAC-T cells expressing BCoV nsp1, BCoV nsp1-KF, or CAT. MAC-T cells were transfected with pCAGGS-BCoV nsp1, pCAGGS-BCoV nsp1-KF, or pCAGGS-CAT. At 24 h post-transfection (A) and 36 h post-transfection (B), copy numbers of GAPDH mRNA, HPRT1 mRNA, and r18S ribosomal RNA were determined by qRT-PCR. Error bars show the standard deviations of results from three independent experiments. ns, not significant (p > 0.01).
Figure 5
Figure 5
Subcellular localization of BCoV nsp1-wt and BCoV nsp1-KF. MAC-T cells were transfected with pCAGGS-BCoV nsp1-wt (encoding C-terminal FLAG-tagged BCoV nsp1) or pCAGGS-BCoV nsp1-KF (encoding C-terminal FLAG-tagged BCoV nsp1-KF). At 24 h post-transfection, the cells were fixed, permeabilized, and subjected to immunofluorescence analysis with an anti-FLAG antibody. The nuclei were counterstained with Hoechst 33342, and the images were examined using a BZ-X810 fluorescence microscope. For all sets of orthogonal-view images (A), the large image shows the X-Y, the bottom image shows the Z-X, and the right image shows the Z-Y view. Zoomed-in view of 3D reconstructed images of BCoV nsp1- or BCoV nsp1-KF-expressing cells (B). Arrowheads indicates BCoV nsp1-wt or BCoV nsp1-KF present in the nucleus.
Figure 6
Figure 6
Colocalization of BCoV nsp1-wt, but not BCoV nsp1-KF, with ribosomes. MAC-T cells were mock-transfected or transfected with pCAGGS-BCoV nsp1-wt (encoding C-terminal FLAG-tagged BCoV nsp1) or pCAGGS-BCoV nsp1-KF (encoding C-terminal FLAG-tagged BCoV nsp1-KF). At 24 h post-transfection, the cells were fixed, permeabilized, and subjected to immunofluorescence analysis with an anti-FLAG antibody and anti-S6 ribosomal protein. The nuclei were counterstained with Hoechst 33342, and the images were examined using a Zeiss LSM900 confocal microscope.
Figure 7
Figure 7
Co-sedimentation of BCoV nsp1-wt, but not BCoV nsp1-KF, with the 40S ribosomal subunit. MAC-T cells were transfected with pCAGGS-CAT (encoding C-terminal FLAG-tagged CAT, panels (A,B)), BCoV nsp1-wt (encoding C-terminal FLAG-tagged BCoV nsp1, panels (C,D)), or pCAGGS-BCoV nsp1-KF (encoding C-terminal FLAG-tagged BCoV nsp1-KF, panels (E,F)). At 24 h post-transfection, the cell extracts were subjected to sucrose gradient centrifugation analysis. The gradient fractions were analyzed by Western blotting with an anti-FLAG antibody to detect the expressed proteins (panels (A,C,E)) and ethidium bromide staining to detect rRNAs (panels (B,D,F)).

Similar articles

References

    1. De Graaf D.C., Vanopdenbosch E., Ortega-Mora L.M., Abbassi H., Peeters J.E. A Review of the Importance of Cryptosporidiosis in Farm Animals. Int. J. Parasitol. 1999;29:1269–1287. doi: 10.1016/S0020-7519(99)00076-4. - DOI - PMC - PubMed
    1. Hasoksuz M., Hoet A.E., Loerch S.C., Wittum T.E., Nielsen P.R., Saif L.J. Detection of Respiratory and Enteric Shedding of Bovine Coronaviruses in Cattle in an Ohio Feedlot. J. Vet. Diagn. Investig. 2002;14:308–313. doi: 10.1177/104063870201400406. - DOI - PubMed
    1. Saif L.J. Bovine Respiratory Coronavirus. Vet. Clin. N. Am.—Food Anim. Pract. 2010;26:349. doi: 10.1016/j.cvfa.2010.04.005. - DOI - PMC - PubMed
    1. Boileau M.J., Kapil S. Bovine Coronavirus Associated Syndromes. Vet. Clin. N. Am.—Food Anim. Pract. 2010;26:123. doi: 10.1016/j.cvfa.2009.10.003. - DOI - PMC - PubMed
    1. Park G.N., Choe S.E., Song S., Kim K.S., Shin J., An B.H., Moon S.H., Hyun B.H., An D.J. Characterization and Spike Gene Analysis of a Candidate Attenuated Live Bovine Coronavirus Vaccine. Animals. 2024;14:389. doi: 10.3390/ani14030389. - DOI - PMC - PubMed

Substances

LinkOut - more resources