. 2025 Jul 11;13(7):746.
doi: 10.3390/vaccines13070746.

Immune Responses Induced by Recombinant Membrane Proteins of Mycoplasma agalactiae in Goats

Affiliations

Immune Responses Induced by Recombinant Membrane Proteins of Mycoplasma agalactiae in Goats

Beatriz Almeida Sampaio et al. Vaccines (Basel). .

Abstract

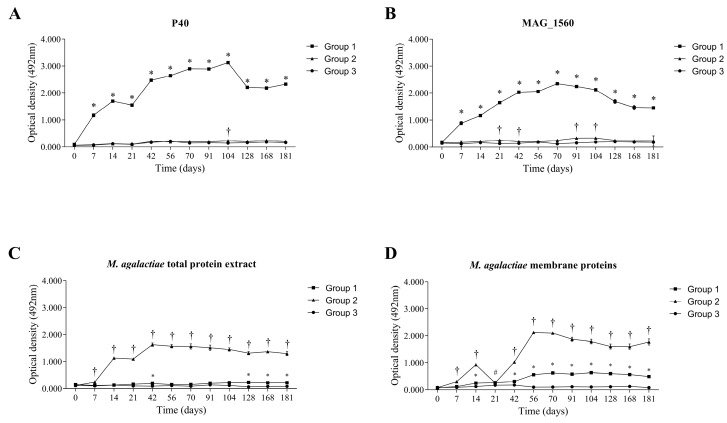
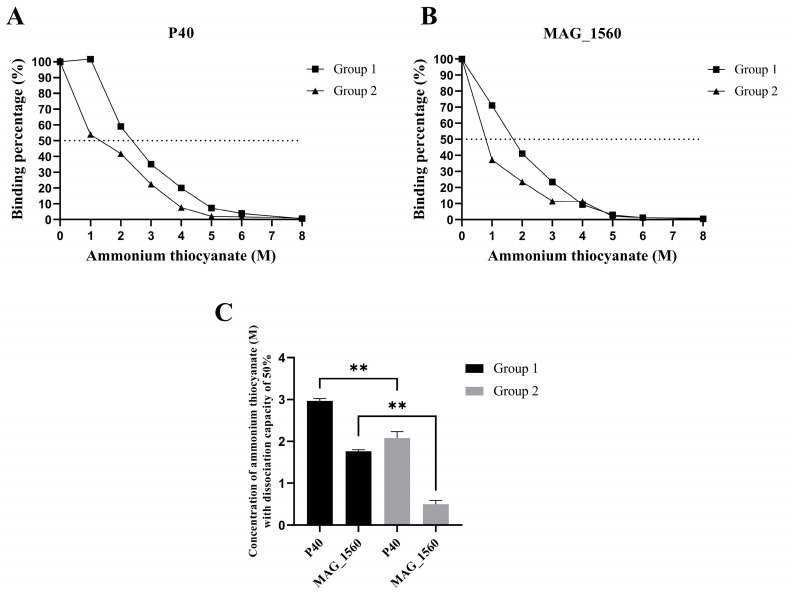
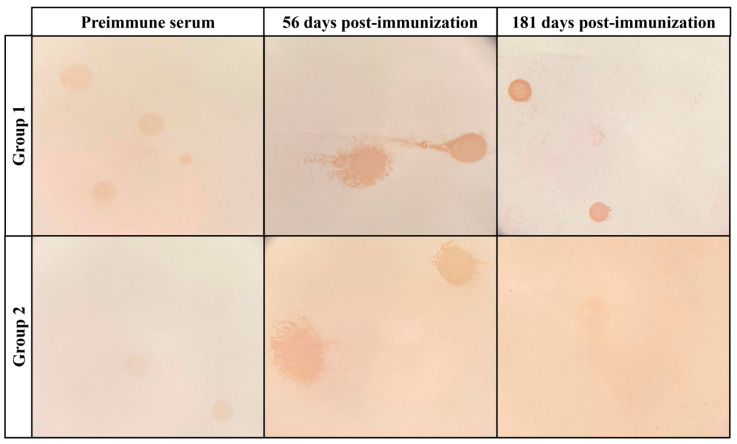
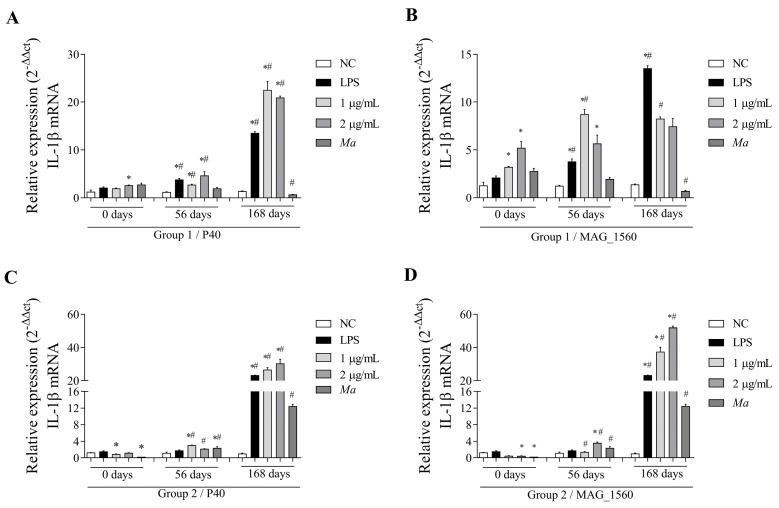
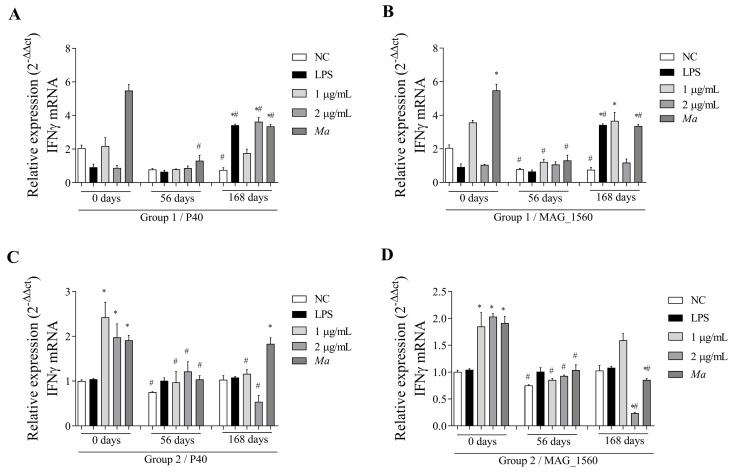
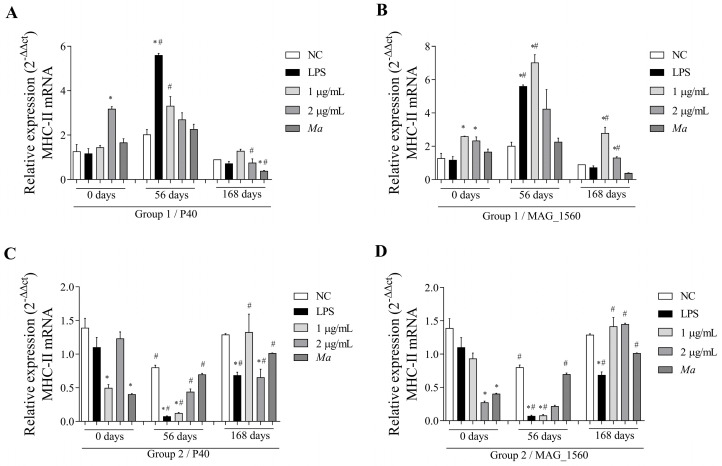
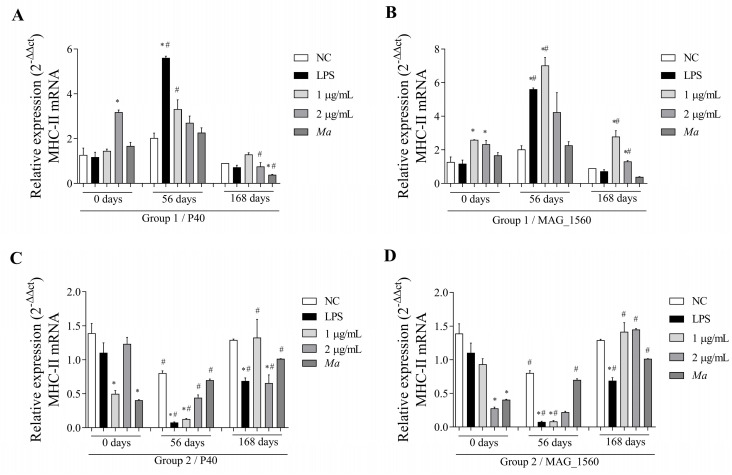
Background/Objectives: Contagious agalactia (CA) is a disease typically caused by Mycoplasma agalactiae, affecting small ruminants worldwide and being endemic in certain countries. CA causes severe economic losses due to mastitis, agalactia, and arthritis. As an alternative to existing immunoprophylactic measures, this study aimed to develop a recombinant subunit vaccine against M. agalactiae and evaluate its specific immune response in goats. Methods: Goats were divided into three groups: group 1 received recombinant proteins (P40 and MAG_1560), group 2 received formalin-inactivated M. agalactiae, and group 3 received Tris-buffered saline (negative control). All solutions were emulsified in Freund's adjuvant. Animals were monitored for 181 days. IgG antibody production was assessed by ELISA, and peripheral blood mononuclear cells (PBMCs) were analyzed by real-time PCR for the expression of IL-1β, IFN-γ, IL-12, and MHC class II genes. Results: M. agalactiae-specific antibody response was observed for six months in the sera of animals from group 1. Analysis of cytokine gene expression revealed increased IL-1β mRNA levels over time in both experimental groups. In group 1, IFN-γ mRNA levels increased with P40 stimulation and decreased with MAG_1560. IL-12 mRNA expression decreased over time in group 1 with P40 stimulation, whereas group 2 showed increased IL-12 expression for both proteins. MHC-II expression was stimulated in both groups. Conclusions: The recombinant proteins induced antibody production and cytokine expression, demonstrating immunogenic potential and supporting their promise as vaccine candidates capable of eliciting both humoral and cellular immune responses against M. agalactiae.

Keywords: M. agalactiae; contagious agalactia; recombinant; subunit; vaccine.


Conflict of interest statement

The authors declare no conflict of interest.

Figures

Figure 1
Figure 1
Purified recombinant proteins visualized by western blotting. Column 1: Ladder: Novex® Sharp Pre-stained Protein Standard; Column 2: P40 (42 kDa); Column 3: MAG_1560 (32 kDa).
Figure 2
Figure 2
Mean values (optical density) for serum IgG antibodies determined by indirect ELISA in vaccinated animals (groups 1 and 2) and negative control (group 3). (A) Production of antibodies in response to P40, (B) MAG_1560, (C) M. agalactiae total protein extract, and (D) M. agalactiae membrane proteins. The groups were compared using the non-parametric Kruskal-Wallis test and Dunn’s post-hoc test. Statistical significance (p < 0.05) is represented by symbols when (#) is different from group 3, (*) is different from groups 2 and 3, and (†) is different from groups 1 and 3.
Figure 3
Figure 3
Avidity profiles of antibodies produced post-immunization. Percentage of antibodies binding to (A) P40 and (B) MAG_1560 in increasing molarities of ammonium thiocyanate. (C) The molarity of ammonium thiocyanate is capable of dissociating 50% of the antibody-antigen binding. Values represent means ± SD. ** p < 0.05. (one-way ANOVA with Bonferroni post-test).
Figure 4
Figure 4
Antibody detection of M. agalactiae colonies over time. Detection of M. agalactiae strain GM139 colonies by specific antibodies present in the serum of group 1 and group 2 animals at pre-immunization and 56 and 181 days post-immunization. Recognition is indicated by increased staining intensity, represented by the brown coloration. Images were captured using a stereoscope.
Figure 5
Figure 5
IL-1β gene expression in PBMCs isolated from vaccinated goats (groups 1 and 2) at 0 (pre-immunization), 56, and 168 days post-immunization. Cells were stimulated with 1 and 2 µg/mL of P40 and MAG_1560 recombinant proteins for 2 h. (A) IL-1β gene expression in P40-stimulated group 1 cells. (B) IL-1β gene expression in group 1 cells stimulated with MAG_1560. (C) IL-1β gene expression in P40-stimulated group 2 cells. (D) IL-1β gene expression in group 2 cells stimulated with MAG_1560. When comparing stimuli between times, the nonparametric Mann-Whitney test was used. Statistical differences were considered when p < 0.05 and are represented by (#) when different from the same group in the time before immunization (0 days). The nonparametric Kruskal-Wallis test, followed by Dunn’s post hoc test, was used for comparison with the negative control at different time points (0, 56, and 168 days). Statistical differences were considered when p < 0.05 and are represented by (*) when different from the respective negative control.
Figure 6
Figure 6
IFN-γ gene expression in PBMCs isolated from vaccinated goats (groups 1 and 2) at 0 (pre-immunization), 56, and 168 days post-immunization. Cells were stimulated with 1 and 2 µg/mL of P40 and MAG_1560 recombinant proteins for 2 h. (A) IFN-γ gene expression in P40-stimulated group 1 cells. (B) IFN-γ gene expression in group 1 cells stimulated with MAG_1560. (C) IFN-γ gene expression in P40-stimulated group 2 cells. (D) IFN-γ gene expression in group 2 cells stimulated with MAG_1560. When comparing stimuli between times, the nonparametric Mann-Whitney test was used. Statistical differences were considered when p < 0.05 and are represented by (#) when different from the same group in the time before immunization (0 days). The nonparametric Kruskal-Wallis test, followed by Dunn’s post hoc test, was used for comparison with the negative control at different time points (0, 56, and 168 days). Statistical differences were considered when p < 0.05 and are represented by (*) when different from the respective negative control.
Figure 7
Figure 7
IL-12 gene expression in PBMCs isolated from vaccinated goats (groups 1 and 2) at 0 (pre-immunization), 56, and 168 days post-immunization. Cells were stimulated with 1 and 2 µg/mL of P40 and MAG_1560 recombinant proteins for 2 h. (A) IL-12 gene expression in P40-stimulated group 1 cells. (B) IL-12 gene expression in group 1 cells stimulated with MAG_1560. (C) IL-12 gene expression in P40-stimulated group 2 cells. (D) IL-12 gene expression in group 2 cells stimulated with MAG_1560. When comparing stimuli between times, the nonparametric Mann-Whitney test was used. Statistical differences were considered when p < 0.05 and are represented by (#) when different from the same group in the time before immunization (0 days). The nonparametric Kruskal-Wallis test, followed by Dunn’s post-hoc test, was used for comparison with the negative control at different time points (0, 56, or 168 days). Statistical differences were considered when p < 0.05 and are represented by (*) when different from the respective negative control.
Figure 8
Figure 8
MHC-II gene expression in PBMCs isolated from vaccinated goats (groups 1 and 2) at 0 (pre-immunization), 56, and 168 days post-immunization. Cells were stimulated with 1 and 2 µg/mL of P40 and MAG_1560 recombinant proteins for 2 h. (A) MHC-II gene expression in P40-stimulated group 1 cells. (B) MHC-II gene expression in group 1 cells stimulated with MAG_1560. (C) MHC-II gene expression in P40-stimulated group 2 cells. (D) MHC-II gene expression in group 2 cells stimulated with MAG_1560. When comparing stimuli between times, the nonparametric Mann-Whitney test was used. Statistical differences were considered when p < 0.05 and are represented by (#) when different from the same group in the time before immunization (0 days). The nonparametric Kruskal-Wallis test, followed by Dunn’s post-hoc test, was used for comparison with the negative control at different time points (0.56, or 168 days). Statistical differences were considered when p < 0.05 and represented by (*) when different from the respective negative control.

Similar articles

References

    1. Lambert M.C. Agalaxie Contagieuse Des Brebis et Des Chèvres. Rev. Sci. Tech. L’oie. 1987;6:681–711. doi: 10.20506/rst.6.3.308. - DOI - PubMed
    1. Abdollahi M., Lotfollahzadeh S., Salehi T.Z., Moosakhani F., Raoofi A. Assessment of the Duration of Maternal-Derived Antibodies Specific to the Mycoplasma agalactiae Vaccine in Goat Kids. Vet. Med. Sci. 2022;8:2119–2125. doi: 10.1002/vms3.888. - DOI - PMC - PubMed
    1. Gómez-Martín Á., Amores J., Paterna A., De la Fe C. Contagious Agalactia Due to Mycoplasma Spp. in Small Dairy Ruminants: Epidemiology and Prospects for Diagnosis and Control. Vet. J. 2013;198:48–56. - PubMed
    1. Bergonier D., Berthelot X., Poumarat F. Contagious Agalactia of Small Ruminants: Current Knowledge Concerning Epidemiology, Diagnosis and Control. Rev. Sci. Tech. L’oie. 1997;16:848–873. doi: 10.20506/rst.16.3.1062. - DOI - PubMed
    1. Madanat A., Zendulková D., Pospíšil Z. Contagious Agalactia of Sheep and Goats. A Review. Acta Vet. Brno. 2001;70:403–412. doi: 10.2754/avb200170040403. - DOI

LinkOut - more resources