. 2025 Sep;247(6):2678-2696.
doi: 10.1111/nph.70337. Epub 2025 Jul 29.

SHOT GLASS, an R2R3-MYB transcription factor, promotes gemma cup and gametangiophore development in Marchantia polymorpha

Affiliations

SHOT GLASS, an R2R3-MYB transcription factor, promotes gemma cup and gametangiophore development in Marchantia polymorpha

Yuuki Sakai et al. New Phytol. 2025 Sep.

Abstract

Many plants reproduce asexually by generating clonal progeny from vegetative tissues, a process known as vegetative reproduction. This reproduction mode contrasts with sexual reproduction, which enhances genetic diversity. The bryophyte Marchantia polymorpha L. adjusts its reproductive strategy in response to seasonal environmental cues, transitioning between vegetative and sexual reproduction. In this study, we identified a gene encoding the R2R3-MYB transcription factor SHOT GLASS (MpSTG) as a critical regulator of gemma cup development. MpSTG was predominantly expressed in the gemma cup, apical notch, and sexual reproductive organs (gametangiophores). MpSTG mutation resulted in the formation of abnormal shot-glass-shaped structures lacking gemmae, which replaced functional gemma cups. Additionally, MpSTG-disrupted plants failed to develop sexual reproductive organs, even under inductive conditions. In Arabidopsis thaliana, the MpSTG ortholog LATERAL ORGAN FUSION1 (AtLOF1) plays a pivotal role in lateral bud formation. We demonstrated that MpSTG can partially compensate for AtLOF1's function in lateral bud formation in A. thaliana. Our findings suggest that MpSTG is a key regulator of vegetative and sexual reproduction in M. polymorpha, and illustrate that evolutionarily conserved developmental mechanisms may function in both the gametophyte generation of bryophytes and the sporophyte generation of angiosperms.

Keywords: bryophyte; gametangiophore; gemma cup; organogenesis; sexual reproduction; transcription factor; vegetative reproduction.


Conflict of interest statement

None declared.

Figures

Fig. 1
Fig. 1
Expression profile of MpR2R3‐MYB5 in Marchantia polymorpha. (a) RT‐qPCR to detect MpR2R3‐MYB5 (Mp8g11870) expression in vegetative and reproductive tissues; 1‐wk thallus (Th), apical notches (AN) and gemma cup (GC) in 3‐wk thallus, and male (mRO) and female (fRO) reproductive organs. MpELONGATION FACTOR1α (MpEF1α) and MpACTIN8 (MpACT8) genes were used as internal references. White dots indicate each data point. The box plot illustrates the interquartile range (IQR), spanning from the first quartile (Q1) to the third quartile (Q3). The horizontal line within the box marks the median (second quartile, Q2). The whiskers extend to the minimum and maximum values within 1.5 times the IQR from Q1 and Q3, respectively. n = 4. Alphabets indicate significant differences (one‐way ANOVA followed by Tukey's HSD test, P < 0.05). (b–j) Histochemical GUS assay of a representative proMpSTG:GUS lines. (b) Three‐week old thallus. (c) Apical region with a gemma cup on the 3‐wk‐old thallus. (d, e) Transverse sections of developing and mature gemma cups on a 3‐wk‐old thallus. (f) Magnified image of dashed square in (e). Male reproductive organ (antheridiophore) in early stage (g) and developing stage (h). Female reproductive organ (archegoniophore) in early stage (i) and developing stage (j). dGe, developing gemma; Fl, floor cell; Mu, mucilage cell. Bars: (b) 5 mm; (c, h, j) 1 mm; (d, f) 100 μm; (e, g, i) 500 μm.
Fig. 2
Fig. 2
Shot glass‐shaped structures on MpR2R3‐MYB5/MpSHOT GLASS gene‐disrupted plants. (a–c) Two‐week‐cultivated apical explants of wild‐type (Tak‐1; a), MpR2R3‐MYB5/SHOT GLASS (MpSTG) gene‐disrupted mutant (Mpstg ko ; b), and complementation line (gMpSTG‐Citrine/Mpstg ko ; c). Bar, 5 mm. (d–f) Representative gemma cups or shot‐glass‐shaped structures on each plant; Tak‐1 (d), Mpstg ko (e), and gMpSTG‐Citrine/Mpstg ko (f). Bar, 500 μm. (g) The number of normal and abnormal gemma cups on the 3‐wk‐cultivated apical explants of wild‐type, Mpstg ko , and gMpSTG‐Citrine/Mpstg ko plants. Data represent counts from six individual plants for each line. P‐values were calculated on the number of normal gemma cups using a Students' t‐test following an F‐test. Asterisk indicates statistically significance (P < 0.05) between normal gemma‐cup numbers in WT and those in gMpSTGCitrine/Mpstgko . (h, i) Transverse section of the gemma cup in wild‐type plant (h) and the shot glass‐shaped structure formed in Mpstg ko plant (i). Bar, 100 μm. (j) Expression and intracellular localization of MpSTG‐tdTomato at the basal region of gemma cup in gMpSTG‐tdTomato/Mpstg ko plants. Bar, 100 μm. (k–n) MpHA9 expression profile in gemma cup and the shot glass‐shaped structure. GUS staining in the gemma cup of pMpHA9:GUS plants (k) and the shot glass‐shaped structure of Mpstg ge /pMpHA9:GUS plants (l). Transverse section of GUS‐stained gemma cup in pMpHA9:GUS plants (m) and the shot glass‐shaped structure of Mpstg ge /pMpHA9:GUS plants (n). Bar: (k–n) 500 μm.
Fig. 3
Fig. 3
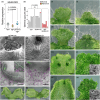
MpSTG overexpression suppresses air chamber development. (a–i) Two‐week‐old proMpEF1α:MpSTG‐GR transgenic plants treated with mock (b–e) or 10 μM o dexamethasone (DEX; f–i). (a) Schematic representation of treatment. (b, f) Top view of the thallus. (c, g) Side views of the thallus. Bar, 1 mm. (d, h) High‐magnification images within the dotted rectangles in (b, f) were captured using a scanning electron microscope. Bar, 100 μm. (e, i) Transverse sections of the thalli. Bar, 200 μm. Enlarged views of the red dotted rectangles are shown in the lower panels (i′). Arrowheads indicate intercellular gaps or spaces corresponding to air chamber initiation. Bar: (i′) 100 μm. (j–n) Two‐week‐old wild‐type (k, l) and proMpEF1α:MpSTG‐GR transgenic plants (m, n) treated with mock for 1 wk, followed by an additional 1‐wk treatment with 10 μM of DEX. (j) Schematic of treatment. (k, m) Top view of the thallus. (l, n) Side views of the thallus. Bar, 1 mm. (o–r) Top view (o, q) and black‐field images of transverse section (q, r) of gemma‐developing areas in proMpEF1α:MpSTG‐GR transgenic plants treated with mock (o, p) or 10 μM of DEX (q, r) for 3 wk. Bar, 500 μm.
Fig. 4
Fig. 4
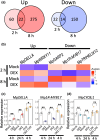
Gene expression changes by MpSTG overexpression. (a) Venn diagram showing differences between differentially expressed genes (DEGs) in mock treatment plants and those in MpSTG‐GR plants after 2 and 8 h of treatment with 10 μM dexamethasone (DEX). DEGs were identified based on RNA‐seq data, with expression levels quantified as transcripts per million (TPM). (b) Heatmap of expression profiles of transcription factor genes commonly regulated at both 2 and 8 h after DEX treatment in MpSTG‐GR plants. RNA‐seq expression values (TPM) were transformed into Z‐scores for each gene. Columns represent differentially expressed transcription factor genes, and rows represent treatment conditions (mock or 10 μM DEX) at each time point. Red and blue indicate higher and lower expression, respectively, relative to the mean value for each gene. (c, d) Relative expression levels of MpDELLA and Mp1R‐MYB17 (c) MpCYCB;1 (d) in 1‐wk‐old gemmalings of MpSTG‐GR plants treated with mock or 10 μM DEX for 4 and 24 h, and 10 μM cycloheximide (CHX) or 10 μM DEX + 10 μM CHX for 4 h. MpACT7 and MpEF1a were used as reference genes in RT‐qPCR. Bars represent the mean ± SE. The dots represent individual data points. Asterisks indicate statistically significant differences (*, P < 0.05; **,P < 0.01) and ns indicates not significant (P > 0.05) (Student's t‐test following an F‐test); n = 4.
Fig. 5
Fig. 5
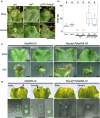
Functions of MpSTG and MpGCAM1 in gemma‐cup formation. (a) Relative expression levels of MpSTG in the apical part of regenerated thalli 2 wk after cutting thalli of wild‐type, Mpstg ko , and gMpSTG‐Citrine/Mpstg ko plants. MpACT7 and MpEF1a were used as reference genes in RT‐qPCR. Dots represent each data point. The box plot illustrates the interquartile range (IQR), spanning from the first quartile (Q1) to the third quartile (Q3). The horizontal line within the box marks the median (second quartile, Q2). The whiskers extend to the minimum and maximum values within 1.5 times the IQR from Q1 and Q3, respectively. n = 12. (b) The number of normal and abnormal gemma cups on 3‐wk‐cultivated apical explants of wild‐type (Tak‐1), MpGCAM1‐Citrine KI (GCAM1‐Cit), and Mpstg ge /MpGCAM1‐Cit (stg ge /GCAM1‐Cit) plants. Data represent counts from five individual plants for each line. No statistically significant difference (ns, P > 0.05) was detected in gemma‐cup numbers between Tak‐1 and GCAM1‐Cit, based on P‐value calculated using a Students' t‐test following an F‐test. (c, d) Representative gemma cups in MpGCAM1‐Citrine KI (c) and Mpstg ge /GEMMA CUP‐ASSOCIATED MYB 1 (GCAM1)‐Cit plants (d) captured with a scanning electron microscope. Bar, 1 mm. (e, f) MpGCAM1‐Citrine signal in the basal region of a gemma cup in MpGCAM1‐Citrine KI (e) and a shot glass‐like structure in Mpstg ge /MpGCAM1‐Citrine KI (f) plants. Magnified image of the gemma cup basal floor cells are shown in the insets. Bar, 500 μm. (g, h) Two‐week‐cultivated apical explants of Mpgcam1 ko (g) and Mpstg ge /Mpgcam1 ko double mutant (h). Bar, 5 mm. (i–l) Effects of ectopic MpSTG overexpression on the growth of regenerating thallus. Cut thalli of MpSTG‐GR (i, j) and MpSTG‐GR/Mpgcam1 ko (k, l) were cultured for 9 d in the absence (i, k) or presence (j, l) of 10 μM of dexamethasone (DEX). Bar, 1 mm. (m–p) Effects of ectopic MpGCAM1 overexpression. Apical explants of MpGCAM1‐GR (m, n) and Mpstg ge /MpGCAM1‐GR (o, p) were treated with mock (m, o) or 10 μM of DEX (n, p) for 14 d. Scanning electron microscopy images of cell clamps generated following DEX treatment are presented in the insets (n, p). Bar, 2 mm; white bars in insets, 500 μm.
Fig. 6
Fig. 6
MpSTG functions in gametangiophore formation. (a) Representative apical regions of male and female thalli in wild‐type, Mpstg ko , and gMpSTG‐Citrine/Mpstg ko plants after 3 wk of supplemental irradiation with far‐red light (FR). Bar, 5 mm. (b) Days until the first gametangiophore recognition after the start of FR irradiation. Numbers above the graph indicate the number of plants that formed the gametangiophore among eight biological replicates. nd indicates that gametangiophore formation was not detected. Each dot represents an individual data point. The box plot illustrates the interquartile range (IQR), which spans from the first quartile (Q1) to the third quartile (Q3). The horizontal line within the box marks the median (second quartile, Q2). The whiskers extend to the minimum and maximum values within 1.5 times the IQR from Q1 and Q3, respectively. (c) Representative apical regions of male and female explants of MpBNB‐GR and Mpstg ge /MpBNB‐GR plants treated with mock solution or 10 μM of dexamethasone (DEX) for 3 wks. Bar, 2 mm. (d) Sexual reproductive development in male and female MpBNB‐Citrine and Mpstg ge /MpBNB‐Citrine plants. Representative apical meristematic regions after 3 wk of culture under the inductive conditions are shown (upper panels). Arrowheads indicate sexual reproductive organs in the apical meristematic regions. Bar, 5 mm. Thallus epidermal cells and the MpBNB‐Citrine fluorescence at the apical notch of the male and female plants are shown (lower panels). Images in white‐dashed rectangles are magnified on the right. Asterisks indicate the apical notches. Bar: (black) 50 μm; (white) 10 μm.
Fig. 7
Fig. 7
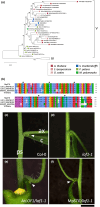
Phylogenetic relationship between MpSTG and its homologs in land plants. (a) Phylogenetic analysis of MpSTG and its homologs across the land plants. An unrooted maximum‐likelihood tree was generated using amino acid sequences for the R2R3‐MYB DNA‐binding domains from MpSTG and related R2R3‐MYB proteins representing diverse land plant lineages; Arabidopsis thaliana, Solanum lycopersicum, Oryza sativa, Selaginella moellendorffii, Physcomitrium patens, and Marchantia polymorpha. Bootstrap values (%) from 1000 replicates are shown at the nodes. The scale bar represents evolutionary distance as the rate of amino acid substitutions. (b) Multiple alignment of the R2R3‐MYB domains of MpSTG, AtLOF1, AtLOF2, AtBRAVO, and SlTrifoliate. Black asterisks indicate conserved tryptophan (Trp) residues typical of plant R2R3‐MYB proteins. Amino acids are color‐coded according to the ClustalW convention based on their physicochemical properties. (c–f) Morphology of paraclade junctions in A. thaliana Col‐0 wild‐type (c), lof1‐1 (d), AtLOF1 OX /lof1‐1 (e), and MpSTG OX /lof1‐1 (f) plants. White arrowheads indicate accessory buds. ax, axillary stem; c, cauline leaf; ps, primary stem. Bar, 2 mm.
Fig. 8
Fig. 8
Scheme of developmental processes of gemma cup in Marchantia polymorpha. Solid arrows, known positive regulatory pathways; blant‐ended arrow, known negative regulatory pathway; dashed arrows, positive regulatory pathways suggested in this study; thick arrows, positive regulatory pathways with unknown processes; thick blant‐ended arrows, negative regulatory pathways with unknown processes.

Similar articles

References

    1. Aki SS, Mikami T, Naramoto S, Nishihama R, Ishizaki K, Kojima M, Takebayashi Y, Sakakibara H, Kyozuka J, Kohchi T et al. 2019. Cytokinin signaling is essential for organ formation in Marchantia polymorpha . Plant and Cell Physiology 60: 1842–1854. - PubMed
    1. Aki SS, Morimoto T, Ohnishi T, Oda A, Kato H, Ishizaki K, Nishihama R, Kohchi T, Umeda M. 2022. R2R3‐MYB transcription factor gemma cup‐associated MYB1 mediates the cytokinin signal to achieve proper organ development in Marchantia polymorpha . Scientific Reports 12: 21123. - PMC - PubMed
    1. Barnes CR, Land WJG. 1908. Bryological papers. II. The origin of the cupule of Marchantia . Botanical Gazette 46: 401–409.
    1. Bowman JL, Araki T, Arteaga‐Vazquez MA, Berger F, Dolan L, Haseloff J, Ishizaki K, Kyozuka J, Lin SS, Nagasaki H et al. 2016. The naming of names: guidelines for gene nomenclature in Marchantia . Plant and Cell Physiology 57: 257–261. - PMC - PubMed
    1. Bowman JL, Kohchi T, Yamato KT, Jenkins J, Shu S, Ishizaki K, Yamaoka S, Nishihama R, Nakamura Y, Berger F et al. 2017. Insights into land plant evolution garnered from the Marchantia polymorpha genome. Cell 171: 287–304. - PubMed

MeSH terms

LinkOut - more resources