. 2025 Aug;14(4):e70038.
doi: 10.1002/mbo3.70038.

Two Centrins and Their Posttranslational Modification Modulate the Cell Cycle of Giardia lamblia

Affiliations

Two Centrins and Their Posttranslational Modification Modulate the Cell Cycle of Giardia lamblia

Hye Rim Yeo et al. Microbiologyopen. 2025 Aug.

Abstract

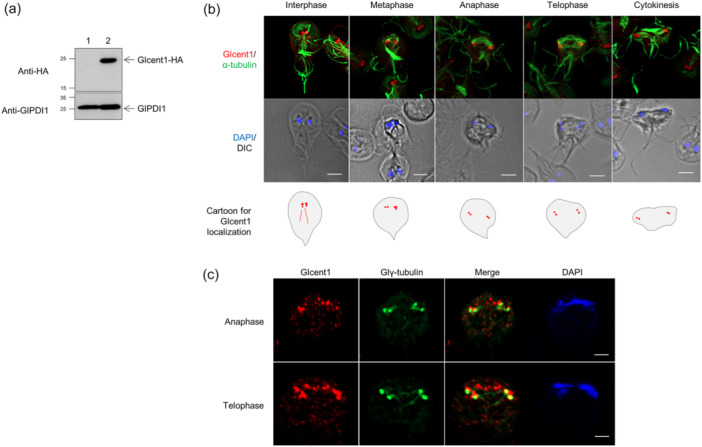
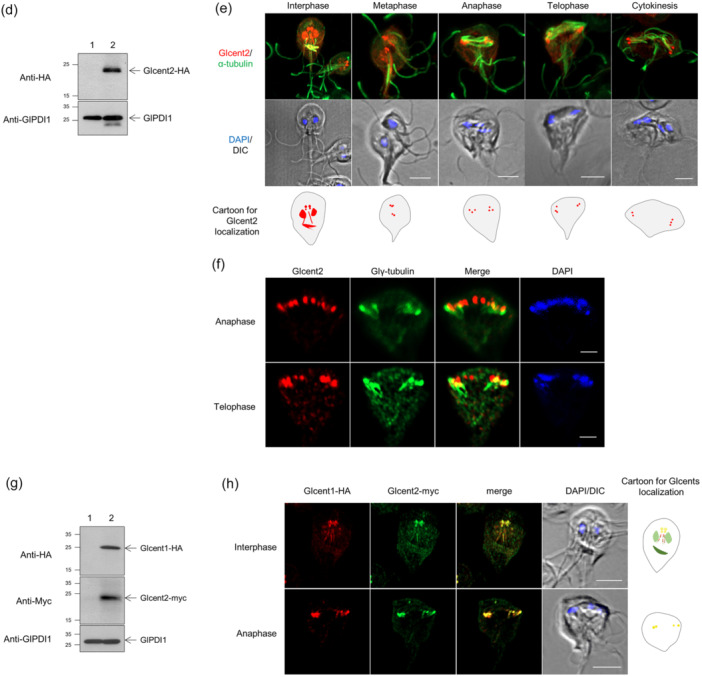
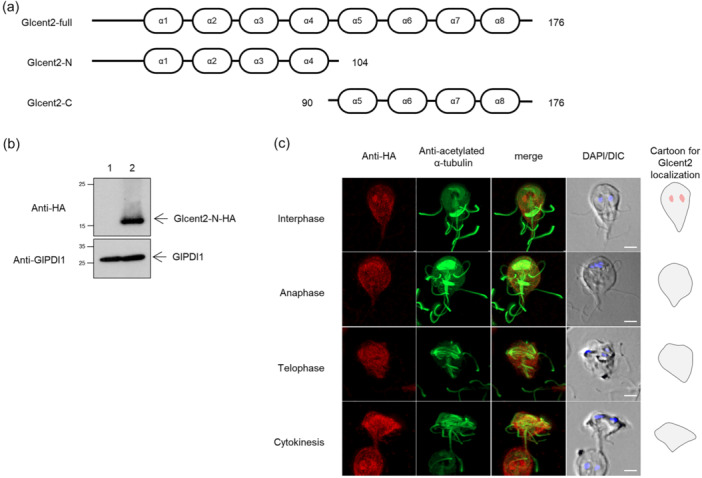
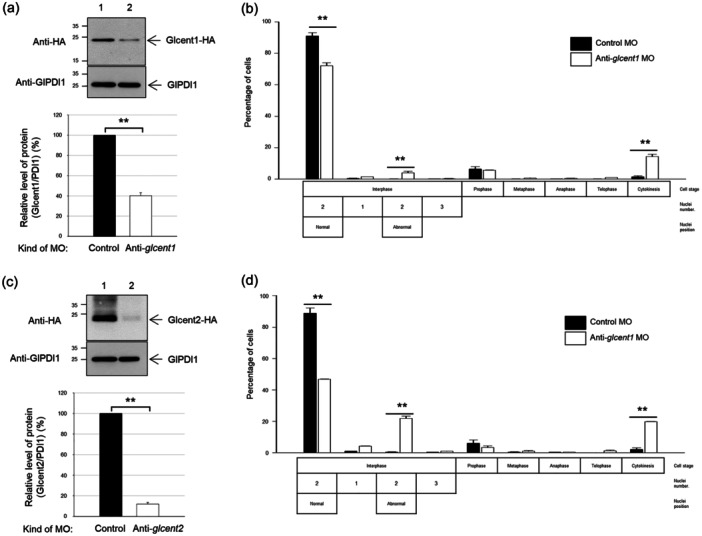
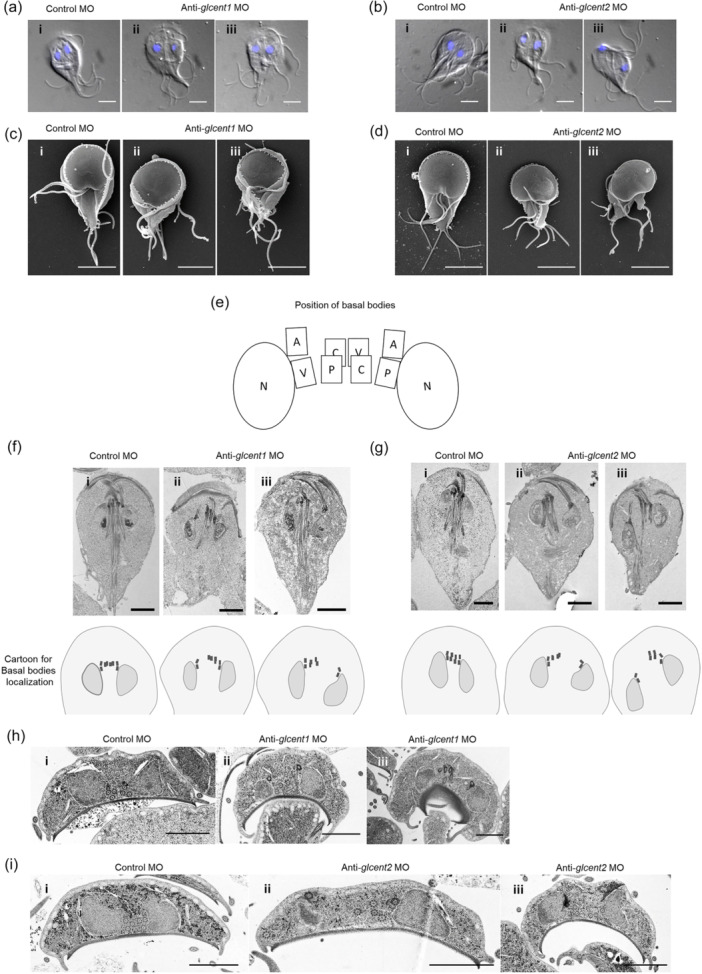
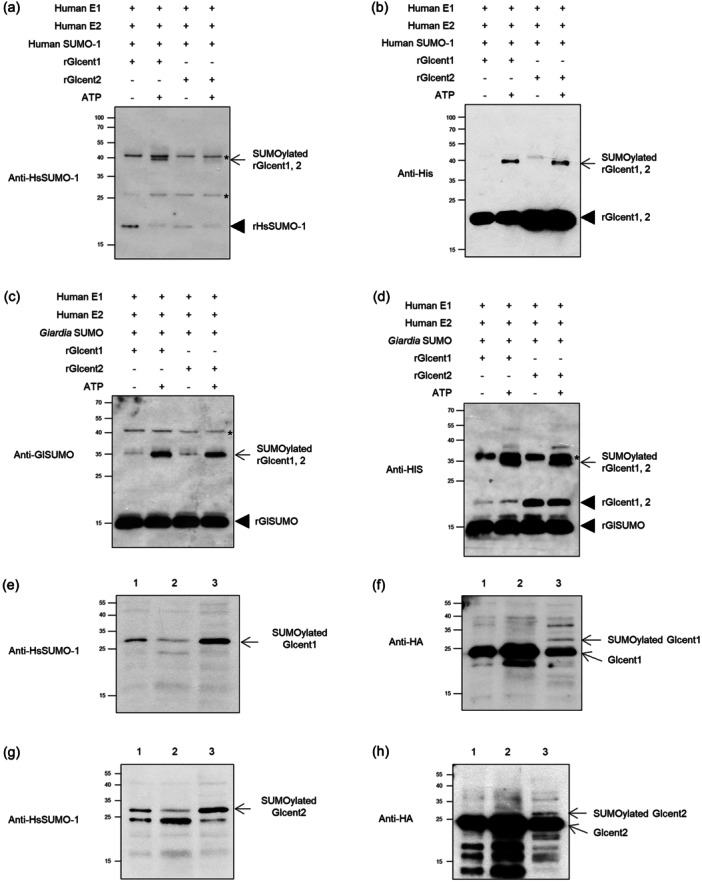
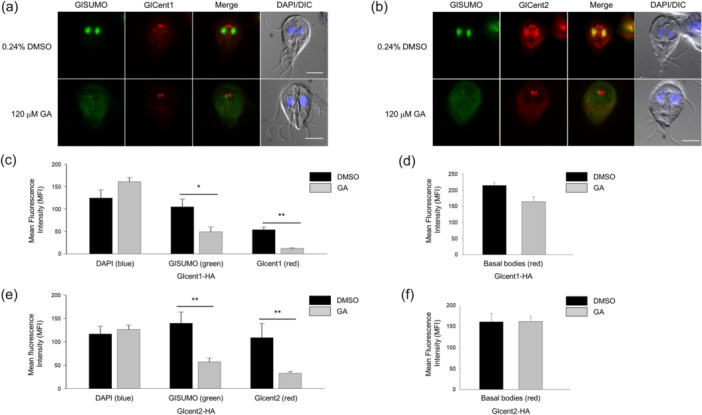
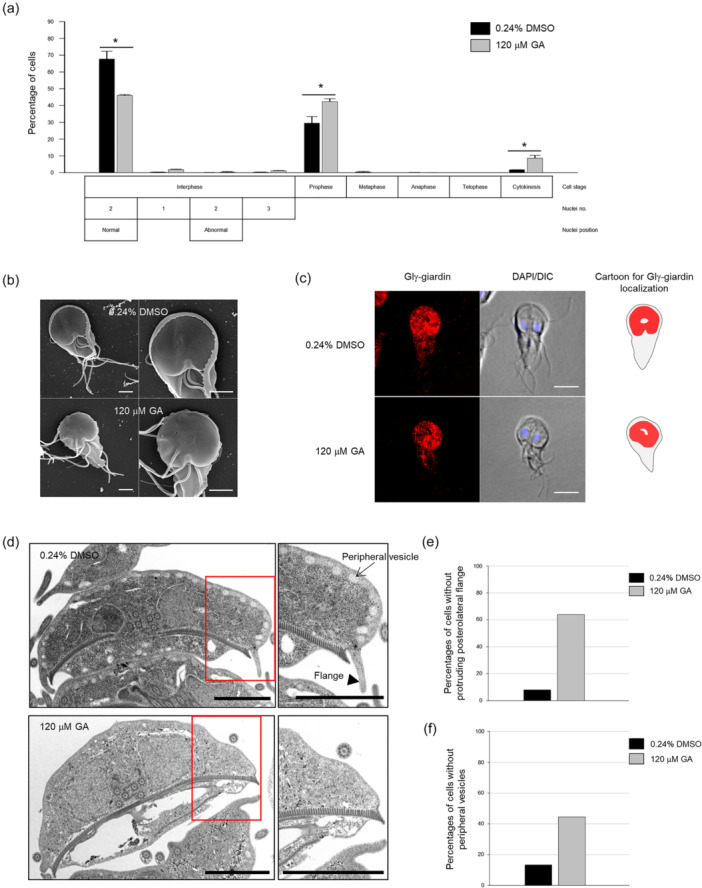
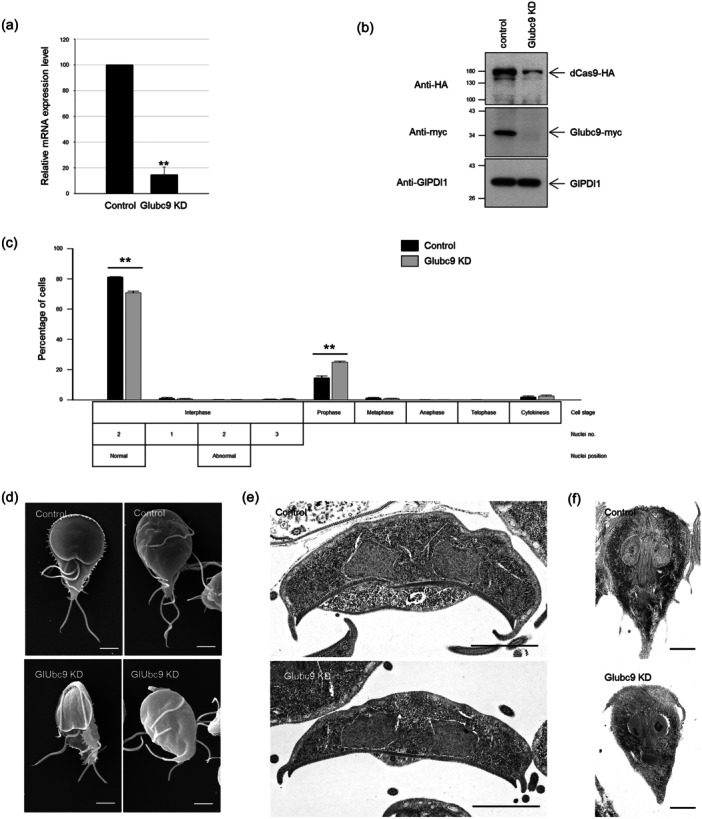
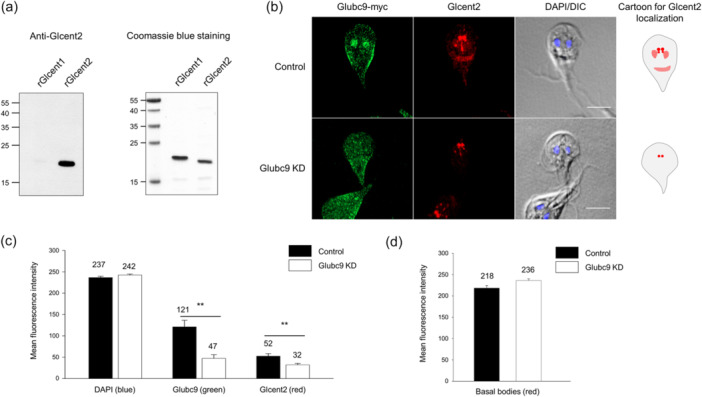
Centrins, Ca2+-binding proteins conserved in eukaryotes, are the key components of the microtubule-organizing center. Giardia lamblia possesses two centrins (GL50803_6744: centrin 1; GL50803_104685: centrin 2) localized in the basal bodies during cell division. G. lamblia centrin 2 (Glcent2) is also found in the nuclei of interphase Giardia, with its N-terminal half being necessary for this localization. Morpholino-mediated knockdown of Glcents resulted in abnormal nuclear positioning and cytokinesis, causing cell malformations, including ventral discs and flagella defects. Small ubiquitin-like modifier (SUMO)ylation is a posttranslational modification, which modulates several cellular processes. Here, we demonstrated that Glcents are substrates of SUMO through in vitro SUMOylation and immunoprecipitation experiments. Additionally, treatment of Giardia with ginkgolic acid, which inhibits the E1 enzyme of the SUMO pathway, and CRISPRi-mediated inhibition of G. lamblia Ubc9, the E2 conjugation enzyme involved in SUMOylation, resulted in defects in the localization of Glcents. Blocking SUMOylation resulted in the arrest of Giardia cells and conformational changes, including alterations in the ventral disc shape, posterolateral flanges, and peripheral vesicles. Taken together, we demonstrated that Glcents function in Giardia cell cycle progression and morphogenesis, with the activity of both Glcents being modulated by SUMOylation.

Keywords: Giardia lamblia; SUMOylation; cell cycle; centrin.


Conflict of interest statement

None declared.

Figures

FIGURE 1
FIGURE 1
Expression and localization of Giardia lamblia centrins (Glcents) in Giardia expressing epitope‐tagged Glcent(s). (a) Western blot of Giardia cells expressing HA‐tagged Glcent1. (b) Immunofluorescence assays (IFAs) of interphase and dividing Giardia cells expressing HA‐tagged Glcent1 using rat anti‐HA and mouse anti‐acetylated‐α‐tubulin antibodies, a mitotic spindle marker. (c) IFA of anaphase and telophase Giardia cells expressing HA‐tagged Glcent1 using mouse anti‐HA and rat anti‐Glγ‐tubulin antibodies (a basal bodies marker). (d) Western blotting of Giardia cells expressing HA‐tagged Glcent2. (e) IFAs of interphase and dividing Giardia cells expressing HA‐tagged Glcent2 using rat anti‐HA and mouse anti‐acetylated‐α‐tubulin antibodies. (f) IFA of anaphase and telophase Giardia cells expressing the HA‐tagged Glcent2 using mouse anti‐HA and rat anti‐Glγ‐tubulin antibodies. (g) Western blotting of Giardia cells expressing HA‐tagged Glcent1 and myc‐tagged Glcent2. (h) IFAs of interphase and anaphase Giardia cells expressing HA‐tagged Glcent1 and myc‐tagged Glcent2 using rat anti‐HA and mouse anti‐myc antibodies. Giardia trophozoites carrying the vector plasmid(s) were included as controls (lane 1). GlPDI1 was monitored as a loading control for protein amount. For IFAs, the cells treated with primary antibodies were incubated with Alexa Fluor 555‐conjugated anti‐rat IgG and Alexa Fluor 488‐conjugated anti‐mouse IgG. Slides were mounted with the ProLong Gold Antifade Mountant with DAPI and then examined with a Zeiss LSM980 inverted confocal laser scanning microscope. The cell morphology is represented by differential interference contrast (DIC) images. Scale bars = 5 μm.
FIGURE 1
FIGURE 1
Expression and localization of Giardia lamblia centrins (Glcents) in Giardia expressing epitope‐tagged Glcent(s). (a) Western blot of Giardia cells expressing HA‐tagged Glcent1. (b) Immunofluorescence assays (IFAs) of interphase and dividing Giardia cells expressing HA‐tagged Glcent1 using rat anti‐HA and mouse anti‐acetylated‐α‐tubulin antibodies, a mitotic spindle marker. (c) IFA of anaphase and telophase Giardia cells expressing HA‐tagged Glcent1 using mouse anti‐HA and rat anti‐Glγ‐tubulin antibodies (a basal bodies marker). (d) Western blotting of Giardia cells expressing HA‐tagged Glcent2. (e) IFAs of interphase and dividing Giardia cells expressing HA‐tagged Glcent2 using rat anti‐HA and mouse anti‐acetylated‐α‐tubulin antibodies. (f) IFA of anaphase and telophase Giardia cells expressing the HA‐tagged Glcent2 using mouse anti‐HA and rat anti‐Glγ‐tubulin antibodies. (g) Western blotting of Giardia cells expressing HA‐tagged Glcent1 and myc‐tagged Glcent2. (h) IFAs of interphase and anaphase Giardia cells expressing HA‐tagged Glcent1 and myc‐tagged Glcent2 using rat anti‐HA and mouse anti‐myc antibodies. Giardia trophozoites carrying the vector plasmid(s) were included as controls (lane 1). GlPDI1 was monitored as a loading control for protein amount. For IFAs, the cells treated with primary antibodies were incubated with Alexa Fluor 555‐conjugated anti‐rat IgG and Alexa Fluor 488‐conjugated anti‐mouse IgG. Slides were mounted with the ProLong Gold Antifade Mountant with DAPI and then examined with a Zeiss LSM980 inverted confocal laser scanning microscope. The cell morphology is represented by differential interference contrast (DIC) images. Scale bars = 5 μm.
FIGURE 2
FIGURE 2
Expression and localization of truncated Glcent2 containing the amino‐terminal part of the protein. (a) Schematic diagram of two truncated Glcent2 proteins. These two proteins are expected to be expressed in an HA‐tagged form under their own promoter, Pglcent2. Eight EF domains for Ca2+‐binding are indicated with serial numbers. Each construct is indicated with the amino acid residue numbers of Glcent2 included in the resulting protein. (b) Western blotting of Giardia cells expressing HA‐tagged Glcent2. Giardia trophozoites carrying the vector plasmid(s) were included as controls (lane 1). GlPDI1 was monitored as a loading control for protein amount. (c) Immunofluorescence assays of interphase and dividing Giardia cells expressing HA‐tagged Glcent2 using rat anti‐HA and mouse anti‐acetylated‐α‐tubulin antibodies. The cells treated with primary antibodies were incubated with Alexa Fluor 555‐conjugated anti‐rat IgG and Alexa Fluor 488‐conjugated anti‐mouse IgG. The cell morphology is represented by differential interference contrast (DIC) images. Scale bars = 2 μm.
FIGURE 3
FIGURE 3
Effect of morpholino (MO)‐mediated Glcent knockdown on Giardia division. (a, b) Giardia cells expressing HA‐tagged Glcent1 were collected at 24 h after transfection with control (lane 1, closed bars) or anti‐glcent1 (lane 2, open bars) MO. (a) Western blotting analysis of MO‐mediated Glcent1 knockdown (KD) in Giardia and a bar graph demonstrating the relative expression of HA‐tagged Glcent1 in cells treated with anti‐glcent1 MO compared with that in the control cells. (b) Effect of MO‐mediated Glcent1 KD on the nuclear phenotypes and cell division of G. lamblia. (c, d) Giardia cells expressing HA‐tagged Glcent2 were collected at 24 h after transfection with control (lane 1, closed bars) or anti‐glcent2 (lane 2, open bars) MO. (c) Western blotting analysis of MO‐mediated Glcent2 KD in Giardia and a bar graph demonstrating the relative expression of HA‐tagged Glcent2 in cells treated with anti‐glcent2 MO compared with that in the control cells. (d) Effect of MO‐mediated Glcent2 KD on the nuclear phenotypes and cell division of G. lamblia. Data are presented as the mean of three independent experiments. **, p < 0.01.
FIGURE 4
FIGURE 4
Effect of morpholino (MO)‐mediated Glcent knockdown on the morphology of Giardia. Giardia cells expressing HA‐tagged Glcent were collected at 24 h after transfection with control or anti‐glcent morpholino. Panel i presents Giardia cells treated with the control MO, whereas panels ii and iii demonstrate knockdown (KD) cells for Glcent1 or Glcent2. (a) Observation of Glcent1 KD cells by differential interference contrast (DIC). (b) Observation of Glcent2 KD cells by DIC. (c) Observation of Glcent1 KD cells by scanning electron microscopy (SEM). (d) Observation of Glcent2 KD cells by SEM. (e) Schematic diagram demonstrating the basal bodies for each pair of flagella. N indicates the nucleus, and basal bodies of caudal, anterior, posterolateral, and ventral flagella are annotated as C, A, P, and V, respectively. (f) Longitudinal transmission electron micrograph (TEM) images of Glcent1 KD cells. (g) Longitudinal TEM images of Glcent2 KD cells. (h) Transverse TEM images of Glcent1 KD cells. (i) Transverse TEM images of Glcent2 KD cells. Scale bars = 2 μm.
FIGURE 5
FIGURE 5
SUMOylation of Glcents. (a, b) In vitro SUMOylation of recombinant Glcent 1 (rGlcent1) and rGlcent2 using Homo sapiens SUMO‐1 (HsSUMO‐1). SUMOylation reactions with 5 μg rGlcents were performed using the components provided by the SUMOylation kit (BML‐UW8955) with or without ATP. The resulting reactions were separated by 12% SDS‐PAGE and transferred onto a polyvinylidene fluoride membrane. (a) Western blotting using polyclonal rabbit anti‐HsSUMO‐1 antibodies (1:1000 dilution). (b) Western blotting using monoclonal mouse anti‐histidine antibodies (1:10,000 dilution). (c, d) In vitro SUMOylation of rGlcent1 and rGlcent2 using G. lamblia SUMO (GlSUMO). (c) Western blotting using polyclonal rat anti‐GlSUMO antibodies (1:1000 dilution). (d) Western blotting using monoclonal mouse anti‐histidine antibodies (1:10,000 dilution). SUMOylated rGlcents are indicated by arrows, whereas unmodified SUMO or rGlcents are denoted with arrowheads. Nonspecific bands are indicated by asterisks. (e, f) Detection of SUMOylated Glcent1 by immunoprecipitation (IP) using the resin conjugated with SUMO‐interaction motif. Extracts of Giardia cells expressing HA‐tagged Glcent1 were incubated with the resin, and bound proteins were precipitated by centrifugation. (e) Western blot using polyclonal rabbit anti‐HsSUMO‐1 antibodies (1:1000 dilution). (f) Western blot using monoclonal mouse anti‐HA antibodies (1:1000 dilution). (g, h) Detection of SUMOylated Glcent2 by IP using the resin conjugated with the SUMO‐interaction motif. (g) Western blotting using polyclonal rabbit anti‐HsSUMO‐1 antibodies (1:1000 dilution). (f) Western blotting using monoclonal mouse anti‐HA antibodies (1:1000 dilution). The resulting IPs (lane 3) were analyzed by western blotting along with the cell extracts used for IP (lane 1) and flow‐through fraction (lane 2).
FIGURE 6
FIGURE 6
Effect of the SUMOylation inhibitor, ginkgolic acid (GA), on the localization of Glcents in Giardia trophozoites. Giardia cells expressing HA‐tagged Glcent1 (a) or Glcent2 (b) were treated with 120 μM GA for 24 h and subsequently examined by immunofluorescence assays (IFAs) using anti‐GlSUMO and anti‐HA antibodies. As a control, the same cells were treated with 0.24% DMSO instead of the inhibitor and examined by IFAs. Cell morphology is shown via differential interference contrast (DIC) images. Scale bars = 5 μm. The mean fluorescence intensities (MFIs) of basal bodies and nuclei in individual cells were quantified using ImageJ. (c) A bar graph of the nuclear MFIs of DAPI, GlSUMO, and Glcent1 in the HA‐tagged Glcent1 cells treated with GA compared with those treated with DMSO. (d) A bar graph of Glcent1 MFIs at the basal bodies in the HA‐tagged Glcent1 cells treated with GA compared with those in cells treated with DMSO. (e) A bar graph of the nuclear MFIs of DAPI, GlSUMO, and Glcent2 in the HA‐tagged Glcent2 cells treated with GA compared with those in cells treated with DMSO. (f) A bar graph of Glcent2 MFIs at the basal bodies in the HA‐tagged Glcent1 cells treated with GA compared with those in cells treated with DMSO. *0.01 < p < 0.05 and **p < 0.01.
FIGURE 7
FIGURE 7
Effects of the SUMOylation inhibitor, ginkgolic acid (GA), on the cell division and morphology of Giardia lamblia. Giardia trophozoites were treated with 120 μM GA for 24 h (gray bars), and then stained with 10% Giemsa for division phenotype, or fixed for scanning electron microscopy (SEM), immunofluorescence assays (IFAs), and transmission electron microscopy (TEM). As a control, the same cells were treated with 0.24% DMSO instead of the inhibitor (closed bars). (a) Effect of GA on the nuclear phenotypes and cell division of G. lamblia. The asterisks indicate statistically significant differences at *, 0.01 < p < 0.05. (b) SEM images of the control (treated with 0.24% DMSO) and GA‐treated cells. Enlarged images are also presented to enable the comparison of the flanges surrounding ventral discs between these cells. Scale bars = 2 μm. (c) IFAs of the control and GA‐treated cells using rat anti‐Glγ‐giardin antibodies. The cell morphology is shown in differential interference contrast (DIC) images. Scale bars = 5 μm. (d) TEM images of the control and GA‐treated cells. The portions of TEM images indicated with red‐lined boxes are presented as enlarged panels for observation of the formation of flanges (arrowhead) and peripheral vesicles (arrow). Scale bars = 2 μm. (e) Bar graph showing the percentages of cells with protruding flanges among the control and GA‐treated cells. (f) Bar graph comparing the percentages of cells with peripheral vesicles between the control and GA‐treated cells.
FIGURE 8
FIGURE 8
CRISPRi‐mediated knockdown (KD) of Giardia lamblia ubc9, Glubc9, and its effect on cell division and morphology of G. lamblia. (a) Quantitative real‐time PCR for glubc9 transcripts. (b) Western blotting of the control and Glubc9 KD cells using anti‐HA (for dCas9 expression), anti‐myc (for Glubc9 expression), and anti‐GlPDI1 antibodies as a loading control. (c) Effect of Glubc9 KD on cell division. Both control and Glubc9 KD cells were stained with 10% Giemsa for the observation of nuclear phenotype and cell division phases. (d) Dorsal and ventral views of control and Glubc9 KD cells by scanning electron microscopy. (e) Transverse transmission electron micrograph (TEM) images of the control and Glubc9 KD cells. (f) Longitudinal TEM images of the control and Glubc9 KD cells. Scale bars = 2 μm. **p < 0.01.
FIGURE 9
FIGURE 9
Localization of Glcent2 in Glubc9 knockdown (KD) cells. (a) Specificity of anti‐Glcent2 antibodies. Recombinant Glcent1 (rGlcent1) and rGlcent2 proteins were reacted with polyclonal antibodies against rGlcent2. Both proteins were also visualized by Coomassie blue staining. (b) Immunofluorescence assays of the control and Glubc9 KD cells using anti‐myc and anti‐rGlcent2 antibodies. Giardia cells expressing myc‐tagged Glubc9, HA‐tagged dCas9, but with a random guide RNA (gRNA) instead of gRNA for glubc9 serve as the control cells. The cells treated with primary antibodies were incubated with Alexa Fluor 488‐conjugated anti‐mouse IgG and Alexa Fluor 568‐conjugated anti‐rat IgG. The cell morphology is represented by differential interference contrast (DIC) images. Scale bars = 5 μm. The mean fluorescence intensities (MFIs) of basal bodies and nuclei were measured using ImageJ. (c) A bar graph of the Glcent2 MFIs in basal bodies in Glubc9 KD cells compared with those in the control cells. (d) A bar graph of the nuclear MFIs of DAPI, Glubc9, and Glcent2 in Glubc9 KD cells compared with those in the control cells. **p < 0.01.

Similar articles

References

    1. Abodeely, M. , DuBois K. N., Hehl A., et al. 2009. “A Contiguous Compartment Functions as Endoplasmic Reticulum and Endosome/Lysosome in Giardia lamblia .” Eukaryotic Cell 8: 1665–1676. 10.1128/EC.00123-09. - DOI - PMC - PubMed
    1. Adam, R. D. 2021. “ Giardia duodenalis: Biology and Pathogenesis.” Clinical Microbiology Reviews 34: e0002419. 10.1128/CMR.00024-19. - DOI - PMC - PubMed
    1. Aubusson‐Fleury, A. , Balavoine G., Lemullois M., Bouhouche K., Beisson J., and Koll F.. 2017. “Centrin Diversity and Basal Body Patterning Across Evolution: New Insights From Paramecium .” Biology Open 6: 765–776. 10.1242/bio.024273. - DOI - PMC - PubMed
    1. Avidor‐Reiss, T. , Mazur M., Fishman E. L., and Sindhwani P.. 2019. “The Role of Sperm Centrioles in Human Reproduction—The Known and the Unknown.” Frontiers in Cell and Developmental Biology 7: 188. 10.3389/fcell.2019.00188. - DOI - PMC - PubMed
    1. Baum, P. , Furlong C., and Byers B.. 1986. “Yeast Gene Required for Spindle Pole Body Duplication: Homology of Its Product With Ca2+‐Binding Proteins.” Proceedings of the National Academy of Sciences 83: 5512–5516. 10.1073/pnas.83.15.5512. - DOI - PMC - PubMed

MeSH terms

Substances

LinkOut - more resources