Review
. 2025 Jul 31;7(3):032003.
doi: 10.1088/2515-7647/adf167. Epub 2025 Jul 28.

Recent advancements in molecular photoacoustic tomography

Affiliations
Review

Recent advancements in molecular photoacoustic tomography

Eric Hall et al. JPhys Photonics. .

Abstract

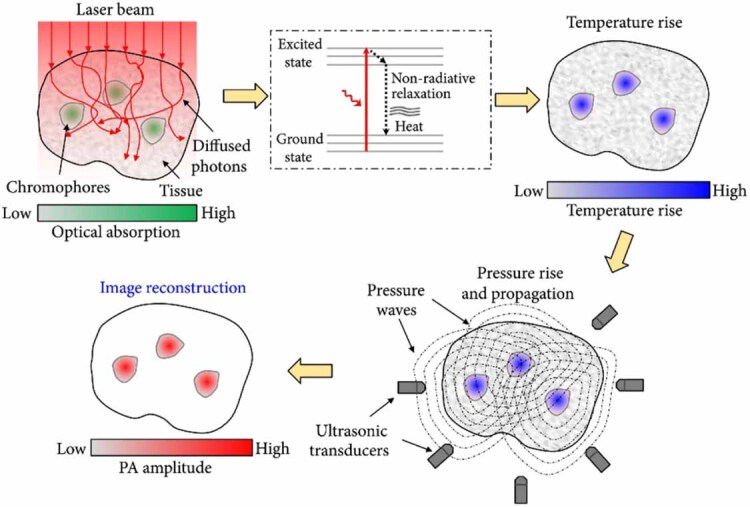
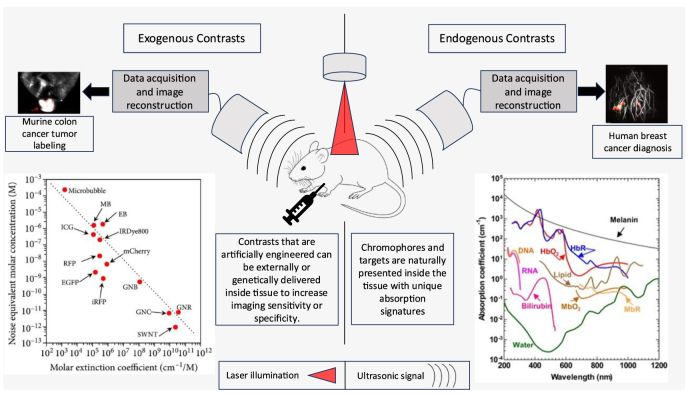
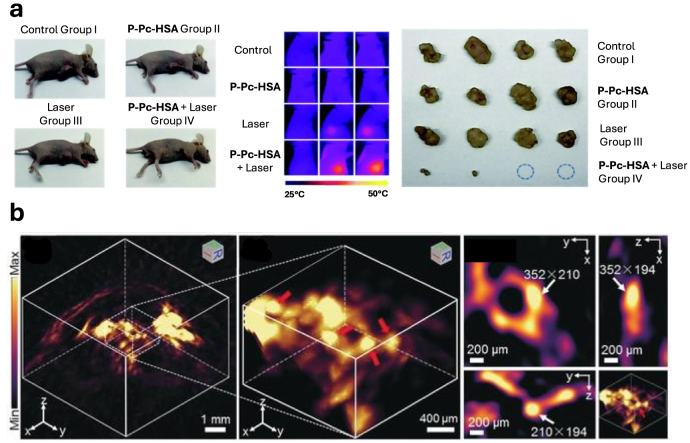
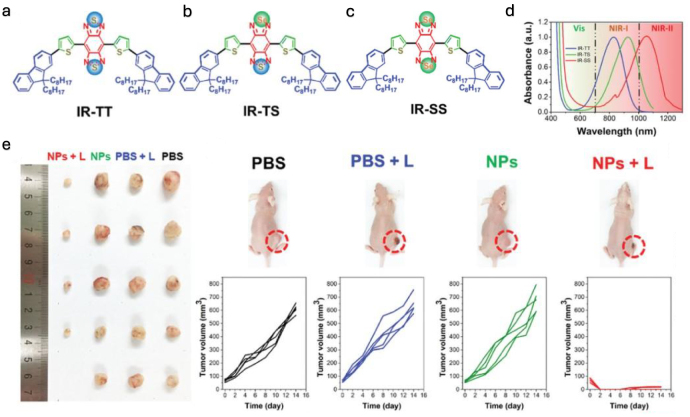
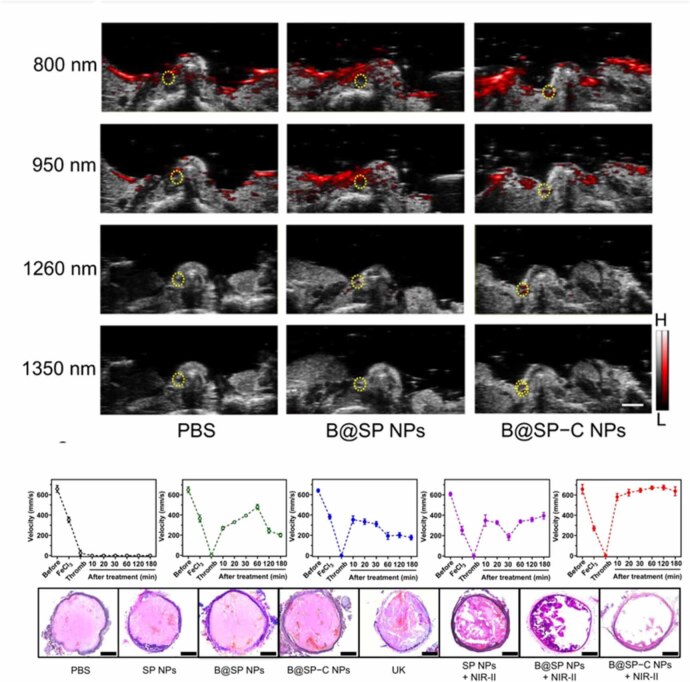
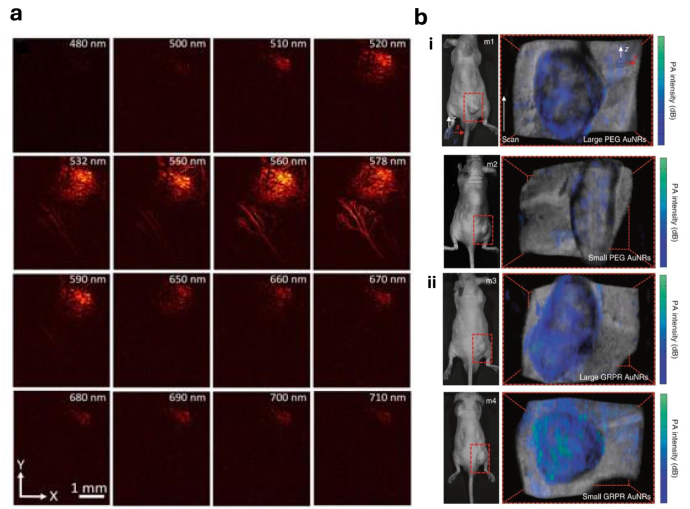
Photoacoustic tomography (PAT) is an emerging biomedical imaging technology that combines the molecular sensitivity of optical imaging with the spatial resolution of ultrasonic imaging in deep tissue. Molecular PAT, a subset of PAT, takes advantage of the specific absorption of molecules to reveal tissue structures, functions, and dynamics. Thanks to the high sensitivity to the optical absorption of molecules, PAT can selectively image those molecules by tuning the excitation wavelength to each target's optical absorption signature. PAT has imaged various molecular targets in vivo, ranging from endogenous chromophores, e.g. hemoglobin, melanin, and lipids, to specialized exogenous contrasts such as organic dyes, genetically encoded proteins, and nano/microparticles. Each molecular contrast hosts inherent advantages. Endogenous contrasts allow for truly noninvasive imaging but cannot attain high specificity or sensitivity for many biological processes, whereas artificial exogenous contrasts can. Recent advances in imaging these contrast agents have shown the immense potential of photoacoustic imaging for diagnosing, monitoring, and treating medical conditions, along with studying the fundamental processes in vivo.

Keywords: endogenous contrast; exogenous contrast; molecular imaging; molecular photoacoustic tomography; photoacoustic microscopy (PAM); photoacoustic tomography (PAT).


Conflict of interest statement

L S L has a financial interest in BLOCH Quantum Imaging Solutions, although they did not support this work. The other authors declare no competing financial interests.

Figures

Figure 1
Figure 1
Overview of the photoacoustic effect and its use in a simplified photoacoustic tomography (PAT) imaging system. Reproduced from [2]. CC BY 4.0.
Figure 2
Figure 2
Article structure outline. Human breast cancer diagnosis image. Reproduced from [35]. CC BY 4.0. Endogenous contrast absorption spectra graph. Reproduced from [2]. CC BY 4.0. Murine colon cancer tumor labeling image. Reproduced from [36]. CC BY 4.0. Exogenous contrast absorption spectra graph. Reproduced from [2]. CC BY 4.0.
Figure 3
Figure 3
(a) Ex vivo IVPA imaging of a human right coronary artery at 1730 nm. (i) Representative cross-sectional PA images, (ii) US images, (iii) merged PA/US images and (iv) their corresponding Movat’s pentachrome-stained histopathology sections. Scale bar is 500  μm. Reproduced from [11]. CC BY 4.0. (b) (i) Photoacoustic micrograph (532 nm wavelength), representative of ten independent experiments (n = 10). (ii) Time course of glucose measurements at different depths (37, 75 and 97.5 μm) at P1, compared with reference blood glucose values when faced with glucose challenge test. Scale bar is 100 μm. Reproduced from [13]. CC BY 4.0. (c) In vivo Optical Resolution OR-PAM of oxygen saturation in a mouse ear with ultrafast dual-wavelength excitation at wavelengths of 532 and 558 nm in pulse separated by 50 ns. (C) Oxygen saturation image of the mouse ear calculated from separate 532 and 558 nm pulses. The artery–vein pairs are labeled as 1, 2, and 3. Scale bar is 800 μm [53]. John Wiley & Sons. © 2020 WILEY-VCH Verlag GmbH & Co. KGaA, Weinheim. (d) SBH-PACT of a cancerous breast. Depth-encoded angiogram of the affected breast with tumor identified by a white circle. Nipple marked with a magenta circle. Patient is a 48 year-old female with an invasive lobular carcinoma (grade 1/3). Scale bar is 1 cm. Reproduced from [35]. CC BY 4.0. (e) (i) UV-PAM image of undecalcified patient bone sections on a glass slide from a patient with osteoblastic osteosarcoma showing neoplastic osteoid matrix, denoted by red arrows. (ii) Corresponding H&E image acquired by a digital whole-slide scanning microscope with a ×40 objective, with an essentially identical appearance. Scale bars, 500 µm. Adapted from [12], with permission from Springer Nature. (f) UV-PAM MAP image of the PA signal of a fixed mouse’s brain slice; close-up image of the hippocampal region. Scale bar is 200 μm. Copyright [20] (2018) Society of Photo Optical Instrumentation Engineers (SPIE). (g) Melanoma image acquired with PAT, clearly showing the melanoma and skin surface with a photoacoustic depth of 1.9 mm. Scale bar is 1 mm. Reprinted from [54], Copyright (2017), with permission from Elsevier.
Figure 4
Figure 4
(a) In vivo PA images of Tyr-expressing K562 cells after subcutaneous injection into the flank of a nude mouse (λex = 600 nm). Volume-rendered image (day 0). Section is 14 mm × 14 mm × 6 mm. Adapted from [108], with permission from springer nature. (b) The PA images were acquired at 750 nm. (i) In vivo whole-body PACT images of the kidney region of a nude mouse, acquired 1 week after injection of BphP1-expressing U87 cells into the left kidney. The ON- and OFF-state PA images show the major blood-enriched internal organs, including the left kidney (LK), right kidney (RK), spinal cord (SC), renal vein (RV), bladder (BL) and spleen (SP). (ii) An overlay of the U87 tumor (in color) in the left kidney and the blood-dominated OFF-state image (in grayscale). Hb, hemoglobin. (iii) The differential image showing the left kidney. The scale bar is 3 mm in all images. Adapted from [96], with permission from springer nature. (c) Depiction of a GCaMP6s expressing mouse response to electrical stimulation of the left hind paw maximum intensity projection along the depth direction of the 3D image. Relative increase in OA signal with respect to the baseline for a slice at approximately 1 mm depth at different time points following the stimulation pulse for a GCaMP6s-expressing mouse. Frames depict the signal from left to right at (i) 0 ms, (ii) 240 ms, (iii) 360 ms, (iv) 480 ms, (v) 720 ms, (vi) 960 ms. Scale bar is 5 mm. Adapted from [103], with permission from Springer Nature.
Figure 5
Figure 5
(a) (Left) Sixteen nude mice bearing tumors were randomly divided into four groups. Group I was the control group without any treatment. Group II was the dark group, and only P-Pc-HSA was administered (P-Pc-HSA, 50 ml, 144 mg ml−1, 8 min in dark). Group III was the laser group, and only light was administered (1064 nm laser, 1.2 W cm−2, 8 min). Group IV was the treatment group:4 h after the intratumor injection of P-Pc-HSA (the nanoagent still retained in the tumor principally at this time), 1064 nm laser was administered to perform PTT. (Middle) Thermal imaging on mice tumor shows the significant temperature increase. (Right) The rapid temperature increases at tumor sites resulted in an irreversible damage, and some tumors even disappeared. Reproduced from [113]. CC BY 3.0. (b) 3D Reconstruction PA image of apoptotic tumor (left) and 3D-slice in tumor tissues (right) in DOX-treated mice at 10 h after injection of 1-RGD. Red arrows showed the views of representative individual apoptotic region within the tumor tissues. White arrows show the same apoptotic region in the xy, xz, and yz panels [114]. John Wiley & Sons. © 2019 Wiley-VCH Verlag GmbH & Co. KGaA, Weinheim.
Figure 6
Figure 6
(a) IR-TT consists of D–π–A–π–D conjugated small molecules (as donor units) with thiophene serving as both the π-conjugation unit and the electronic bridge for ICT. A strong acceptor, benzo[1,2-c:4,5-c’]bis([1,2,5]thiadiazole) (BBT), is included to achieve a lower energy gap. To further redshift the absorption, sulfur (S) atoms in the BBT unit were replaced with selenium (Se) atoms. This led to the synthesis of IR-TS (b) and IR-SS (c), with one and two S atoms substituted, respectively. (d) The absorption peak of IR-TT is at 830 nm, while IR-TS and IR-SS exhibit shifts to 930 nm and 1060 nm, respectively [117]. (e) Tumor-bearing mice were uniformly classified as four groups (PBS, NPs only, laser only, and NPs + laser) after the tumor size reaches ≈80 mm3. the tumors display similar growth rates in the PBS, the laser only, and the NPs only groups. the mice in the NPs + laser group exhibited almost complete inhibition of tumor progress without any tumor recurrence in the next 14 d post-treatment. (a)–(e) [117] John Wiley & Sons. © 2020 WILEY-VCH Verlag GmbH & Co. KGaA, Weinheim.
Figure 7
Figure 7
(a) Images of the blood clot under 800, 950, 1260, and 1350 nm, respectively. At 1260 nm, the nanoprobe exhibited a bright PA signal, while the background signal from endogenous absorbers was weak (top). After all treatments (PBS, SP NPs, B@SP NPs, B@SP-C NPs, free UK, SP NPs + NIR-II laser, B@SP NPs + NIR-II laser, and B@SP–C NPs + NIR-II laser), the carotid arteries were collected for sectioning. H&E staining of the vascular sections was then performed to visualize the embolism in the vessels. Quantitative data revealed that the relative volume of clots in the B@SP − C NPs + NIR-II group was reduced by approximately 90% (bottom). (a) Reproduced from [24]. CC BY 4.0.
Figure 8
Figure 8
(a) PA signals at wavelengths ranging from 480 to 710 nm. At 650 nm, the best contrast was observed between healthy blood vessels and CNV. Reproduced from [138]. CC BY 4.0. (b) (i) Photographs and photoacoustic imaging of tumor-bearing mice (m1–m4) with non-targeted large and small AuNRs. (ii) Targeted large and small AuNRs. Adapted from [139], with permission from Springer Nature.

Similar articles

  • Short-Term Memory Impairment.
    Cascella M, Al Khalili Y. Cascella M, et al. 2024 Jun 8. In: StatPearls [Internet]. Treasure Island (FL): StatPearls Publishing; 2025 Jan–. 2024 Jun 8. In: StatPearls [Internet]. Treasure Island (FL): StatPearls Publishing; 2025 Jan–. PMID: 31424720 Free Books & Documents.
  • The Black Book of Psychotropic Dosing and Monitoring.
    DeBattista C, Schatzberg AF. DeBattista C, et al. Psychopharmacol Bull. 2024 Jul 8;54(3):8-59. Psychopharmacol Bull. 2024. PMID: 38993656 Free PMC article. Review.
  • Management of urinary stones by experts in stone disease (ESD 2025).
    Papatsoris A, Geavlete B, Radavoi GD, Alameedee M, Almusafer M, Ather MH, Budia A, Cumpanas AA, Kiremi MC, Dellis A, Elhowairis M, Galán-Llopis JA, Geavlete P, Guimerà Garcia J, Isern B, Jinga V, Lopez JM, Mainez JA, Mitsogiannis I, Mora Christian J, Moussa M, Multescu R, Oguz Acar Y, Petkova K, Piñero A, Popov E, Ramos Cebrian M, Rascu S, Siener R, Sountoulides P, Stamatelou K, Syed J, Trinchieri A. Papatsoris A, et al. Arch Ital Urol Androl. 2025 Jun 30;97(2):14085. doi: 10.4081/aiua.2025.14085. Epub 2025 Jun 30. Arch Ital Urol Androl. 2025. PMID: 40583613 Review.
  • Spiral laser scanning photoacoustic microscopy for functional brain imaging in rats.
    Zafar M, McGuire LS, Ranjbaran SM, Matchynski JI, Manwar R, Conti AC, Perrine SA, Avanaki K. Zafar M, et al. Neurophotonics. 2024 Jan;11(1):015007. doi: 10.1117/1.NPh.11.1.015007. Epub 2024 Feb 9. Neurophotonics. 2024. PMID: 38344025 Free PMC article.
  • Sexual Harassment and Prevention Training.
    Cedeno R, Bohlen J. Cedeno R, et al. 2024 Mar 29. In: StatPearls [Internet]. Treasure Island (FL): StatPearls Publishing; 2025 Jan–. 2024 Mar 29. In: StatPearls [Internet]. Treasure Island (FL): StatPearls Publishing; 2025 Jan–. PMID: 36508513 Free Books & Documents.

References

    1. Beard P. Biomedical photoacoustic imaging. Interface Focus. 2011;1:602–31. doi: 10.1098/rsfs.2011.0028. - DOI - PMC - PubMed
    1. Li L, Wang L V. Recent advances in photoacoustic tomography. BME Front. 2021;2021:9823268. doi: 10.34133/2021/9823268. - DOI - PMC - PubMed
    1. Wang L V, Yao J. A practical guide to photoacoustic tomography in the life sciences. Nat. Methods. 2016;13:627–38. doi: 10.1038/nmeth.3925. - DOI - PMC - PubMed
    1. Kruger R A, Miller K D, Reynolds H E, Kiser W L, Reinecke D R, Kruger G A. Breast cancer in vivo: contrast enhancement with thermoacoustic CT at 434 MHz—feasibility study. Radiology. 2000;216:279–83. doi: 10.1148/radiology.216.1.r00jl30279. - DOI - PubMed
    1. Xu M, Wang L V. Photoacoustic imaging in biomedicine. Rev. Sci. Instrum. 2006;77:041101. doi: 10.1063/1.2195024. - DOI

LinkOut - more resources