

Differentiating Emphysema From Emphysema-Dominated COPD Patients with CT Imaging Feature and Machine Learning
- PMID: 40734725
- PMCID: PMC12306568
- DOI: 10.2147/COPD.S527914
Differentiating Emphysema From Emphysema-Dominated COPD Patients with CT Imaging Feature and Machine Learning
Abstract
Background: Differentiating between emphysema and emphysema-dominant chronic obstructive pulmonary disease (COPD) remains challenging but crucial for appropriate management. Quantitative computed tomography (QCT) offers potential for improved characterization, yet its optimal application in conjunction with machine learning for this differentiation is not fully established.
Methods: This prospective study enrolled 476 participants (99 with emphysema, 377 with emphysema-dominant COPD) aged 34-88 years. All participants underwent spirometry and chest CT scans. QCT features including emphysema index, mean lung density, airway measurements, and vessel measurements were extracted. A random forest model was developed using these QCT features to differentiate between the two groups. The model's performance was assessed using area under the receiver operating characteristic curve (AUC-ROC). Correlations between QCT parameters and pulmonary function tests were analyzed.
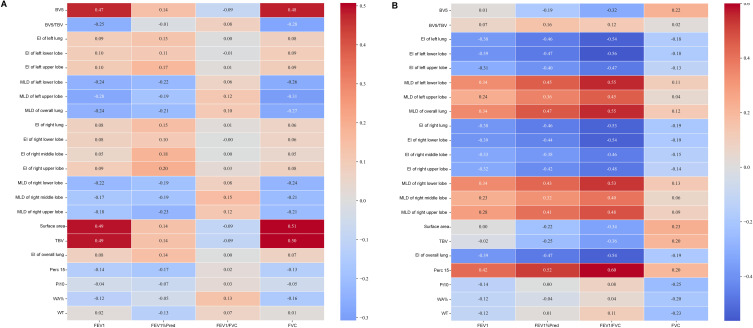
Results: The model achieved an AUC-ROC of 0.97 (95% CI: 0.96-0.99) in differentiating emphysema from emphysema-dominant COPD. Emphysema index and airway wall thickness were the most important features for classification. QCT-derived emphysema index showed strong negative correlation with FEV1/FVC (ρ = -0.54, p<0.001) in the emphysema-dominant COPD group, but no significant correlation in the emphysema group (ρ = 0.001, p=0.993). Mean lung density was significantly lower in the emphysema-dominant COPD group compared to the isolated emphysema group (p<0.001).
Conclusion: Machine learning analysis of QCT features can accurately differentiate emphysema from emphysema-dominant COPD. The differing relationships between QCT parameters and lung function in these two groups suggest distinct pathophysiological processes. These findings may contribute to improved diagnosis, phenotyping, and management strategies in emphysema and COPD.
Keywords: chronic obstructive pulmonary disease; computed tomography; emphysema; emphysema-dominant COPD; quantitative computed tomography.
© 2025 Guo et al.
Conflict of interest statement
The authors declare no competing interests.
Figures


Similar articles
-
Phenotypes and Trajectories of Tobacco-exposed Persons with Preserved Spirometry: Insights from Lung Volumes.Ann Am Thorac Soc. 2025 Apr;22(4):494-505. doi: 10.1513/AnnalsATS.202405-527OC. Ann Am Thorac Soc. 2025. PMID: 39586032
-
Comparing Heterogenous Phenotypes of Chronic Obstructive Pulmonary Disease: Network Analysis and Penalized Generalized Linear Model.Int J Chron Obstruct Pulmon Dis. 2025 Apr 28;20:1267-1277. doi: 10.2147/COPD.S496199. eCollection 2025. Int J Chron Obstruct Pulmon Dis. 2025. PMID: 40322199 Free PMC article.
-
Sensitivity and specificity of various lung function parameters recommended for phenotyping COPD in clinical practice.Respir Med. 2025 Sep;246:108256. doi: 10.1016/j.rmed.2025.108256. Epub 2025 Jul 12. Respir Med. 2025. PMID: 40659254
-
CT densitometry in emphysema: a systematic review of its clinical utility.Int J Chron Obstruct Pulmon Dis. 2018 Feb 7;13:547-563. doi: 10.2147/COPD.S143066. eCollection 2018. Int J Chron Obstruct Pulmon Dis. 2018. PMID: 29445272 Free PMC article.
-
Lung volume reduction surgery for diffuse emphysema.Cochrane Database Syst Rev. 2016 Oct 14;10(10):CD001001. doi: 10.1002/14651858.CD001001.pub3. Cochrane Database Syst Rev. 2016. PMID: 27739074 Free PMC article.
References
-
- Adeloye D, Song P, Zhu Y, Campbell H, Sheikh A, Rudan I. Global, regional, and national prevalence of, and risk factors for, chronic obstructive pulmonary disease (COPD) in 2019: a systematic review and modelling analysis. Lancet Respir Med. 2022;10(5):447–458. doi: 10.1016/S2213-2600(21)00511-7 - DOI - PMC - PubMed
Publication types
MeSH terms
LinkOut - more resources
Full Text Sources
Medical
