. 2025 May 27;47(4):576-592.
doi: 10.1016/j.pld.2025.05.010. eCollection 2025 Jul.

Phylogenomic insights into Adenophora and its allies (Campanulaceae): Revisiting generic delimitation and hybridization dynamics

Affiliations

Phylogenomic insights into Adenophora and its allies (Campanulaceae): Revisiting generic delimitation and hybridization dynamics

Xiao-Hua Lin et al. Plant Divers. .

Abstract

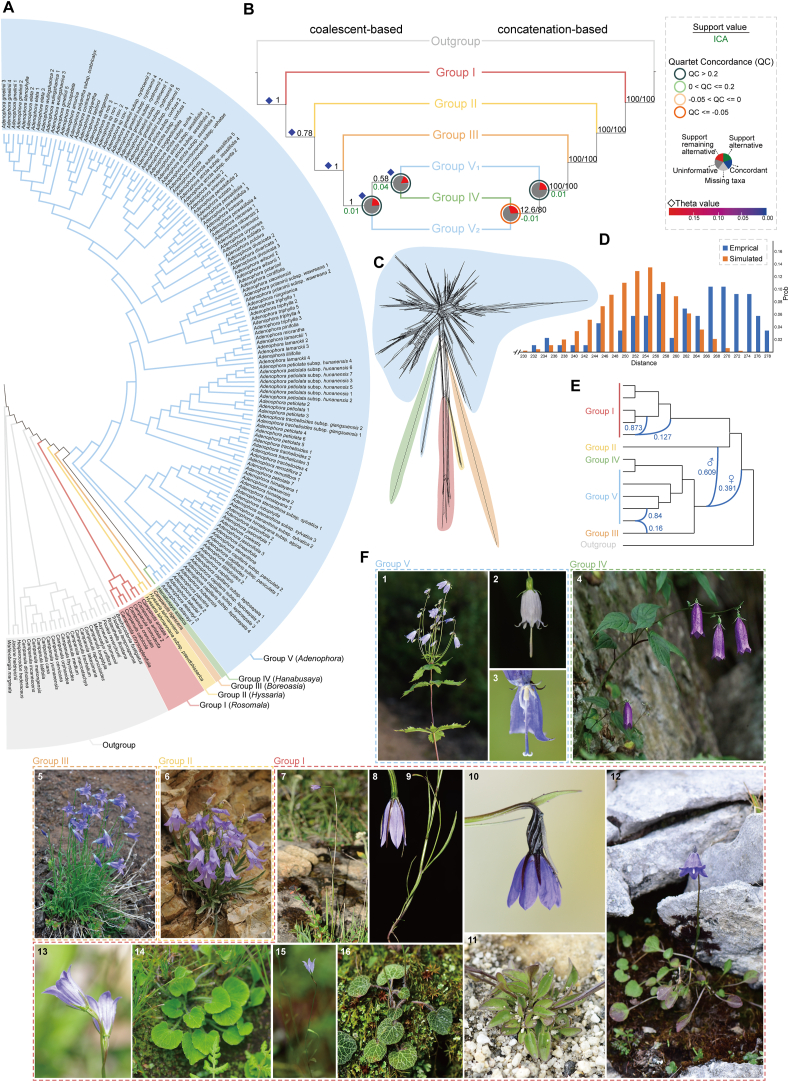
Hybridization and introgression have long obscured relationships within Adenophora and its relatives, complicating generic delimitation. Leveraging deep genome skimming (DGS) data, we generated a large dataset, including thousands of single-copy nuclear (SCN) genes and plastomes, to untangle this reticulate history. Specifically, 9.89 terabytes (TB) of DGS data from 165 samples-representing 48 species and 13 subspecies of Adenophora (out of ca. 72 species) plus 24 outgroup species-yielded 1506 SCN genes and 77 plastid coding sequences. Tree-like phylogenies inferred with both coalescent- and concatenation-based methods revealed pronounced gene tree heterogeneity. Subsequent analysis showed that incomplete lineage sorting contributed minimally to this discordance; instead, hybridization and introgression were the primary drivers of early diversification. Integrating phylogenomic, morphological, and geographic evidence, we propose a revised generic framework for this group. Adenophora is expanded to include Campanula delavayi and the Korean Peninsula endemic genus Hanabusaya. We also recommend reinstating Hyssaria as a distinct Central Asian genus and introducing two new genera, Boreoasia and Rosomala.

Keywords: Campanula; Hanabusaya; Network; Polyphyly; Reticulation; Taxonomy.


Conflict of interest statement

The authors declare that they have no known competing financial interests or personal relationships that could have appeared to influence the work reported in this paper.

Figures

Fig. 1
Fig. 1
Comparison of phylogenetic hypotheses for the five major groups of Adenophora and its allies. A) Parsimony tree based on the nuclear ribosomal Internal Transcribed Spacer (nrITS) region (Eddie et al., 2003). B) Maximum Parsimony tree inferred from the plastid petD gene (Mansion et al., 2012). C) Maximum Likelihood tree derived from 15 plastid loci (atpB-rbcL spacer, atpB, atpF, atpF-atpH spacer, atpH, matK, ndhF, pbsA-trnH spacer, pbsA-trnK spacer, petD, rbcL, rpoC1, trnL-trnF spacer, trnT-trnL spacer, and trnV-trnK spacer) and nrITS (Crowl et al., 2016). D) Maximum Likelihood tree based on the single-copy nuclear gene PPR70 (Yoo et al., 2018). E) Maximum Likelihood or Bayesian tree inferred from six plastid regions (atpB-rbcL, matK, petD intron, rbcL, rpl16, and trnL-trnF; Xu and Hong, 2021). Font colors correspond to the five groups recognized in the present study; “Adenophora 1–4” collectively represent Group V2.
Fig. 2
Fig. 2
Phylogenomic analysis for elucidating the reticulation of Adenophora and its allies. A) Species tree of Adenophora and its allies in the framework of tribe Campanuleae, inferred from ASTRAL-III using 1243 orthologs from the nuclear 1to1 dataset. B) Comparative visualization of conflicting topologies from different datasets and inference methods. The left side shows a coalescent-based species tree, while the right side presents a concatenation-based tree derived from the nuclear gene dataset. The gray dashed box in the upper right corner provides a legend for the graphical elements and parameter annotations used in the figure, including node support values, quartet concordance (QC) scores, pie charts from phyparts analysis, and population mutation parameter (theta, θ) values inferred from Mutation Calculation based on Coalescent Model (MuCCo) analysis. Phylogenetic support for the focal nodes is shown next to the branches, including Local Posterior Probabilities (LPP) from ASTRAL-III (e.g., 0.58; labeled in black) and SH-aLRT support and UFBoot values estimated from IQ-TREE2 (e.g., 100/100; labeled in black; see Figs. S4 and S5 for details). ICA scores (see Figs. S11 and S14 for details) are labeled in green. Pie charts on the nodes represent the following data: the proportion of gene trees that support that clade (blue), the proportion that supports the main alternative bipartition (green), the proportion that supports the remaining alternatives (red), the proportion (conflict or support) that have less than 50% BS (dark grey), and the proportion that have missing taxa (light grey) (details refer to Figs. S10 and S13). The color surrounding the pie charts indicates the range of QC, where QC > 0.2 is painted in dark green, 0 < QC ≤ 0.2 is painted in light green, −0.05 < QC ≤ 0 is painted in yellow, and QC ≤ −0.05 is painted in red. The schematic tree was adapted from the tree based on the nuclear 1to1 dataset, with values inferred from this dataset (see Figs. S12 and S15 for details). Theta values are shown above the branches as colored diamonds (see Fig. S22 for details). C) Supernetwork inferred with SplitsTree based on single-copy nuclear genes (SCN genes) from the 1to1 dataset, with parallelograms indicating incongruences among SCN genes (see Fig. S16 for details). D) Distribution of tree-to-tree distances between empirical gene trees and the ASTRAL species tree, compared to distances from coalescent simulations. E) Phylogenetic network analysis of the 14-taxa sampling of Adenophora and its allies. Blue curved branches indicate possible hybridization events, with corresponding inheritance probabilities marked beside the branches. F) Representative species of five major groups (Groups I–V) within Adenophora and its allies, highlighting their morphological diversity and habitat. 1A. tetraphylla; 2A. capillaris; 3A. himalayana (showing the disk); 4Hanabusaya asiatica (note the absence of basal leaves); 5Campanula rigescens (exhibiting an elevated plant stature and lanceolate to linear leaves); 6Hyssaria lehmanniana subsp. capusii (exhibiting a dwarf growth habit and adaptive traits to arid environments); 79C. aristata; 10 and 11C. immodesta; 12C. crenulata; 13 and 14C. calcicola; 15 and 16C. chrysosplenifolia (7–16: showing the unique morphology of basal and cauline leaves about Group I). Photo credits: Yao Zhou (1); Ren-Bin Zhu (2); Xin–Xin Zhu (3, 7, 8, 9, 10, 11, 12, 15, 16); http://www.wildplant.kr/(4); https://www.plantarium.ru/(5); https://www.inaturalist.org/(6); Hong Jiang (13, 14).
Fig. 3
Fig. 3
Plastid phylogeny of Adenophora and its allies. A) The plastid CDSs-based backbone in the framework of tribe Campanuleae inferred from IQ-TREE2. The legends for the graphical elements and parameter annotations used in the figure are provided in the bottom left corner, including node support values, quartet concordance (QC) scores, and pie charts from phyparts analysis. Phylogenetic supports of the focal nodes from trees are presented next to the branch. The SH-aLRT support and UFBoot estimated from IQ-TREE2 (e.g., 97.5/100) and the Bootstrap support (BS) from RAxML (e.g., 99) (details refer to Figs. S17 and S18; labeled in black), asterisks (∗) indicates full support (e.g., 100/100; 100); ICA scores (details refer to Fig. S20; labeled in green). Pie charts on the nodes represent the following data: the proportion of gene trees that support that clade (blue), the proportion that supports the main alternative bipartition (green), the proportion that supports the remaining alternatives (red), the proportion (conflict or support) that have less than 50% BS (dark grey), and the proportion that have missing taxa (light grey) (details refer to Fig. S19). The color of the circle around the pie chart represents the value range of QC, where QC > 0.2 is painted in dark green, 0 < QC ≤ 0.2 is painted in light green, −0.05 < QC ≤ 0 is painted in yellow, and QC ≤ −0.05 is painted in red (details refer to Fig. S21). B) Represented species of Adenophora and its allies (Groups I–V), indicating the morphological diversity and habitat. 1, 6,7A. himalayana; 2A. hubeiensis; 3A. liliifolioides; 4A. coelestis; 5A. stenanthina; 8A. pereskiifolia; 9A. morrisonensis; 10 and 11A. gmelinii; 12A. stenophylla; 13A. palustris; 14A. lamarckii; 15A. liliifolia; 16A. trachelioides; 17A. remotiflora; 18A. ningxianica; 19A. triphylla; 20A. pinifolia; 21A. potaninii; 22 and 23A. delavayi; 24 and 25A. takedai; 26Hyssaria lehmanniana subsp. capusii; 27Campanula rigescens; 28Hanabusaya asiatica; 29C. chrysosplenifolia; 30C. immodesta. Photo credits: Xin–Xin Zhu (1, 4, 7, 9, 21, 22, 23, 29, 30); Wei Du (2); Jian-Jun Zhou (3); Bing Liu (5, 16); Xiang Liu (6); You-Sheng Chen (8); De-Chang Meng (10, 11); Li-Guang Sun (12); Yao Zhou (13, 17); You-Pai Zeng (14, 15); Ren-Bin Zhu (18, 19); Xin-Tang Ma (20); Tian-Cheng Ji (24); http://flowers.la.coocan.jp/(25); https://www.inaturalist.org/(26); https://www.plantarium.ru/(27); http://www.wildplant.kr/(28).
Fig. 4
Fig. 4
Gene flow between Adenophora and its allies. Heatmap showing statical support for gene flow between pairs of species inferred from Dsuite package. The shaded scale in boxes represents the estimated f4-ratio branch value.
Fig. 5
Fig. 5
Fine structure of Adenophora petiolata, a representative species in Adenophora. A) Roots and stems. B) Branches and leaves. C) Inflorescence. D) Flower bud cut longitudinally. E) Corolla longitudinal section. F) Calyx lobes. G) Corolla tube longitudinal section. H) Pistil and stamen. I) Stamen. J) Pistil. K) Nectary disk. L) Ovary transverse section. — Photos: Bin-Jie Ge.

Similar articles

Cited by

References

    1. APG IV An update of the Angiosperm Phylogeny Group classification for the orders and families of flowering plants: APG IV. Bot. J. Linn. Soc. 2016;181:1–20. doi: 10.1111/boj.12385. - DOI
    1. Bankevich A., Nurk S., Antipov D., et al. SPAdes: a new genome assembly algorithm and its applications to single-cell sequencing. J. Comput. Biol. 2012;19:455–477. doi: 10.1089/cmb.2012.0021. - DOI - PMC - PubMed
    1. Bolger A.M., Lohse M., Usadel B. Trimmomatic: a flexible trimmer for Illumina sequence data. Bioinformatics. 2014;30:2114–2120. doi: 10.1093/bioinformatics/btu170. - DOI - PMC - PubMed
    1. Borowiec M.L. Spruceup: fast and flexible identification, visualization, and removal of outliers from large multiple sequence alignments. J. Open Source Softw. 2019;4:1635. doi: 10.21105/joss.01635. - DOI
    1. Borowiec M.L. AMAS: a fast tool for alignment manipulation and computing of summary statistics. PeerJ. 2016;4 doi: 10.7717/peerj.1660. - DOI - PMC - PubMed

LinkOut - more resources