. 2025 Jun 23;9(1):e148.
doi: 10.1017/cts.2025.10057. eCollection 2025.

Comparing methods for glomerular filtration rate estimation

Affiliations

Comparing methods for glomerular filtration rate estimation

Xiaoqian Zhu et al. J Clin Transl Sci. .

Abstract

Background: The glomerular filtration rate (GFR), estimated from serum creatinine (SCr), is widely used in clinical practice for kidney function assessment, but SCr-based equations are limited by non-GFR determinants and may introduce inaccuracies across racial groups. Few studies have evaluated whether advanced modeling techniques enhance their performance.

Methods: Using multivariable fractional polynomials (MFP), generalized additive models (GAM), random forests (RF), and gradient boosted machines (GBM), we developed four SCr-based GFR-estimating equations in a pooled data set from four cohorts (n = 4665). Their performance was compared to that of the refitted linear regression-based 2021 CKD-EPI SCr equation using bias (median difference between measured GFR [mGFR] and estimated GFR [eGFR]), precision, and accuracy metrics (e.g., P10 and P30, percentage of eGFR within 10% and 30% of mGFR, respectively) in a pooled validation data set from three additional cohorts (n = 2215).

Results: In the validation data set, the greatest bias and lowest accuracy, were observed in Black individuals for all equations across subgroups defined by race, sex, age, and eGFR. The MFP and GAM equations performed similarly to the refitted CKD-EPI SCr equation, with slight improvements in P10 and P30 in subgroups including Black individuals and females. The GBM and RF equations demonstrated smaller biases, but lower accuracy compared to other equations. Generally, differences among equations were modest overall and across subgroups.

Conclusions: Our findings suggest that advanced methods provide limited improvement in SCr-based GFR estimation. Future research should focus on integrating novel biomarkers for GFR estimation and improving the feasibility of GFR measurement.

Keywords: GFR; equation; estimation; performance; serum creatinine.


Conflict of interest statement

KCN is a Kidney Disease Quality Improvement Consultant for Atlantis Health, Inc.

Figures

Figure 1.
Figure 1.
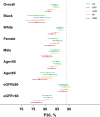
Bias of equations overall and by subgroups in the external validation data set. Shows the bias of all equations overall and across subgroups. The dots are point estimates and the horizontal lines are 95% confidence intervals. The vertical dashed line represents the unbiased reference line, with estimates closer to 0 indicating better performance. eGFR based on the 2021 CKD-EPI SCr equation was used to define the subgroups with eGFR < 60 ml/min/1.73 m2 and eGFR ≥ 60 ml/min/1.73 m2. Note: Bias was defined as the median of the differences between mGFR and eGFR for each individual in the sample (mGFR minus eGFR); GFR = glomerular filtration rate; eGFR = estimated GFR; mGFR = measured GFR; CKD-EPI = Chronic Kidney Disease Epidemiology Collaboration; SCr = serum creatinine; LM = the refitted 2021 CKD-EPI SCr equation using a linear regression model; MFP = the equation based on the multivariable fractional polynomial model; GAM = the equation based on the generalized additive model; RF = the equation based on random forests; GBM = the equation based on gradient boosted machines.
Figure 2.
Figure 2.
P10 of equations overall and by subgroups in the external validation data set. Shows accuracy measured by P10 of all equations overall and across subgroups. The dots are point estimates and the horizontal lines are 95% confidence intervals. The vertical reference line is positioned at the highest P10 value across all equations, with estimates closer to 100 indicating higher accuracy. eGFR based on the 2021 CKD-EPI SCr equation was used to define the subgroups with eGFR < 60 ml/min/1.73 m2 and eGFR ≥ 60 ml/min/1.73 m2. Note: P10 is the percentage of eGFRs within 10% of mGFR; GFR = glomerular filtration rate; eGFR = estimated GFR; mGFR = measured GFR; CKD-EPI = Chronic Kidney Disease Epidemiology Collaboration; SCr = serum creatinine; LM = the refitted 2021 CKD-EPI SCr equation using a linear regression model; MFP = the equation based on the multivariable fractional polynomial model; GAM = the equation based on the generalized additive model; RF = the equation based on random forests; GBM = the equation based on gradient boosted machines.
Figure 3.
Figure 3.
P30 of equations overall and by subgroups in the external validation data set. Shows accuracy measured by P30 of all equations overall and across subgroups; the dots are point estimates and the horizontal lines are 95% confidence intervals. The vertical reference line is positioned at the highest P30 value across all equations, with estimates closer to 100 indicating greater accuracy. eGFR based on the 2021 CKD-EPI SCr equation was used to define the subgroups with eGFR < 60 ml/min/1.73 m2 and eGFR ≥ 60 ml/min/1.73 m2. Note: P30 is the percentage of eGFRs within 30% of mGFR; GFR = glomerular filtration rate; eGFR = estimated GFR; mGFR = measured GFR; CKD-EPI = Chronic Kidney Disease Epidemiology Collaboration; SCr = serum creatinine; LM = the refitted 2021 CKD-EPI SCr equation using a linear regression model; MFP = the equation based on the multivariable fractional polynomial model; GAM = the equation based on the generalized additive model; RF = the equation based on random forests; GBM = the equation based on gradient boosted machines.
Figure 4.
Figure 4.
Comparison of 95% prediction intervals of mGFR among all equations in the external validation data set. Vertical lines represent prediction intervals of the new equations, with each equation represented by a different color. The numbers near the caps of vertical lines show the 2.5th and 97.5th percentiles of mGFR at given eGFR values. Symbols (arrows and dots) on the vertical lines identify the 25th and 75th percentiles, and median of mGFR at given eGFR values. The interpretation is that at a given eGFR, 95% of mGFRs range from the 2.5th to 97.5th percentiles. Similarly, 50% of mGFRs range from the 25th to 75th percentiles. For each equation, the percentile values of mGFR are obtained from separate quantile regression models (at the 2.5th, 25th, median, 75th, and 97.5th percentiles, respectively) of mGFR on eGFR. Note: GFR = glomerular filtration rate; eGFR = estimated GFR; mGFR = measured GFR; CKD-EPI = Chronic Kidney Disease Epidemiology Collaboration; SCr = serum creatinine; LM = the refitted 2021 CKD-EPI SCr equation using a linear regression model; MFP = the equation based on the multivariable fractional polynomial model; GAM = the equation based on the generalized additive model; RF = the equation based on random forests; GBM = the equation based on gradient boosted machines.

Similar articles

References

    1. Delgado C, Baweja M, Crews DC, et al. A unifying approach for GFR estimation: recommendations of the NKF-ASN task force on reassessing the inclusion of race in diagnosing kidney disease. Am J Kidney Dis. 2022;79(2):268–288.e1. doi: 10.1053/j.ajkd.2021.08.003. - DOI - PubMed
    1. Kashani K, Rosner MH, Ostermann M. Creatinine: from physiology to clinical application. Eur J Intern Med. 2020;72:9–14. doi: 10.1016/j.ejim.2019.10.025. - DOI - PubMed
    1. Tio MC, Shafi T, Zhu X, Kalantar-Zadeh K, Chan A, Nguyen L. Traditions and innovations in assessment of glomerular filtration rate using creatinine to cystatin C. Curr Opin Nephrol Hypertens. 2023;32(1):89–97. doi: 10.1097/mnh.0000000000000854. - DOI - PMC - PubMed
    1. Inker LA, Eneanya ND, Coresh J, et al. New creatinine- and cystatin C-based equations to estimate GFR without race. New Engl J Med. 2021;385(19):1737–1749. doi: 10.1056/NEJMoa2102953. - DOI - PMC - PubMed
    1. Lousa I, Reis F, Beirão I, Alves R, Belo L, Santos-Silva A. New potential biomarkers for chronic kidney disease management-a review of the literature. Int J Mol Sci. 2020;22(1):1–43. doi: 10.3390/ijms22010043. - DOI - PMC - PubMed