

Whole-brain functional connectivity predicts regional tau PET in preclinical Alzheimer's disease
- PMID: 40735265
- PMCID: PMC12305425
- DOI: 10.1093/braincomms/fcaf274
Whole-brain functional connectivity predicts regional tau PET in preclinical Alzheimer's disease
Abstract
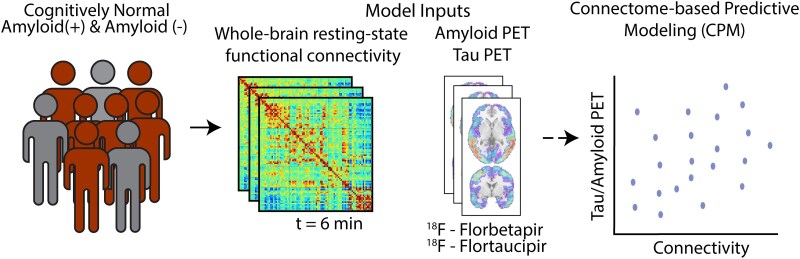
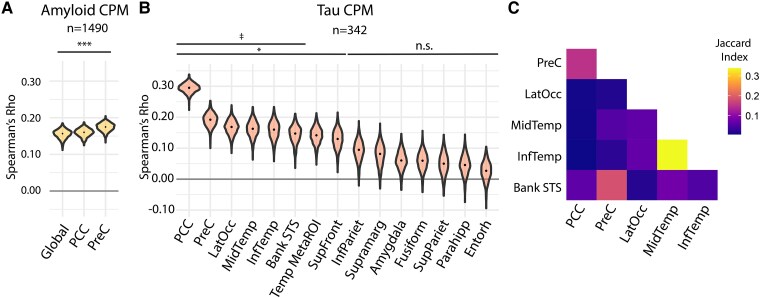
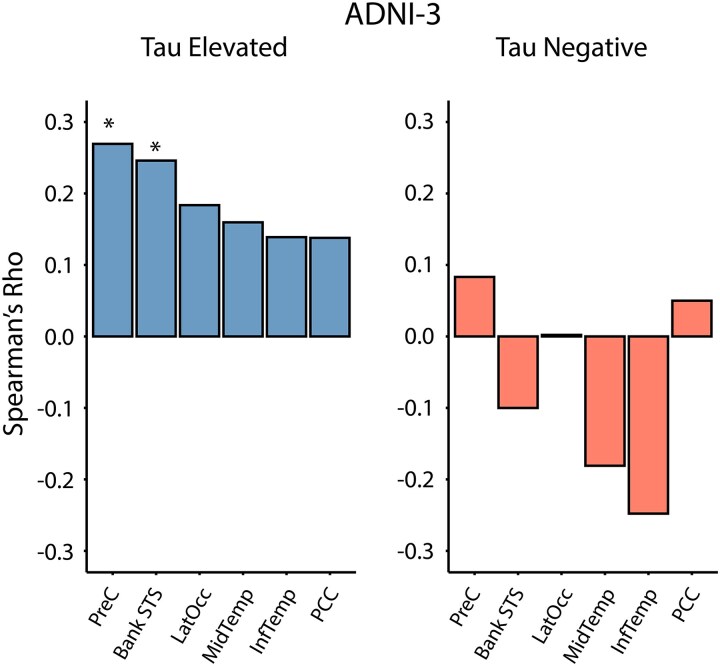
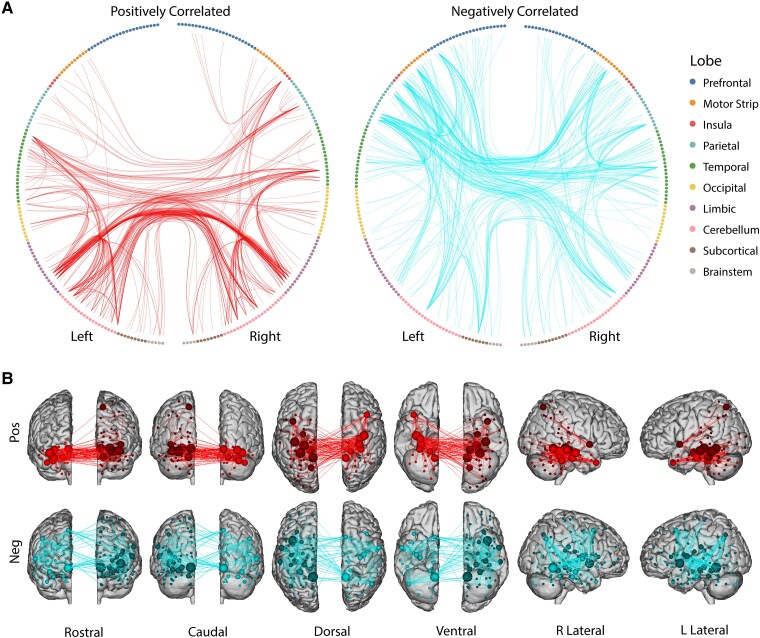
Preclinical Alzheimer's disease, characterized by the abnormal accumulation of amyloid-β prior to cognitive symptoms, presents a critical opportunity for early intervention. Past work has described functional connectivity (FC) changes in preclinical Alzheimer's disease, yet the predictive nature between the functional connectome and Alzheimer's disease pathology during this window remains unexplored. We applied connectome-based predictive modelling to investigate the ability of resting-state whole-brain FC to predict tau (18F-flortaucipir) and amyloid-β (18F-florbetapir) PET binding in preclinical Alzheimer's disease (A4, n = 342 amyloid-β-positive, age 65-85). Separate models were developed to predict amyloid PET signal in the posterior cingulate, precuneus, and cortical composite regions, and to predict tau PET signal in each of 14 cortical regions that demonstrated meaningful tau elevation as identified through a Gaussian mixture model approach. Model performance was assessed using a Spearman's correlation between predicted and observed PET binding standard uptake value ratios. We assessed the validity of significant models by applying them to an external dataset and visualized the underlying connectivity that was positively and negatively correlated to regional tau. We found that whole-brain FC predicts regional tau PET, outperforming FC-amyloid-β PET models. The best-performing tau models were for regions affected in Braak stage IV-V regions (posterior cingulate, precuneus, lateral occipital cortex, middle temporal, inferior temporal, and banks of the superior temporal sulcus), while models for regions of earlier tau pathology (entorhinal, parahippocampal, fusiform, and amygdala) performed poorly. Importantly, FC-based models predicted tau PET signal in the Alzheimer's Disease Neuroimaging Intitative-3 dataset (amyloid-β-positive, n = 211, age 55-90) in tau-elevated but not tau-negative individuals. For the posterior cingulate tau model, the most accurate model in A4, the predictive edges positively correlated with posterior cingulate tau predominantly came from nodes within temporal, limbic, and cerebellar regions. The most predictive edges negatively associated with tau were from nodes of heteromodal association areas, particularly within the prefrontal and parietal cortices. These findings reveal that whole-brain FC meaningfully predicts tau PET in preclinical Alzheimer's disease, particularly in regions affected in advanced disease, and are relevant across the Alzheimer's disease clinical spectrum in individuals with elevated tau PET burden. This suggests that functional connectivity, likely in conjunction with other factors, may play a key role in early processes that facilitate later-stage tau spread. These models highlight the potential of the functional connectome for the early detection and monitoring of Alzheimer's disease pathology, especially in later-stage target regions.
Keywords: asymptomatic; dementia; machine learning; multimodal; neurodegeneration.
© The Author(s) 2025. Published by Oxford University Press on behalf of the Guarantors of Brain.
Conflict of interest statement
The authors declare no conflicts of interest.
Figures
Update of
-
Whole-brain functional connectivity predicts regional tau PET in preclinical Alzheimer's disease.bioRxiv [Preprint]. 2025 Mar 25:2024.04.02.587791. doi: 10.1101/2024.04.02.587791. bioRxiv. 2025. Update in: Brain Commun. 2025 Jul 15;7(4):fcaf274. doi: 10.1093/braincomms/fcaf274. PMID: 38617320 Free PMC article. Updated. Preprint.
Similar articles
-
Whole-brain functional connectivity predicts regional tau PET in preclinical Alzheimer's disease.bioRxiv [Preprint]. 2025 Mar 25:2024.04.02.587791. doi: 10.1101/2024.04.02.587791. bioRxiv. 2025. Update in: Brain Commun. 2025 Jul 15;7(4):fcaf274. doi: 10.1093/braincomms/fcaf274. PMID: 38617320 Free PMC article. Updated. Preprint.
-
Comparison of tau spread in people with Down syndrome versus autosomal-dominant Alzheimer's disease: a cross-sectional study.Lancet Neurol. 2024 May;23(5):500-510. doi: 10.1016/S1474-4422(24)00084-X. Lancet Neurol. 2024. PMID: 38631766 Free PMC article.
-
Divergent Cortical Tau Positron Emission Tomography Patterns Among Patients With Preclinical Alzheimer Disease.JAMA Neurol. 2022 Jun 1;79(6):592-603. doi: 10.1001/jamaneurol.2022.0676. JAMA Neurol. 2022. PMID: 35435938 Free PMC article.
-
CSF tau and the CSF tau/ABeta ratio for the diagnosis of Alzheimer's disease dementia and other dementias in people with mild cognitive impairment (MCI).Cochrane Database Syst Rev. 2017 Mar 22;3(3):CD010803. doi: 10.1002/14651858.CD010803.pub2. Cochrane Database Syst Rev. 2017. PMID: 28328043 Free PMC article.
-
18F PET with florbetapir for the early diagnosis of Alzheimer's disease dementia and other dementias in people with mild cognitive impairment (MCI).Cochrane Database Syst Rev. 2017 Nov 22;11(11):CD012216. doi: 10.1002/14651858.CD012216.pub2. Cochrane Database Syst Rev. 2017. PMID: 29164603 Free PMC article.
References
-
- Thal DR, Rüb U, Orantes M, Braak H. Phases of Aβ-deposition in the human brain and its relevance for the development of AD. Neurology. 2002;58(12):1791–1800. - PubMed
-
- Braak H, Braak E. Neuropathological stageing of Alzheimer-related changes. Acta Neuropathol. 1991;82(4):239–259. - PubMed
-
- Braak H, Thal DR, Ghebremedhin E, Del Tredici K. Stages of the pathologic process in Alzheimer disease: Age categories from 1 to 100 years. J Neuropathol Exp Neurol. 2011;70(11):960–969. - PubMed
Grants and funding
LinkOut - more resources
Full Text Sources
Miscellaneous