. 2025 Jul 25:18:9967-9988.
doi: 10.2147/JIR.S525114. eCollection 2025.

Disulfidptosis-Related Genes as Novel Biomarkers and Therapeutic Targets in Dilated Cardiomyopathy

Affiliations

Disulfidptosis-Related Genes as Novel Biomarkers and Therapeutic Targets in Dilated Cardiomyopathy

Xiaohong Bo et al. J Inflamm Res. .

Abstract

Background: Dilated cardiomyopathy (DCM) is a severe cardiac condition characterized by ventricular dilation and impaired systolic function, leading to heart failure and sudden death. Current treatments have limited efficacy in reversing disease progression. Recent research suggests that disulfidptosis, a novel cell death mechanism, may play a role in DCM pathogenesis, though its specific involvement remains unclear.

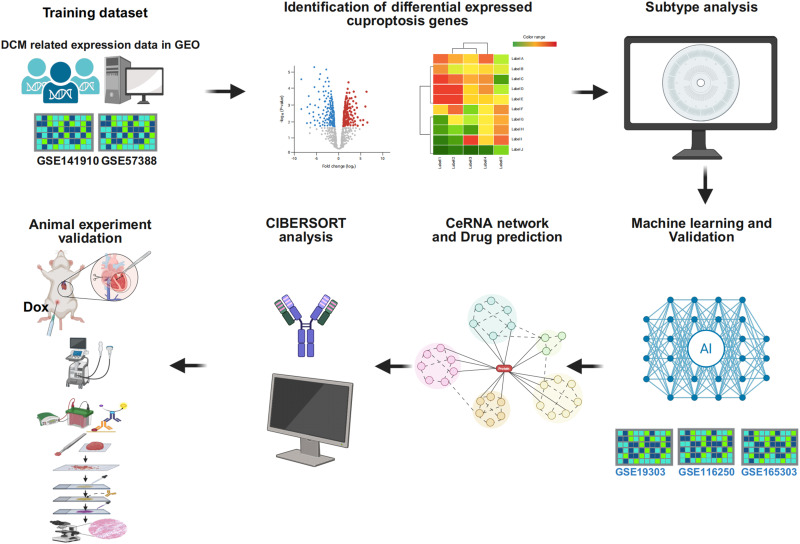
Methods: This study utilized multiple GEO datasets to analyze the expression of 24 disulfidptosis-related genes (DiGs) in DCM patients and healthy controls. Differential expression analysis and consensus clustering were used to classify DCM patients into subgroups based on DiGs expression profiles. A predictive model was constructed using four machine learning methods, and its performance was validated with independent datasets. A ceRNA regulatory network was established, and in vivo experiments were conducted using a DCM mouse model to validate key findings.

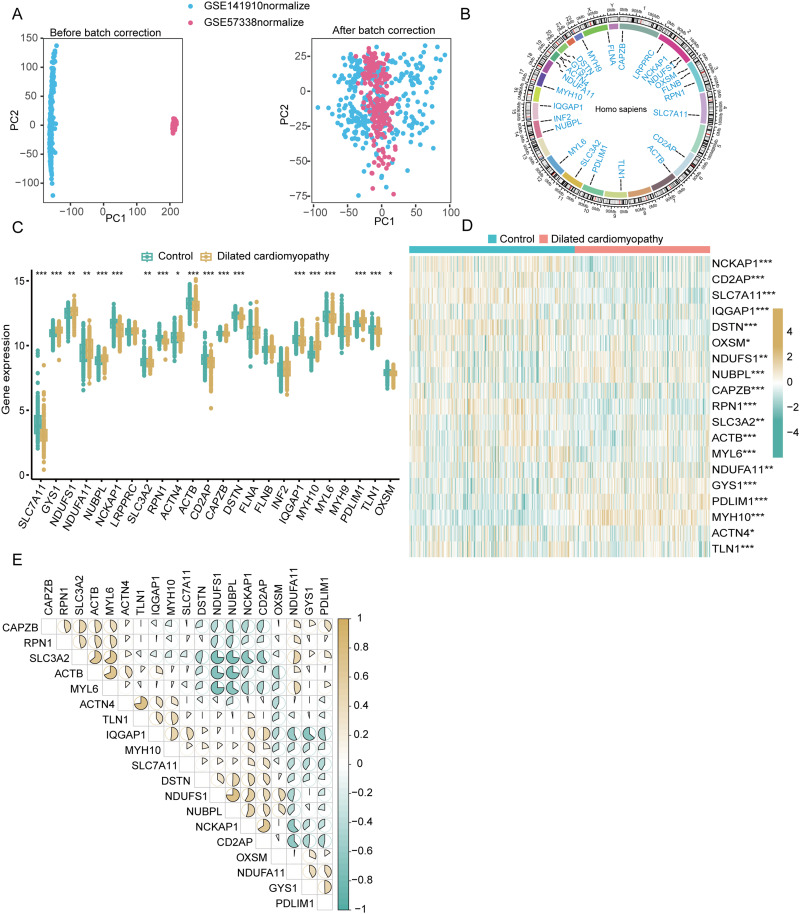
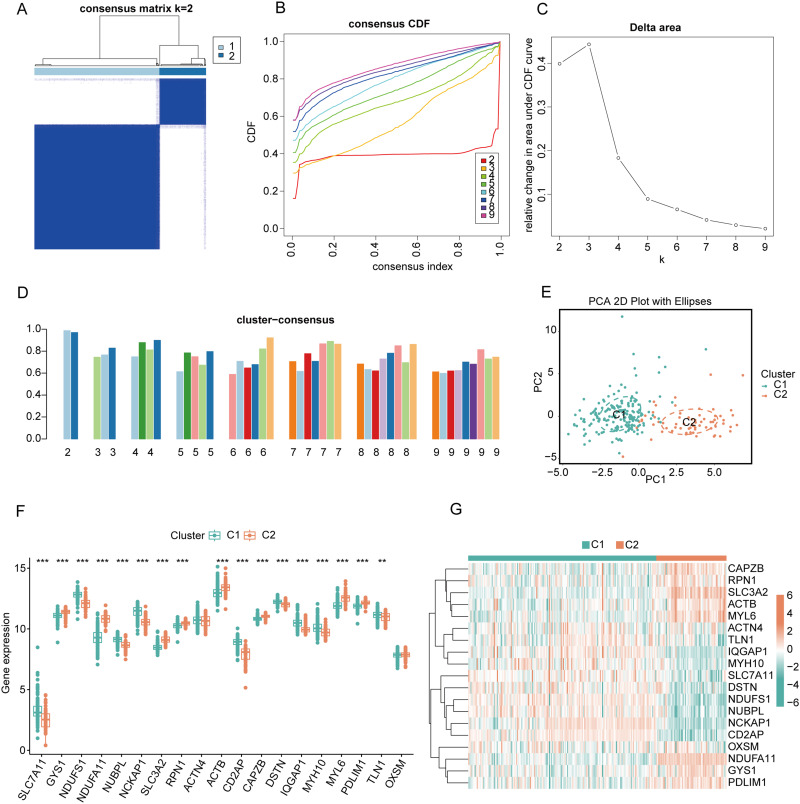
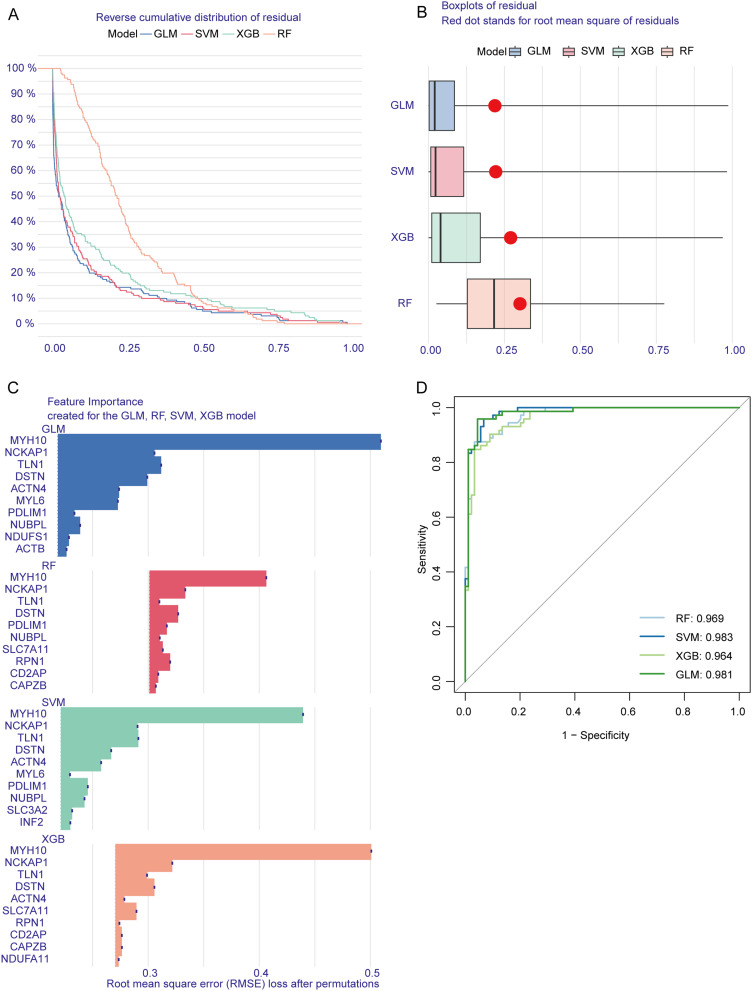
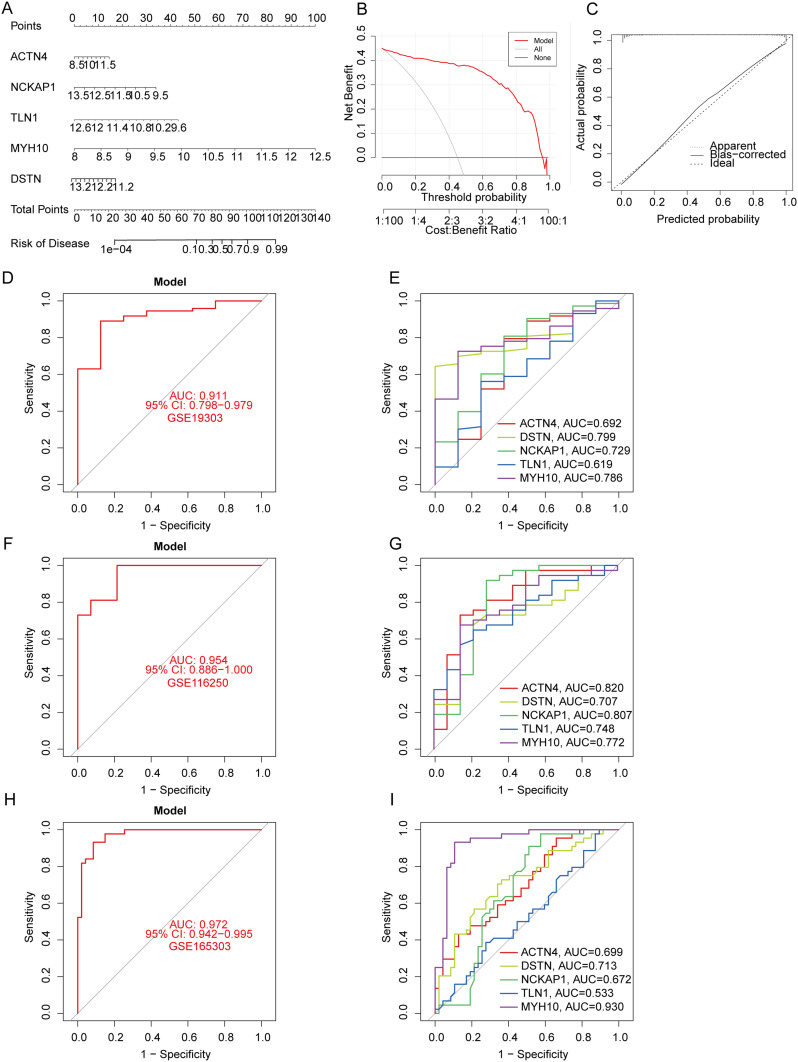
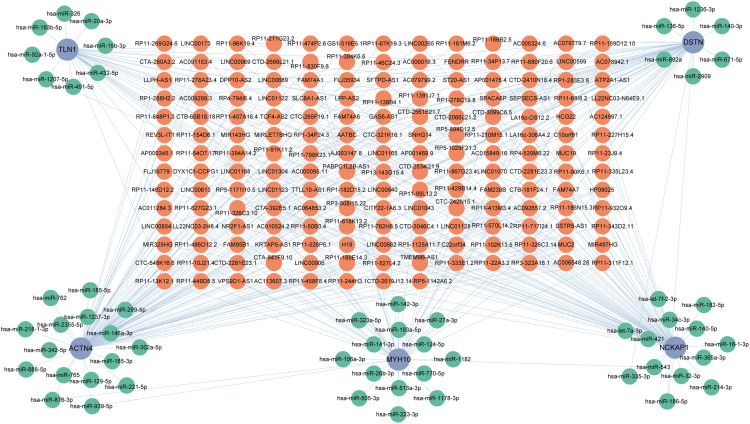
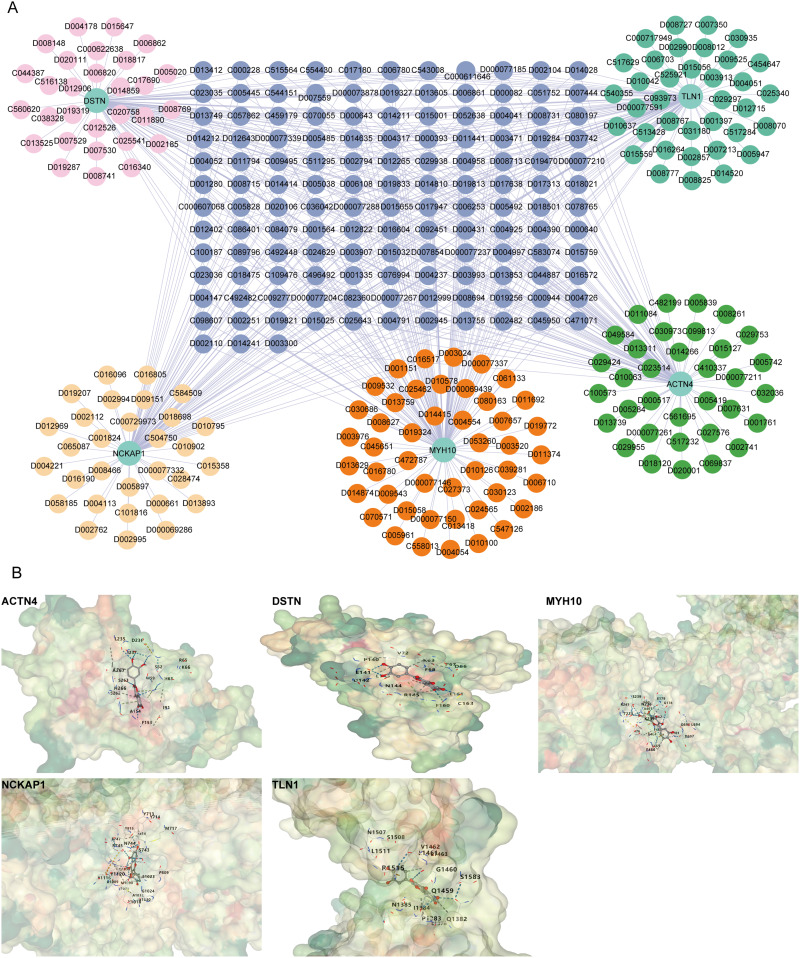
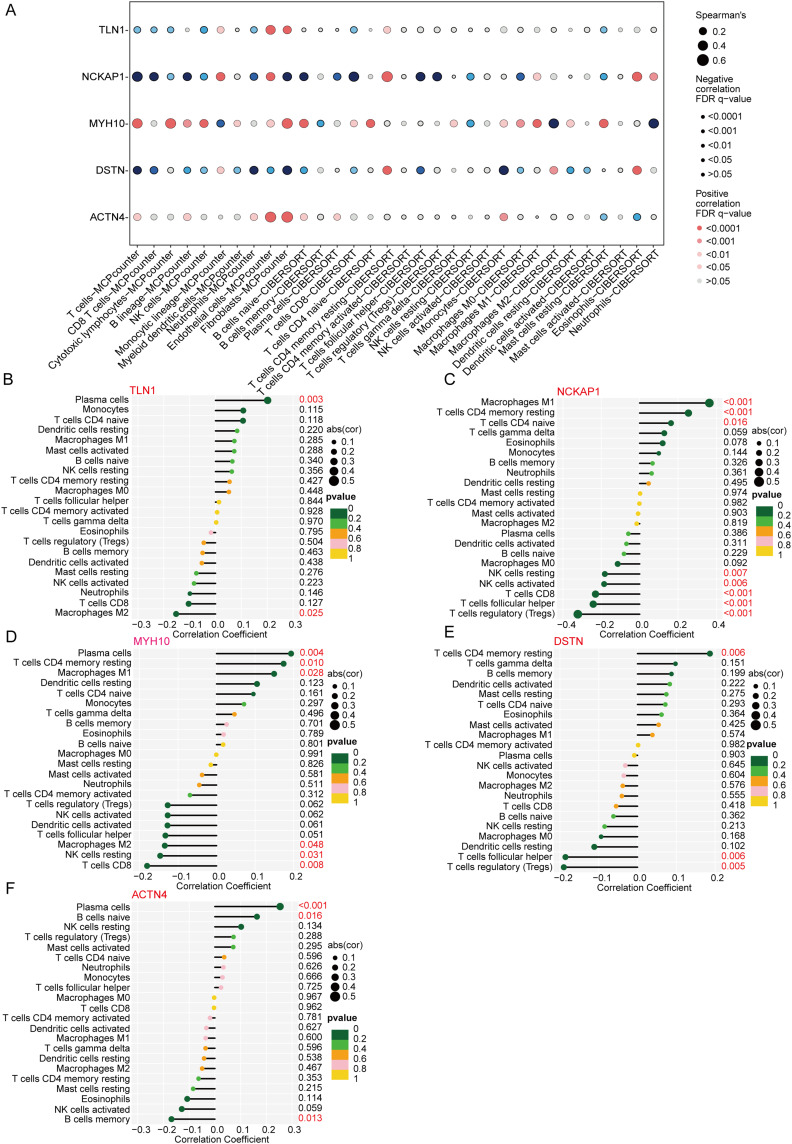
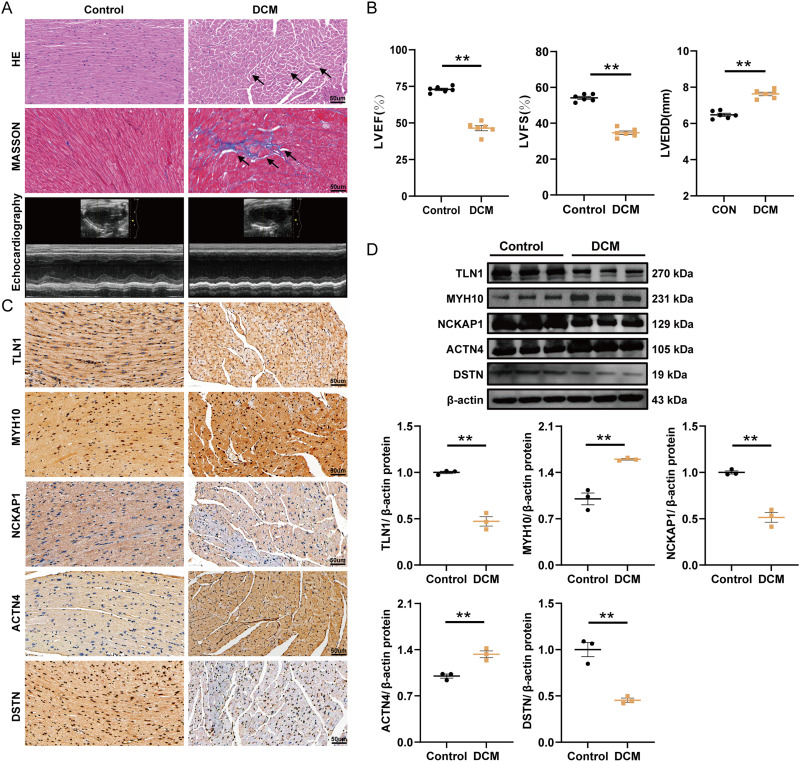
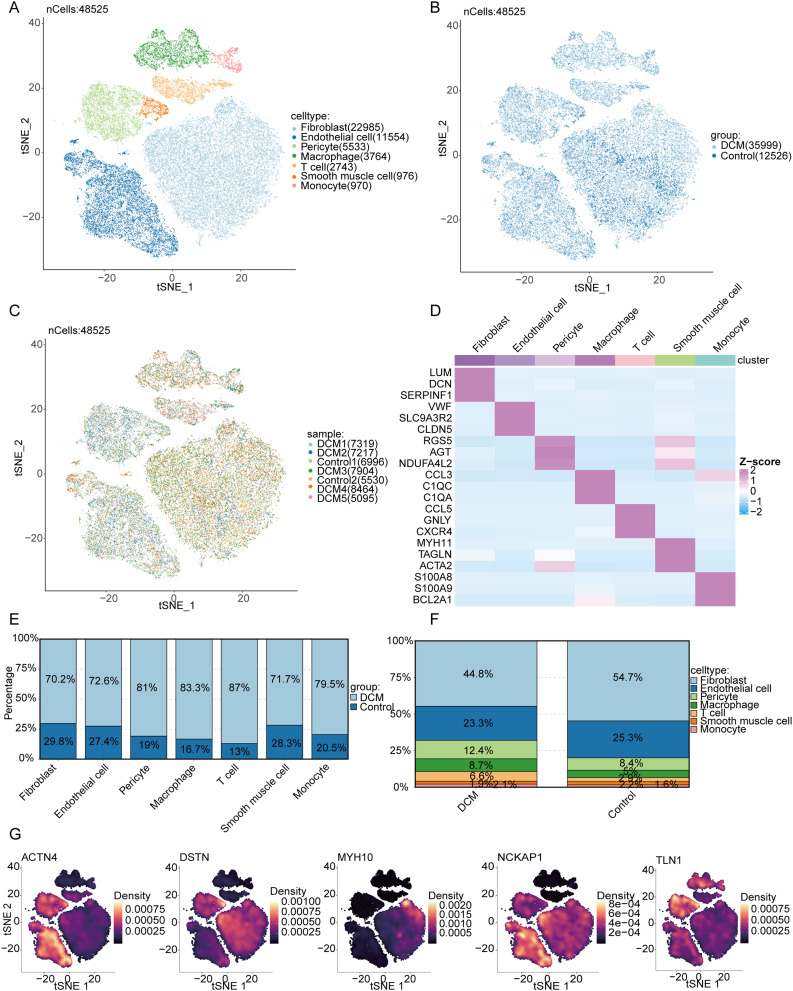
Results: Nineteen DiGs were differentially expressed between DCM and controls. Consensus clustering divided DCM patients into two subtypes with distinct immune profiles. The support vector machine (SVM) model demonstrated superior diagnostic performance (AUC = 0.983), identifying ACTN4, MYH10, TLN1, DSTN, and NCKAP1 as core predictors. In vivo validation confirmed their expression changes in myocardial tissue. Single-cell RNA-seq further revealed increased fibroblast and macrophage infiltration in DCM, along with enrichment of fibrotic and immune pathways. Quercetin and resveratrol were predicted as potential drugs targeting these core genes.

Conclusion: This study demonstrates that ACTN4, MYH10, TLN1, DSTN, and NCKAP1 play significant roles in the pathogenesis of DCM, influencing immune cell infiltration and metabolic homeostasis. Quercetin and resveratrol were identified as potential therapeutic agents, offering new directions for DCM treatment.

Keywords: diagnostic model; dilated cardiomyopathy; disulfidptosis-related genes; immune cell infiltration.


Conflict of interest statement

The authors declare that they have no competing interests.

Figures

Figure 1
Figure 1
The study design.
Figure 2
Figure 2
Differential expression and interaction analysis of disulfidptosis-related genes (DiGs) in dilated cardiomyopathy (DCM) patients. (A) Principal component analysis (PCA) plots before (left) and after (right) batch correction of GSE141910 (blue) and GSE57338 (pink) datasets. (B) Circos plot showing chromosomal distribution and copy number variations (CNVs) of 24 DiGs across 23 chromosomes. (C) Boxplot of 24 DiGs expression levels in control (green) and DCM (yellow) groups, with significant differences indicated by asterisks (*p < 0.05, **p < 0.01, ***p < 0.001). (D) Heatmap of 19 differentially expressed DiGs in control and DCM samples. Red indicates upregulation, blue indicates downregulation (*p < 0.05, **p < 0.01, ***p < 0.001). (E) Correlation matrix of the 19 DiGs, with positive (blue) and negative (brown) correlations shown by ellipse size and shape.
Figure 3
Figure 3
Consensus clustering and differential expression analysis of DiGs in DCM patients. (A) Consensus matrix heatmap showing the optimal clustering of DCM patients into two clusters (k = 2). (B) Cumulative distribution function (CDF) curves for different numbers of clusters (k = 2 to 9) based on consensus clustering. (C) Delta area plot showing the relative change in area under the CDF curve for k = 2 to 9, indicating k = 2 as the optimal number of clusters. (D) Bar plot of the cluster consensus score for different k values, demonstrating stable clustering at k = 2. (E) Principal component analysis (PCA) plot showing the separation between Cluster 1 (C1, green) and Cluster 2 (C2, Orange) based on DiGs expression. (F) Boxplot comparing the expression levels of 24 DiGs between Cluster 1 (C1, green) and Cluster 2 (C2, orange). Significant differences are marked with asterisks (**p < 0.01, ***p < 0.001). (G) Heatmap of the 19 differentially expressed DiGs between C1 and C2.
Figure 4
Figure 4
Model performance and feature importance analysis for predicting DCM using different machine learning methods. (A) Reverse cumulative distribution of residuals for four models—generalized linear model (GLM), support vector machine (SVM), extreme gradient boosting (XGB), and random forest (RF). (B) Boxplot showing residual distribution across the four models. (C) Feature importance analysis for the top predictive genes across the four models. (D) Receiver operating characteristic (ROC) curves compare the models’ diagnostic performance.
Figure 5
Figure 5
Validation and performance evaluation of the predictive model for DCM using independent datasets. (A) Nomogram integrating five core genes (ACTN4, NCKAP1, TLN1, MYH10, DSTN) to predict DCM risk. (B) Decision curve analysis (DCA) assessing the clinical utility of the model. (C) Calibration curve comparing predicted probabilities with actual outcomes. (D and E) ROC curves for the predictive model and individual core genes using the GSE19303 dataset. (F and G) ROC curves for the predictive model and individual core genes using the GSE116250 dataset. (H and I) ROC curves for the predictive model and individual core genes using the GSE165303 dataset.
Figure 6
Figure 6
Construction of the ceRNA regulatory network for core DiGs in DCM. The ceRNA network illustrates the interactions between lncRNAs, miRNAs, and mRNAs associated with five core genes (TLN1, DSTN, ACTN4, MYH10, NCKAP1). Orange nodes represent lncRNAs, green nodes represent miRNAs, and blue nodes represent mRNAs.
Figure 7
Figure 7
Drug-gene interaction network and molecular docking analysis of quercetin with core target proteins in DCM. (A) Drug-gene interaction network for five core genes (TLN1, DSTN, ACTN4, MYH10, NCKAP1). (B) Molecular docking models showing the binding interactions between quercetin and the core proteins ACTN4, DSTN, MYH10, NCKAP1, and TLN1.
Figure 8
Figure 8
Correlation analysis between core disulfidptosis-related genes and immune cell infiltration in DCM. (A) Dot plot showing the correlation between the expression levels of five core genes (TLN1, NCKAP1, MYH10, DSTN, ACTN4) and various immune cell types. The size and color of the dots represent the strength and direction of the correlation, respectively. (BF) Correlation coefficients of immune cell types with the expression of TLN1 (B), NCKAP1 (C), MYH10 (D), DSTN (E), and ACTN4 (F). Positive and negative correlations are represented, and p-values indicate the significance of these associations.
Figure 9
Figure 9
Histological, echocardiographic, and protein expression analysis of core genes in control and DCM mouse models. (A) Representative images of hematoxylin-eosin (HE) staining, Masson’s trichrome staining, and echocardiography in control and DCM groups. (B) Echocardiographic assessment of left ventricular ejection fraction (LVEF), fractional shortening (LVFS), and left ventricular end-diastolic diameter (LVEDD) in control and DCM groups (mean ± SD, n=6, **p≤ 0.01). (C) Immunohistochemical staining of TLN1, MYH10, NCKAP1, ACTN4, and DSTN in myocardial tissue from control and DCM groups (37.5X). (D) Typical bands of proteins in the Western blot experiment (mean ± SD, n=3, **p≤ 0.01).
Figure 10
Figure 10
Single-cell transcriptomic analysis of cardiac tissues from DCM and control groups. (A) t-SNE plot showing clustering of 48,525 cardiac cells colored by cell type, identifying seven distinct cell populations. (B) t-SNE plot of the same cells colored by disease group (DCM vs Control). (C) t-SNE plot colored by individual sample origin. (D) Heatmap of representative marker genes across cell types. (E) Bar plots comparing the proportions of each cell type between DCM and control groups. (F) Overall cellular composition differences between DCM and control hearts. (G) Density plots of structural genes (ACTN4, DSTN, MYH10, NCKAP1, TLN1) projected on the t-SNE map, indicating spatial expression patterns.

Similar articles

References

    1. Stephane H, Neal KL, Carsten T, Karin K. Dilated cardiomyopathy: causes, mechanisms, and current and future treatment approaches. Lancet. 2023;402(10406):998–1011. - PubMed
    1. Vissing C, Espersen K, Mills H, et al. Family Screening in Dilated Cardiomyopathy: prevalence, Incidence, and Potential for Limiting Follow-Up. JACC Heart Fail. 2022;10(11):792–803. doi: 10.1016/j.jchf.2022.07.009 - DOI - PubMed
    1. Weintraub RG, Semsarian C, Macdonald P. Dilated cardiomyopathy. Lancet. 2017;390(10092):400–414. doi: 10.1016/S0140-6736(16)31713-5 - DOI - PubMed
    1. Eldemire R, Mestroni L, Taylor MRG. Genetics of Dilated Cardiomyopathy. Annu Rev Med. 2024;75(1):417–426. doi: 10.1146/annurev-med-052422-020535 - DOI - PMC - PubMed
    1. Japp A, Gulati A, Cook S, Cowie M, Prasad S. The Diagnosis and Evaluation of Dilated Cardiomyopathy. J Am Coll Cardiol. 2016;67(25):2996–3010. doi: 10.1016/j.jacc.2016.03.590 - DOI - PubMed

LinkOut - more resources