. 2025 Jul 28;7(8):e70025.
doi: 10.1096/fba.2024-00161. eCollection 2025 Aug.

Single-Cell RNA Sequencing Reveals the Critical Role of SEC16B in Lung Metastasis of Osteosarcoma

Affiliations

Single-Cell RNA Sequencing Reveals the Critical Role of SEC16B in Lung Metastasis of Osteosarcoma

Shangyu Liu et al. FASEB Bioadv. .

Abstract

Osteosarcoma (OS) is highly malignant and easily prone to lung metastasis. The mechanisms of lung metastasis in OS remain unclear. The single-cell RNA sequencing (scRNA-seq) samples in this study included six primary osteosarcoma samples (published in-house data), two lung metastasis samples (GSE152048), and four normal bone tissue samples (GSE169396). To identify potential targets for metastasis, bulk RNA sequencing data from four primary tumors and four lung metastases (in-house data) were also analyzed. scRNA-seq identified five tumor cell subpopulations. CytoTRACE and lung metastasis scores indicated that the C1 subpopulation was most closely associated with lung metastasis. By intersecting lung metastasis-related genes identified via hdWGCNA analysis with differentially expressed genes from bulk RNA sequencing, SEC16B was identified as the key gene influencing lung metastasis. qRT-PCR results revealed that SEC16B expression was significantly downregulated in OS cell lines. Transwell assay demonstrated that overexpression of SEC16B significantly inhibited the invasion and migration capabilities of OS cells. Additionally, analyses using Scissor, CellphoneDB, and CSOmap suggested that fibroblasts, endothelial cells, and OS cells in the tumor microenvironment formed a pre-metastatic niche through mechanisms involving angiogenesis and extracellular matrix remodeling. Overall, this study identifies a new population that may promote lung metastasis by downregulating SEC16B in OS. Moreover, fibroblasts and endothelial cells in the tumor microenvironment play a critical role in OS lung metastasis.

Keywords: lung metastasis; osteosarcoma; single‐cell transcriptomics; tumor microenvironment.


Conflict of interest statement

The authors declare no conflicts of interest.

Figures
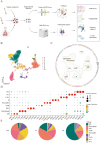
FIGURE 1
FIGURE 1
Single‐cell characterization of OS lung metastasis. (A) Schematic of the study design. OS patients with and without lung metastasis were included, and primary tumor samples were collected for scRNA‐seq and bulk RNA‐seq analysis. In vitro experiments were performed to validate the results. Image created with Biorender.com. (B, C) UMAP plots display the clustering of different cell types from four normal bone tissues and eight OS tissues (B), along with cell type annotation (C). Cells are color‐coded according to the annotated cell types. (D) Bubble plot showing marker genes defining different cell types. Bubble size indicates the percentage of gene expression within each cell type, while the color represents the average expression level of each gene. (E) Pie charts illustrating the proportion of different cell types in normal bone tissue (NM), primary osteosarcoma (PT), and lung metastasis (ML) samples.
FIGURE 2
FIGURE 2
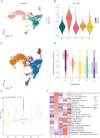
Multi‐angle screening of OS subpopulations associated with lung metastasis. (A) UMAP plot of OS subpopulations, color‐coded by their respective clusters. (B) Violin plot displaying the lung metastasis scores of the five OS subpopulations. (C) ScRNA‐seq velocity analysis simulating the differentiation trajectories of the OS subpopulations. (D) CytoTRACE scores predicting the stem cell‐like properties of OS subpopulations. (E) Comparison of CNV scores across different OS subpopulations (Kruskal–Wallis test). (F) GSVA functional analysis demonstrating the functional differences among OS subpopulations.
FIGURE 3
FIGURE 3
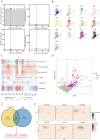
Identification of target genes involved in OS lung metastasis. (A, B) Parameter settings for hdWGCNA analysis. The optimal soft threshold was set at 10 (A). Thirteen modules (M1–M13) were visualized with different colors, displaying distinct gene expression patterns within each module (B). (C) Heatmap showing the correlation between the 13 gene modules in C1 cells and various cell characteristics (e.g., percent.mt, nFeature_RNA, nCount_RNA, S phase score, G2M phase score) as well as lung metastasis characteristics. The color bar indicates the strength and direction of the correlation, with red representing a positive correlation and blue representing a negative correlation. Asterisks denote statistical significance: *p < 0.05, **p < 0.01, ***p < 0.001. (D) Volcano plot displaying the DEGs in C1 cells between the ML group and the PT group. (E) Venn diagram showing the overlap of downregulated genes identified by hdWGCNA and differential analysis from bulk RNA‐seq data. (F) Expression distribution of the SEC16B, APELA, and FAM50B genes in PT and ML samples. Gene expression levels are indicated by color intensity, with darker colors representing higher expression and lighter colors indicating lower expression. Areas with higher cell density are shown in dark red.
FIGURE 4
FIGURE 4
Functional validation of target genes through in vitro experiments. (A) RT‐PCR analysis showing the relative expression levels of the SEC16B gene in OB and various OS cell lines across three groups. (B, C) Transwell assays demonstrating the effect of SEC16B overexpression (oe‐SEC16B) on the migratory and invasive abilities of 143B and HOS OS cells. (D, E) Quantitative analysis of the effect of SEC16B overexpression (oe‐SEC16B) on the migratory and invasive abilities of 143B and HOS OS cells. SEC16B overexpression significantly inhibited the migration of both 143B and HOS cells, with a marked reduction in the number of migratory cells compared to the control group (NC). (F, G) SEC16B overexpression also significantly inhibited the invasion of both 143B and HOS cells, with a significant decrease in the number of invasive cells compared to the control group (NC). Asterisks indicate statistical significance: *p < 0.05, **p < 0.01, ***p < 0.001, ****p < 0.0001.
FIGURE 5
FIGURE 5
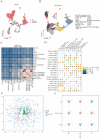
Promotion of lung metastasis by the cellular communication network in the OS TME. (A) Scissor analysis showing the distribution of cell populations associated with OS lung metastasis. Red indicates Scissor‐positive populations, which are positively correlated with lung metastasis, while gray represents Scissor‐negative populations, which are negatively correlated with lung metastasis. (B) UMAP dimensional reduction analysis revealing different cell subpopulations and their markers. (C) Heatmap generated by CellphoneDB displaying the intensity of intercellular interactions. (D) Interaction patterns of key signaling pathways between ECs, LUM_CAFs, MCAM_CAFs, and C1 cells. The color intensity represents the scaled means of expression for the ligands and receptors across different cell types, while the size of the circles indicates the significance of the interactions. Red outlines highlight significant interactions, emphasizing their potential relevance in the TME. (E) CSOmap scatter plot analyzing intercellular interactions, showing the spatial distribution of ECs, LUM_CAFs, and C1 cells in the same dimension. (F) Quantification of interaction modes among ECs, LUM_CAFs, and C1 cells. Red represents positive correlations, and blue represents negative correlations. A q < 0.05 indicates interactions through direct cell–cell contact, while q > 0.05 indicates interactions mediated by the secretion of cytokines.
FIGURE 6
FIGURE 6
Mechanisms of TME remodeling promoting OS lung metastasis. (A) UMAP analysis showing the distribution of CAFs subpopulations. B. Bubble plot displaying the classic marker genes defining CAFs subpopulations. (C, D) Bubble plots representing ligand‐receptor interactions within the cellular communication network. C shows the interactions between LUM_CAFs and other cell types, while D shows the interactions between MCAM_CAFs and other cell types. (E, F) GSEA analysis illustrating the functional enrichment of LUM_CAFs (E) and MCAM_CAFs (F). (G) Cell–cell communication between ECs and other cell types. (H) Cellular communication between LUM_CAFs, MCAM_CAFs, ECs, and C1 cells via the PPIA‐BSG signaling axis. The red arcs represent the strength of the PPIA‐BSG signaling pathway interactions between the different cell types.

Similar articles

References

    1. Si Z., Shen Z., Luan F., and Yan J., “PINK1 Regulates Apoptosis of Osteosarcoma as the Target Gene of Cisplatin,” Journal of Orthopaedic Surgery and Research 18 (2023): 132. - PMC - PubMed
    1. Beird H. C., Bielack S. S., Flanagan A. M., et al., “Osteosarcoma,” Nature Reviews Disease Primers 8 (2022): 77. - PubMed
    1. Pilavaki P., Gahanbani Ardakani A., Gikas P., and Constantinidou A., “Osteosarcoma: Current Concepts and Evolutions in Management Principles,” Journal of Clinical Medicine 12 (2023): 2785. - PMC - PubMed
    1. Wang J., Li M., Guo P., and He D., “Correction: Survival Benefits and Challenges of Adjuvant Chemotherapy for High‐Grade Osteosarcoma: A Population‐Based Study,” Journal of Orthopaedic Surgery and Research 18 (2023): 834. - PMC - PubMed
    1. Singh I., Rainusso N., Kurenbekova L., et al., “Intrinsic Epigenetic State of Primary Osteosarcoma Drives Metastasis,” bioRxiv [Preprint], November 13, 2023. - PubMed

LinkOut - more resources