. 2025 Apr 25;2(3):100107.
doi: 10.1016/j.bneo.2025.100107. eCollection 2025 Aug.

Targeting HASPIN kinase disrupts SR protein-mediated RNA splicing and synergizes with BCL-2 inhibitor venetoclax in AML

Affiliations

Targeting HASPIN kinase disrupts SR protein-mediated RNA splicing and synergizes with BCL-2 inhibitor venetoclax in AML

Mengdan Liu et al. Blood Neoplasia. .

Abstract

Acute myeloid leukemia (AML) is a blood cancer complicated by acquired drug resistance, disease relapse, and low overall survival rates. Combination therapies using multiple targeted inhibitors have been effective in treating patients with AML. However, combination treatments are limited by the number of usable targets and our ability to create rational pairings using complimentary molecular mechanisms. Here, we used a human kinase domain-targeted CRISPR screen to identify histone H3-associated protein (HASPIN) kinase as a significant, understudied dependency in AML. HASPIN depletion significantly reduced growth rate, induced a cell cycle arrest, and dysregulated transcription in AML. A proteomics data mining study characterized serine and arginine repeat enriched splicing factors (SR proteins) as a major category of HASPIN kinase substrates and highlighted the role of HASPIN as a splicing regulatory kinase. Accordingly, HASPIN depletion strongly dysregulated splicing in AML cells. HASPIN inhibitor CHR-6494 effectively reduced cell viability across AML subtypes while sparing healthy cells. Furthermore, a novel combination therapy consisting of CHR-6494 and B-cell lymphoma 2 (BCL-2) inhibitor venetoclax synergistically reduced AML cell viability and resensitized venetoclax-resistant AMLs to treatment. Our study presents HASPIN kinase as a novel therapeutic target for AML, underscores an underappreciated role of HASPIN in splicing regulation, and proposes a viable combination treatment for clinical testing.


Conflict of interest statement

Conflict-of-interest disclosure: The authors declare no competing financial interests.

Figures

None
Graphical abstract
Figure 1.
Figure 1.
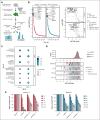
A kinase domain–targeted CRISPR screen identifies HASPIN as a novel dependency in AML cells. (A) Schematic of human kinase domain–targeted CRISPR screen in 2 t(8;21) AML cell lines, Kasumi-1 and SKNO-1. (B) Gene rank plots (left) and volcano plots (right) depicting significant kinase hits in the kinase domain–targeted CRISPR screens. Top candidates determined by CRISPR score as calculated by MAGeCK robust ranking aggregation (RRA) (left) and a log2(fold change) ≤−1.0 and false discovery rate (FDR) ≤0.05 significance cutoff (right). White diamonds indicate top 10 kinase hits in each plot. (C) Bubble plot of preranked gene set enrichment analysis results performed on top kinases identified by CRISPR screen in Kasumi-1 and SKNO-1 AML cell lines. Fill color indicates normalized enrichment score (NES). Size indicates significance by –log10(FDR). Facets indicate Molecular Signatures Database (MSigDB) gene set collection. (D) Density plot of all individual sgRNA log2(fold change) values in the kinase domain–targeted library. For selected genes, log2(fold change) values of corresponding sgRNAs depicted for Kasumi-1 and SKNO-1 cell lines relative to all other library sgRNAs (red, blue, and gray, respectively). (E) Competitive proliferation assay of Kasumi-1 or SKNO-1 cells expressing nontargeting negative control, RPA3-targeting positive control, or 1 of 2 HASPIN-targeting sgRNAs derived from CRISPR screen. Relative changes in cell proliferation rate measured by percentage of GFP-positive cells relative to nontargeting control on each day. Data are mean ± standard deviation (SD) of 4 independent experiments. CGP, chemical, genetic perturbation; CP, canonical pathway.
Figure 2.
Figure 2.
HASPIN depletion reduces AML proliferation, induces cell cycle arrest, and dysregulates oncogenic transcription. (A) Western blot analysis of HASPIN and β-actin (loading control) in Kasumi-1 cells expressing either nontargeting control (C), or 1 of 2 unique HASPIN-targeting shRNAs (1 and 2). Data are mean ± SD of 3 independent experiments. Representative blot revealed. Significance determined by 1-way analysis of variance (ANOVA) with Holm-Sidak method for multiple comparison correction. ∗∗∗∗P < .0001; ∗∗∗P < .001. (B) Growth curve of Kasumi-1 cells expressing either nontargeting control or 1 of 2 unique HASPIN-targeting shRNAs. Data on curve are mean ± SD of technical triplicates. Representative curve of 3 independent experiments. Significance of day 8 determined by 2-way ANOVA with Holm-Sidak method for multiple comparison correction. ∗∗∗P < .001. (C) Cell cycle analysis of Kasumi-1 cells expressing either nontargeting control or 1 of 2 unique HASPIN-targeting shRNAs. Data are mean ± SD of 4 independent experiments. Significance determined by 2-way ANOVA with Holm-Sidak method for multiple comparison correction. ∗∗∗∗P < .0001. (D) Volcano plot of genes differentially expressed on HASPIN depletion in Kasumi-1 cells. Differentially expressed genes were determined using DESeq2. Points represent genes. Genes meeting a |log2(fold change)| ≥1.0 and Benjamini-Hochberg adjusted P value ≤.05 cutoff (dotted lines) are considered significant and colored red. Nonsignificant genes are colored gray. (E) Selected gene set enrichment analysis plots of genes differentially expressed on HASPIN depletion. NES, FDR q value, and P value are indicated within each plot. shControl, control shRNA; shHASPIN, HASPIN-targeting shRNA.
Figure 3.
Figure 3.
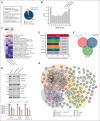
Integrated data mining characterizes HASPIN as a potential splicing regulatory kinase. (A) Schematic depicting integration of 2 proteomics data sets (Maiolica et al and Johnson et al36) to assign HASPIN specificity scores to residues differentially phosphorylated on semispecific HASPIN inhibition. (B) Histogram of HASPIN percentile scores for 3845 differential phosphosites reported by Maiolica et al that mapped to the serine/threonine kinase substrate atlas by Johnson et al. Y-axis is the number of phosphosites with HASPIN percentile scores within indicated histogram bucket range. X-axis is histogram bucket ranges corresponding to substrate atlas HASPIN percentile scores. Colored brackets indicate top deciles of HASPIN substrates. (C) Heat map depicting gene ontology (GO) enrichment for proteins belonging to 70th, 80th, and 90th HASPIN substrate percentiles correspond to bracketed bins in panel B. GO terms and percentiles were grouped by hierarchical clustering as indicated by column and row dendrograms. Cell color represents –log10(P value) for corresponding GO term enrichment. (D) Western blot analysis of phospho-SR, total SR, and α-tubulin (loading control) in Kasumi-1 cells expressing either nontargeting control or 1 of 2 unique HASPIN-targeting shRNAs. SRSF6, SRSF5, and SRSF2 are labeled according to size. Bar plot quantifies the ratio of phosphorylated SR protein signal to total SR protein signal where both values are normalized to respective loading controls and presented as values relative to the control condition. Representative blot of 3 independent experiments revealed. Data are mean ± SD of 3 independent experiments. Significance determined by 2-way ANOVA with Holm-Sidak correction for multiple comparison testing. ∗P < .05; ∗∗P < .01; ∗∗∗P < .001; ∗∗∗∗P < .0001. (E) Bar plot depicting the fraction of RNA splicing-related HASPIN substrates that are also predicted substrates for indicated splicing regulatory kinases. A total of 229 phosphosites corresponding to RNA splicing proteins enriched in panel C were analyzed. Substrates with >90% kinase percentile score for both HASPIN and indicated kinase were considered mutual or shared targets. Colored and gray areas represent percent of shared or exclusive substrates, respectively. (F) Venn diagram depicting overlap of proteins belonging to experimentally validated HASPIN-interactor data (Maiolica et al and BIOGRID) and inferred 90th percentile HASPIN kinase substrates. (G) STRING-DB protein-protein interaction network of experimentally validated HASPIN interacting proteins and inferred 90th percentile HASPIN kinase substrates. Nodes are proteins. Edges are STRING relationships at the highest confidence level (STRING confidence score >0.900). Node color indicates data origin. Inferred 90th percentile HASPIN substrate proteins are colored blue. HASPIN interacting proteins from affinity mass spectrometry data as reported by Maiolica et al are colored red. Curated HASPIN interacting proteins from the BIOGRID database are colored green. Colored ellipses represent prominent GO term enriched in nodes contained within. RNA splicing enrichments are colored in orange. Transcription enrichments are colored in purple. Cell cycle enrichments are colored in yellow. A total of 84 singleton nodes are hidden.
Figure 4.
Figure 4.
HASPIN depletion dysregulates RNA splicing in AML. (A) Bar plot revealing replicate multivariate analysis of transcript sequences quantification of significant splicing events induced on shRNA-mediated HASPIN depletion in Kasumi-1 cells. Major splicing patterns (left) are as follows: A3SS, alternative 3′ splice site; A5SS, alternative 5′ splice site; MXE, mutually exclusive exon; RI, retained intron; SE, skipped exon. Events that had at least 50 junction-spanning reads, FDR ≤0.05, and absolute delta percent spliced in (|dPSI|) ≥0.10 were considered significant. (B) Heat map depicting GO enrichments of significantly spliced events for splicing pattern. Terms and event type were grouped by hierarchical clustering as indicated by column and row dendrograms. Cell color represents –log10(P value) for corresponding GO term enrichment. (C) Venn diagram of genes with differential alternative splicing events (DAS genes) and genes with differential expression (DE genes) on HASPIN depletion in Kasumi-1 cells. Intersection represents genes that are both DAS and DE on HASPIN depletion. Significant splicing events or differentially expressed genes were overlapped based on respective cutoffs. (D) Proportional bar plots reporting changes between transcript functional biotypes in significant splicing events of each pattern on HASPIN depletion in Kasumi-1 cells. Notation is “Initial:Final.” Each color corresponds with a transition between biotypes. Transcript biotypes assigned according to ENSEMBL transcriptome annotation. “Unannotated” indicates that the transcript was not located in the annotation database. (E) Sashimi plot (left) and reverse transcription polymerase chain reaction (RT-PCR) validation (right) of BCL2L11 SE events observed on HASPIN depletion in Kasumi-1 cells. Sashimi plot depicts change in mean percent spliced in (PSI) levels of target exons between control (blue) and HASPIN knockdown (red) in Kasumi-1 cells. Inclusion and exclusion form depicted in black schematic beneath plots. Data are grouped from 3 biological replicates. RT-PCR analysis of BCL2L11 target exon inclusion in Kasumi-1 cells expressing control (C) or HASPIN-targeting shRNA 1 (1). Schematic of inclusion (larger) and skipping (smaller) isoforms included to left of gel image. Percent exon inclusion between the 2 isoforms after HASPIN depletion is quantified. Data are mean ± SD of 4 independent experiments. Statistical significance determined by unpaired 2-tailed Student t test. ∗∗P < .01. (F) RBP motif enrichment analysis of SRSF1 and HNRNPC in significant SE splicing events on HASPIN depletion in Kasumi-1 cells. Motif enrichment (top) and P value (bottom) are reported at various positions along representative cassette exon for splicing events with significantly promoted exon inclusion (orange, 2641 events) or suppressed exon inclusion (purple, 2498 events) on HASPIN depletion relative to nondifferentially spliced background (green, 7049 events) as determined by rMAPS2. A region of 250 bp was analyzed using a 50 bp sliding window.
Figure 5.
Figure 5.
HASPIN is a clinically relevant, general leukemia dependency. (A) Bar plot depicting mean log2(fold change) of HASPIN targeting sgRNA genome-wide CRISPR screen performed in several leukemia cell lines as reported by Wang et al. Screen data were retrieved from BIOGRID ORCS. Dotted line indicates author-specified significance cutoff. (B) Competitive proliferation assay of THP-1 or OCI-AML3 cells expressing nontargeting negative control, RPA3-targeting positive control, or 1 of 2 HASPIN-targeting sgRNAs derived from CRISPR screen. Relative changes in cell proliferation rate measured by percentage of GFP-positive cells relative to nontargeting control on each day. Data are mean ± SD of 4 independent experiments per cell line. (C) Box plots depicting median HASPIN mRNA expression in the TCGA-LAML patient cohort separated by AML subtype. MLL (KMT2A) or RUNX1-RUNX1T1 t(8;21) translocation cohorts are highlighted in green and orange, respectively. Individuals with KMT2A structural variants are indicated with purple diamonds. (D) Box plots depicting median HASPIN mRNA expression in the BEAT-AML (2022) patient cohort separated by AML subtype. MLL (KMT2A) or RUNX1-RUNX1T1 t(8;21) translocation cohorts are highlighted in green and orange, respectively. Individuals with KMT2A structural variants are indicated with purple diamonds. (E) Kaplan-Meier survival curve depicting comparison of overall survival of patients with TCGA-LAML belonging to the top quartile (red) and bottom quartile (blue) of HASPIN expression. Plot and data derived from GEPIA2. (F) Forest plot of hazard ratios from multivariate Cox proportional hazard analysis of overall survival of patients with TCGA LAML incorporating HASPIN expression level and significant clinical and genetic factors. High and low HASPIN-expressing patients belong to the top and bottom expression quartiles, respectively. Clinical variables include the following: patient sex (Sex), age at first diagnosis (Diagnosis_Age), genetic risk group (Risk_Group), FLT3 mutation status (FLT3_Status), NPM1 mutation status (NPM1_Status), DNMT3A mutation status (DNMT3A_Status), TP53 mutation status (TP53_Status), and NRAS mutation status (NRAS_Status). Clinical metadata and mutation calls derived from the Genomic Data Commons TCGA LAML project patient information. N.D., not defined; NOS, not otherwise specified; NP, not profiled.
Figure 5.
Figure 5.
HASPIN is a clinically relevant, general leukemia dependency. (A) Bar plot depicting mean log2(fold change) of HASPIN targeting sgRNA genome-wide CRISPR screen performed in several leukemia cell lines as reported by Wang et al. Screen data were retrieved from BIOGRID ORCS. Dotted line indicates author-specified significance cutoff. (B) Competitive proliferation assay of THP-1 or OCI-AML3 cells expressing nontargeting negative control, RPA3-targeting positive control, or 1 of 2 HASPIN-targeting sgRNAs derived from CRISPR screen. Relative changes in cell proliferation rate measured by percentage of GFP-positive cells relative to nontargeting control on each day. Data are mean ± SD of 4 independent experiments per cell line. (C) Box plots depicting median HASPIN mRNA expression in the TCGA-LAML patient cohort separated by AML subtype. MLL (KMT2A) or RUNX1-RUNX1T1 t(8;21) translocation cohorts are highlighted in green and orange, respectively. Individuals with KMT2A structural variants are indicated with purple diamonds. (D) Box plots depicting median HASPIN mRNA expression in the BEAT-AML (2022) patient cohort separated by AML subtype. MLL (KMT2A) or RUNX1-RUNX1T1 t(8;21) translocation cohorts are highlighted in green and orange, respectively. Individuals with KMT2A structural variants are indicated with purple diamonds. (E) Kaplan-Meier survival curve depicting comparison of overall survival of patients with TCGA-LAML belonging to the top quartile (red) and bottom quartile (blue) of HASPIN expression. Plot and data derived from GEPIA2. (F) Forest plot of hazard ratios from multivariate Cox proportional hazard analysis of overall survival of patients with TCGA LAML incorporating HASPIN expression level and significant clinical and genetic factors. High and low HASPIN-expressing patients belong to the top and bottom expression quartiles, respectively. Clinical variables include the following: patient sex (Sex), age at first diagnosis (Diagnosis_Age), genetic risk group (Risk_Group), FLT3 mutation status (FLT3_Status), NPM1 mutation status (NPM1_Status), DNMT3A mutation status (DNMT3A_Status), TP53 mutation status (TP53_Status), and NRAS mutation status (NRAS_Status). Clinical metadata and mutation calls derived from the Genomic Data Commons TCGA LAML project patient information. N.D., not defined; NOS, not otherwise specified; NP, not profiled.
Figure 6.
Figure 6.
HASPIN inhibitor CHR-6494 effectively targets AML and synergizes with BCL-2 inhibition. (A) Dose-response curves (left) and IC50 comparison (right) of Kasumi-1 and healthy CD34+ hematopoietic progenitor cells treated with CHR-6494. IC50 values determined by nonlinear regression. Data on curve are mean ± SD of technical triplicates. Representative curves of 3 independent experiments revealed. Data on bar plot are mean ± SD of 3 independent experiments. Significance determined by unpaired 2-tailed Student t test. ∗∗∗∗P < .0001. (B) Bar plots comparing CHR-6494 IC50 values in leukemia cell lines. IC50 values determined by dose-response curve with nonlinear regression for each cell line. Data are mean ± SD of 3 independent experiments. Dotted line indicates CHR-6494 IC50 value of healthy CD34+ hematopoietic progenitor cells determined in panel A. (C) Bar plots depicting normalized HASPIN sgRNA counts in a genome-wide CRISPR screen in MOLM-13 cells treated with either DMSO or VEN for 8 or 16 days as performed by Chen et al. Screen data were retrieved from BIOGRID ORCS. Counts were normalized to initial time point (d0). One data point was removed from DMSO (d16) as a significant outlier. Data are mean ± SD. Significance determined by 1-way ANOVA with Holm-Sidak multiple comparison correction. ∗P < .05; ∗∗P < .01. (D) Dose-response matrix (left) and corresponding zero interaction potency (ZIP) drug synergy contour plot (right) of Kasumi-1 cells treated with CHR-6494 and VEN combination for 48 hours. Each cell represents drug combined at indicated concentrations. Treatment response is percent inhibition; higher values indicate lower cell viability. Synergy scores represent ZIP synergy calculations of inhibition effects exceeding values expected between 2 noninteracting agents. Mean synergy scores and significance reported at top of respective contour plot. Representative plots of 3 independent experiments revealed. (E) Dose-response matrix (left) and corresponding ZIP drug synergy contour plot (right) of THP-1 cells treated with CHR-6494 and VEN combination for 48 hours. Each cell represents drug combined at indicated concentrations. Treatment response is percent inhibition; higher values indicate lower cell viability. Synergy scores represent ZIP synergy calculations of inhibition effects exceeding values expected between 2 noninteracting agents. Mean synergy scores and significance reported at top of respective contour plot. Representative plots of 3 independent experiments revealed. (F) Dose-response matrix (left) and corresponding ZIP drug synergy contour plot (right) of OCI-AML3 cells treated with CHR-6494 and VEN combination for 48 hours. Each cell represents drug combined at indicated concentrations. Treatment response is percent inhibition; higher values indicate lower cell viability. Synergy scores represent ZIP synergy calculations of inhibition effects exceeding values expected between 2 noninteracting agents. Mean synergy scores and significance reported at top of respective contour plot. Representative plots of 3 independent experiments revealed. DMSO, dimethyl sulfoxide.

Similar articles

References

    1. Siegel RL, Giaquinto AN, Jemal A. Cancer statistics, 2024 [published correction appears in CA Cancer J Clin. 2024;74(2):203] CA Cancer J Clin. 2024;74(1):12–49.
    1. Döhner H, Wei AH, Appelbaum FR, et al. Diagnosis and management of AML in adults: 2022 recommendations from an international expert panel on behalf of the ELN. Blood. 2022;140(12):1345–1377. - PubMed
    1. Döhner H, DiNardo CD, Appelbaum FR, et al. Genetic risk classification for adults with AML receiving less-intensive therapies: the 2024 ELN recommendations. Blood. 2024;144(21):2169–2173. - PubMed
    1. DiNardo CD, Cortes JE. Mutations in AML: prognostic and therapeutic implications. Hematology Am Soc Hematol Educ Program. 2016;2016(1):348–355. - PMC - PubMed
    1. Wichmann C, Quagliano-Lo Coco I, Yildiz Ö, et al. Activating c-KIT mutations confer oncogenic cooperativity and rescue RUNX1/ETO-induced DNA damage and apoptosis in human primary CD34+ hematopoietic progenitors. Leukemia. 2015;29(2):279–289. - PMC - PubMed

LinkOut - more resources