

Exploring the Prevention of Lipid Deposition Caused by High-Fat Diet and Its Mechanism of Action of Rosa roxburghii Fermented Juice Based on Liver Metabolomics and Gut Microbiota
- PMID: 40735404
- PMCID: PMC12301631
- DOI: 10.1002/fsn3.70449
Exploring the Prevention of Lipid Deposition Caused by High-Fat Diet and Its Mechanism of Action of Rosa roxburghii Fermented Juice Based on Liver Metabolomics and Gut Microbiota
Abstract
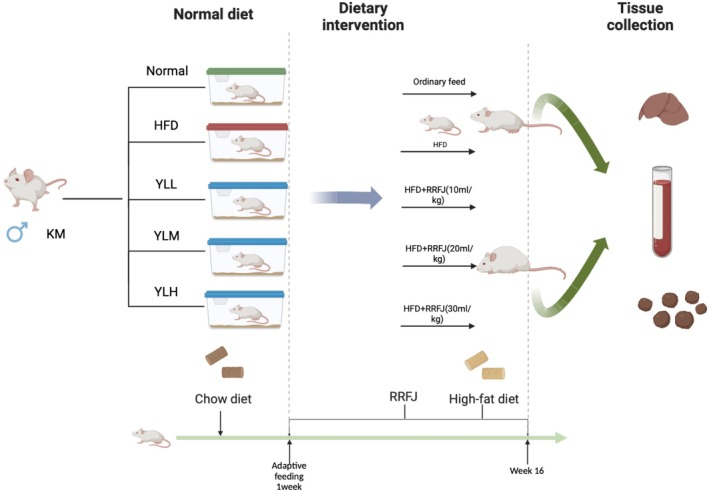
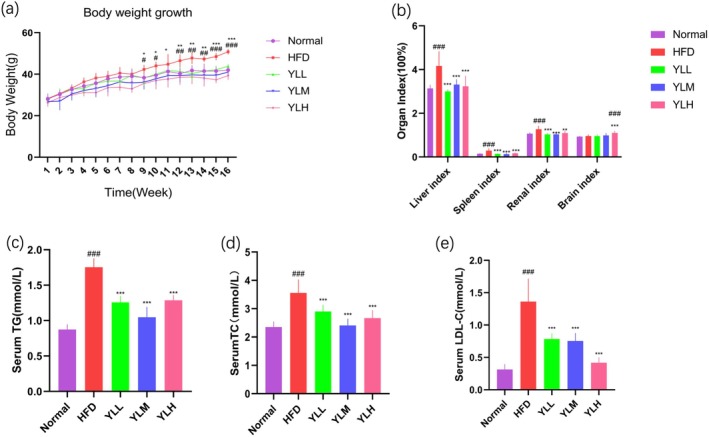
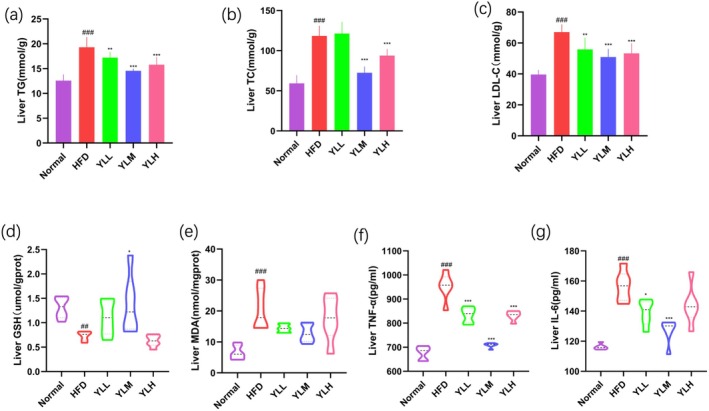
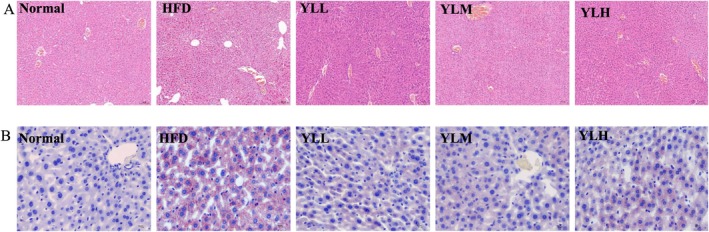
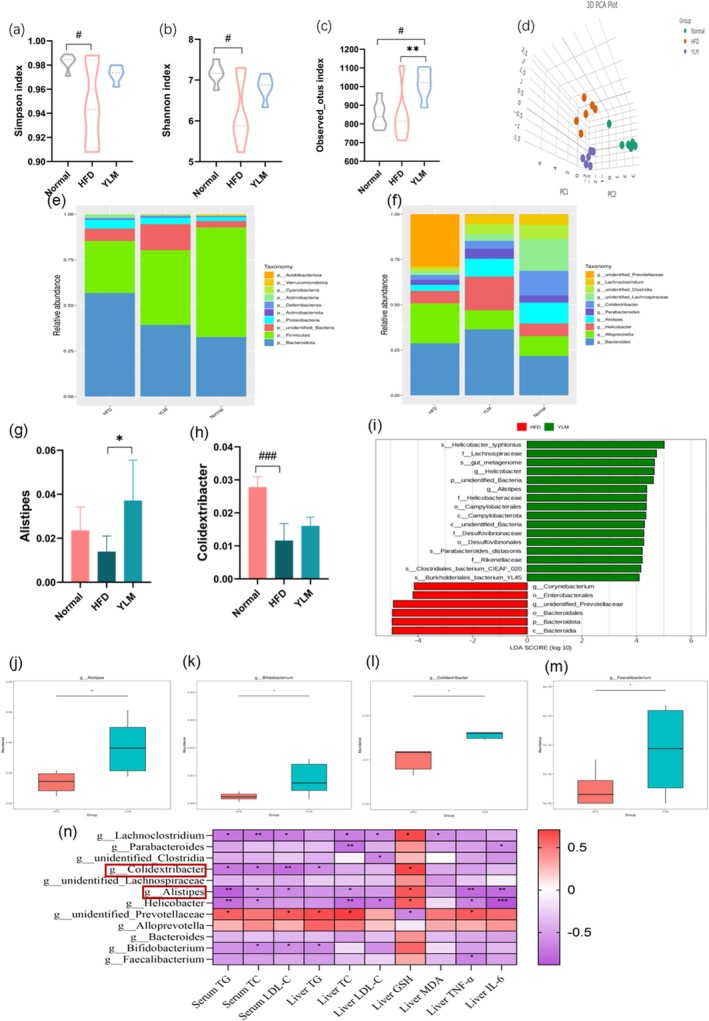
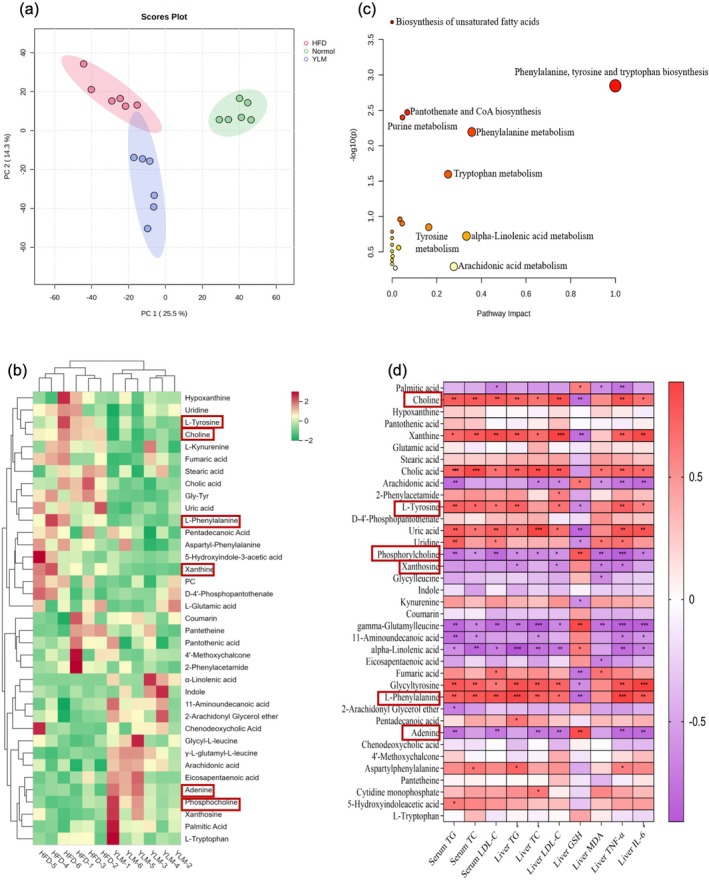
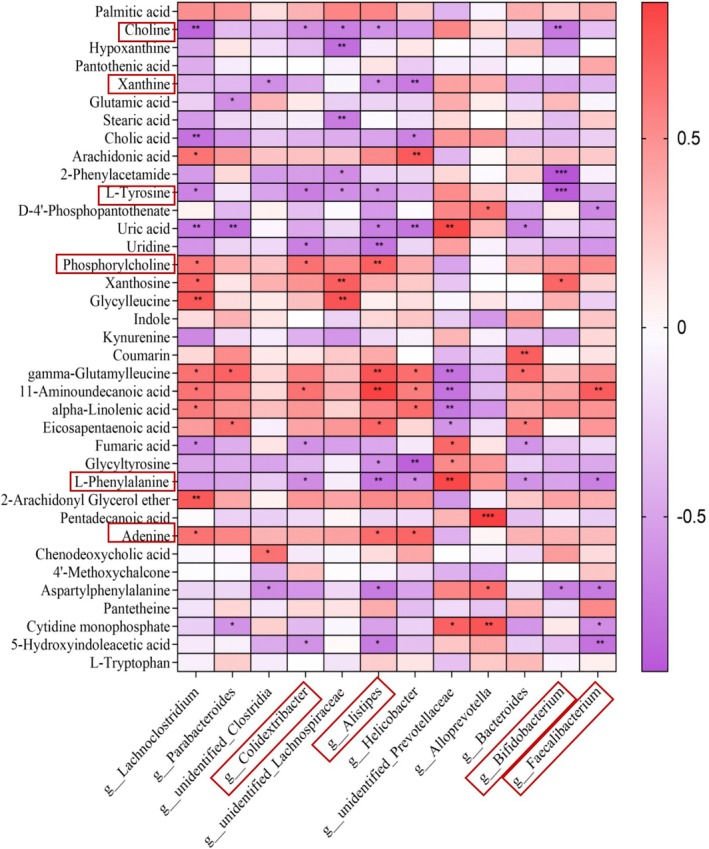
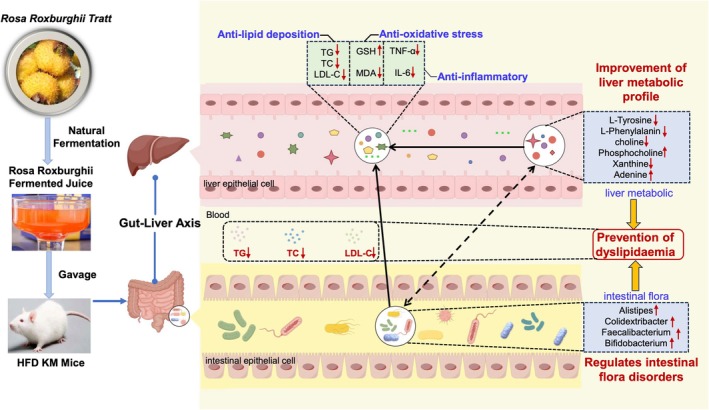
Hyperlipidemia has become a prevalent disease in the global epidemic, posing a threat to human health. This study aims to investigate the mechanism by which Rosa roxburghii fermented juice (RRFJ) can prevent lipid deposition induced by a high-fat diet in mice. The results showed that mice in the RRFJ intervention group had significantly reduced body weight as well as lower levels of serum and liver lipid indicators compared to the high-fat diet group. Metagenomic analysis revealed that the RRFJ intervention reversed the decrease in intestinal flora Alistipes and Colidextribacter genes in mice fed a high-fat diet. Liver metabolomics showed that the RRFJ prevented liver dyslipidemia by modulating the biosynthesis of phenylalanine, tyrosine, tryptophan, and phenylalanine metabolism. RRFJ is effective in preventing dyslipidemia through the 'gut-liver axis', which regulates the imbalance of intestinal flora and improves hepatic metabolic profiles. This provides a new intervention strategy for the prevention and treatment of hyperlipidemia.
Keywords: Rosa roxburghii fermented juice; gut microbiota; lipid deposition; liver metabolism.
© 2025 The Author(s). Food Science & Nutrition published by Wiley Periodicals LLC.
Conflict of interest statement
The authors declare no conflicts of interest.
Figures
Similar articles
-
Effects of wheat-based fermented liquid feed on growth performance, nutrient digestibility, gut microbiota, intestinal morphology, and barrier function in grower-finisher pigs.J Anim Sci. 2024 Jan 3;102:skae229. doi: 10.1093/jas/skae229. J Anim Sci. 2024. PMID: 39155623
-
Study on the modulation of kidney and liver function of rats with diabetic nephropathy by Huidouba through metabolomics.J Ethnopharmacol. 2025 Jul 24;351:120136. doi: 10.1016/j.jep.2025.120136. Epub 2025 Jun 11. J Ethnopharmacol. 2025. PMID: 40513925
-
Antrodia cinnamomea and its compound dehydroeburicoic acid attenuate nonalcoholic fatty liver disease by upregulating ALDH2 activity.J Ethnopharmacol. 2022 Jun 28;292:115146. doi: 10.1016/j.jep.2022.115146. Epub 2022 Mar 16. J Ethnopharmacol. 2022. PMID: 35304272
-
Signs and symptoms to determine if a patient presenting in primary care or hospital outpatient settings has COVID-19.Cochrane Database Syst Rev. 2022 May 20;5(5):CD013665. doi: 10.1002/14651858.CD013665.pub3. Cochrane Database Syst Rev. 2022. PMID: 35593186 Free PMC article.
-
Management of urinary stones by experts in stone disease (ESD 2025).Arch Ital Urol Androl. 2025 Jun 30;97(2):14085. doi: 10.4081/aiua.2025.14085. Epub 2025 Jun 30. Arch Ital Urol Androl. 2025. PMID: 40583613 Review.
References
-
- Bi, Z. , Chen J., Chang X., et al. 2023. “ADT‐OH Improves Intestinal Barrier Function and Remodels the Gut Microbiota in DSS‐Induced Colitis.” Frontiers of Medicine 17: 972–992. - PubMed
-
- Chen, L. , Garmaeva S., Zhernakova A., Fu J., and Wijmenga C.. 2018. “A System Biology Perspective on Environment–Host–Microbe Interactions.” Human Molecular Genetics 27: R187–R194. - PubMed
-
- Chen, X. , Wang C., Zhang K., et al. 2016. “Reduced Femoral Bone Mass in Both Diet‐Induced and Genetic Hyperlipidemia Mice.” Bone 93: 104–112. - PubMed
LinkOut - more resources
Full Text Sources
