. 2025 Jul 14:11:101146.
doi: 10.1016/j.crfs.2025.101146. eCollection 2025.

The three-dimensional structure prediction of human bitter taste receptor using the method of AlphaFold3

Affiliations

The three-dimensional structure prediction of human bitter taste receptor using the method of AlphaFold3

Takafumi Shimizu et al. Curr Res Food Sci. .

Abstract

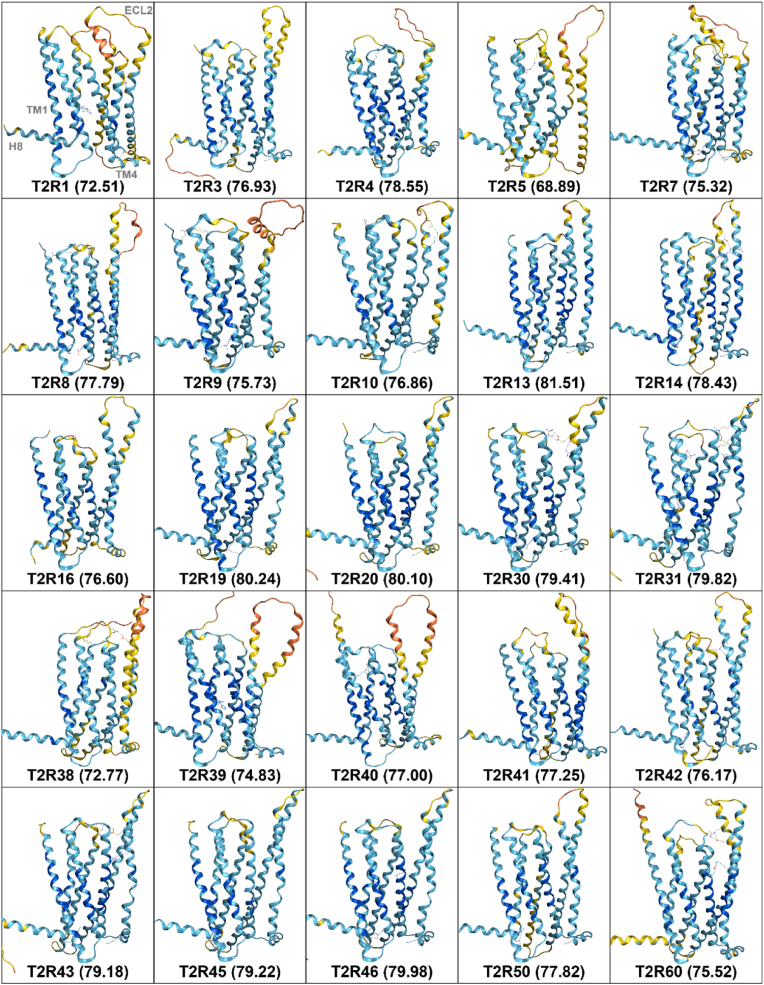
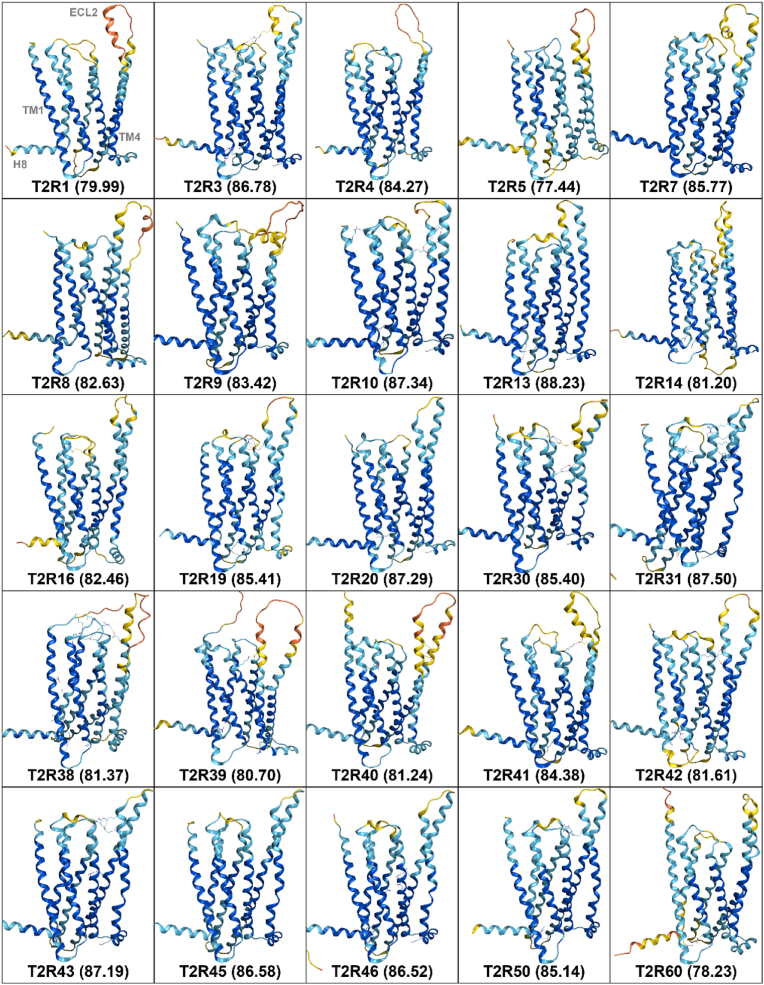
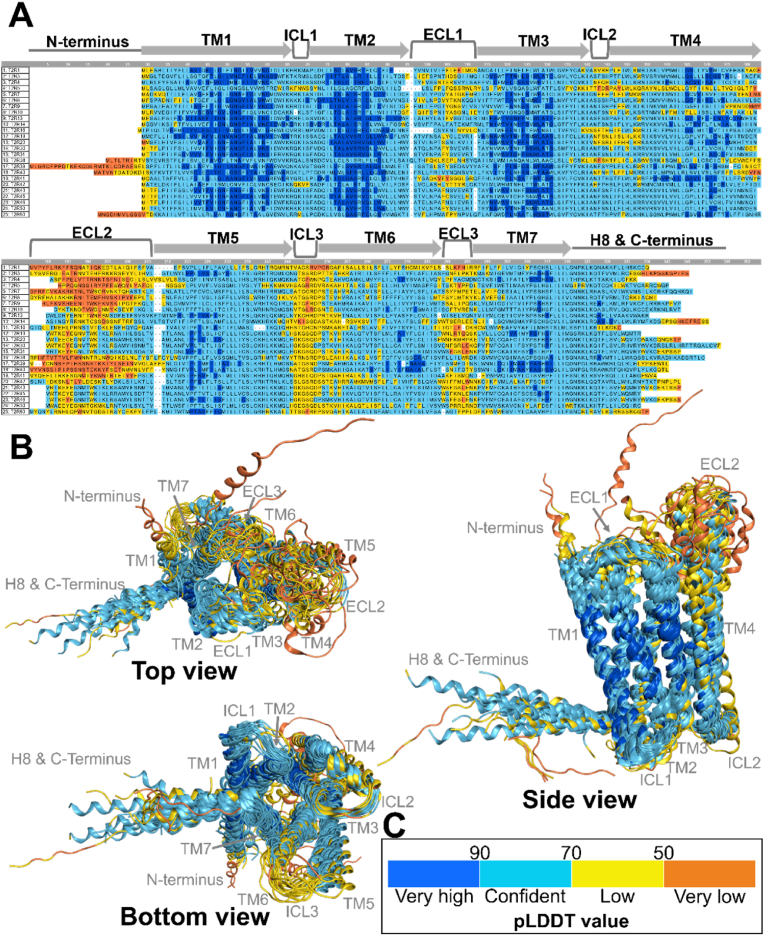
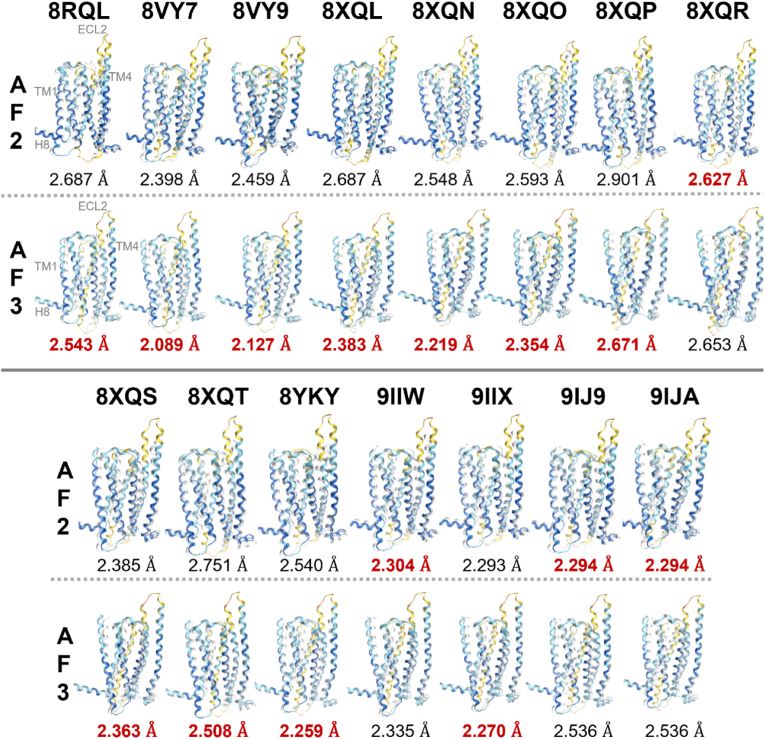
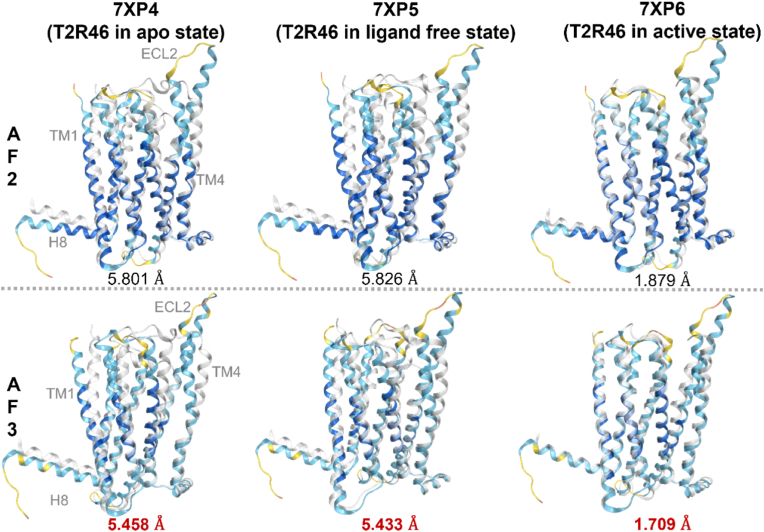
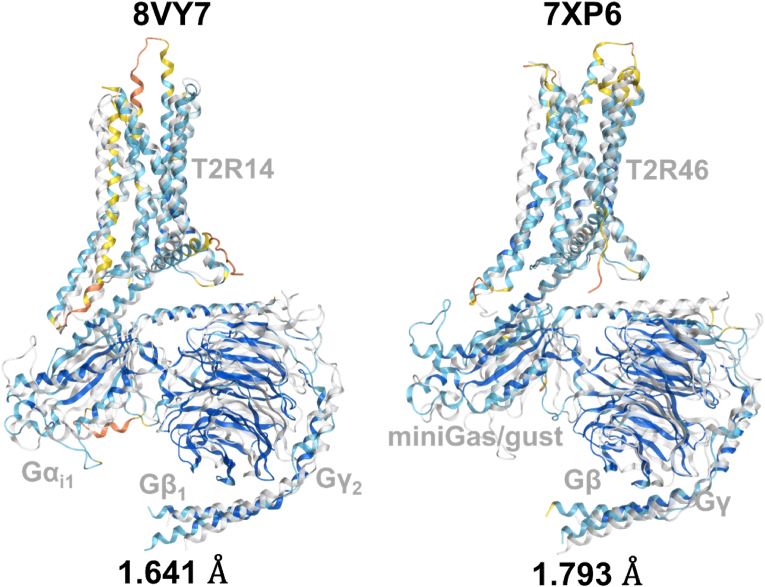
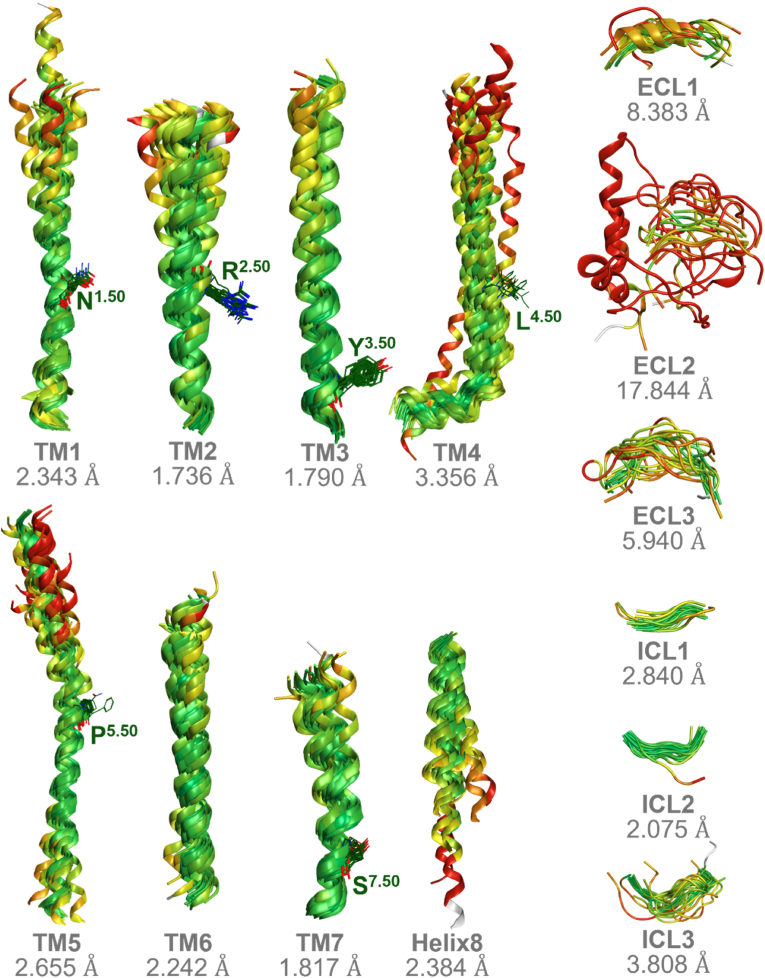
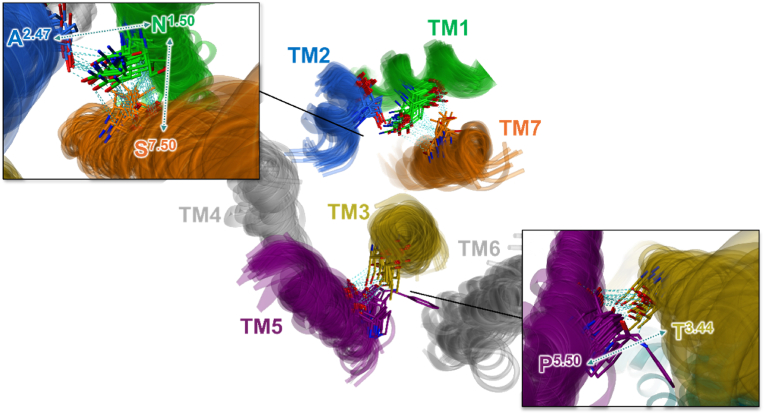
Bitter taste receptors (T2Rs), a subfamily of G protein-coupled receptors, are expressed not only in oral tissues but also in extraoral sites, playing key roles in physiological processes such as the gut-brain axis. However, structural information on T2Rs is limited, with only two human T2Rs, T2R14 and T2R46, experimentally determined to date. This study explores the potential of AlphaFold3 (AF3), an advanced AI-based protein structure prediction tool, to predict the structures of 25 human T2Rs and compares them with those of the earlier AlphaFold2 (AF2). The accuracy of AF3 was evaluated by comparing the predicted structures of T2R14 and T2R46 with known experimental structures. Our results show that AF3 provides more accurate structural predictions than AF2 for these receptors, though the predicted local distance difference test scores for AF3 were unexpectedly lower across all T2R subtypes. Subsequent analysis indicated that significant structural variations were observed in the receptor's extracellular region, in contrast to a higher degree of structural consistency in the intracellular region. Clustering based on sequence identity and root mean square deviation highlighted distinct groupings among the receptors. The structural properties of these T2Rs may be related to their ability to recognize thousands of diverse bitter substances through interaction with the taste receptor-specific G protein, α-gustducin. The present study provides evidence that AF3 can advance our understanding of T2R structure and research into the biological activity of T2R-ligand interactions in health-related processes, including risk reduction of obesity and diabetes.

Keywords: Alphafold3; Extracellular loop; Human bitter taste receptor; Three-dimensional structure prediction; Transmembrane helix.


Conflict of interest statement

The authors declare that they have no known competing financial interests or personal relationships that could have appeared to influence the work reported in this paper.

Figures

Image 1
Graphical abstract
Fig. 1
Fig. 1
Predicted structures of all human T2R subtypes by AF3. For each T2R subtype, five prediction models were generated, and the best model was selected for further analysis. The global pLDDT values, which represent the confidence of the overall structural predictions, are indicated in parentheses for each T2R subtype. The pLDDT values ranged from 68.89 for T2R5 to 81.51 for T2R13. The structural models were colored with MOE based on pLDDT confidence levels: dark blue for pLDDT > 90 (very high), light blue for 90 > pLDDT > 70 (confident), yellow for 70 > pLDDT > 50 (low), and orange for 50 > pLDDT (very low).
Fig. 2
Fig. 2
Predicted structures of all human T2R subtypes by AF2. The predicted structures of human T2Rs by AF2 were obtained from AlphaFold Protein Structure Database in mmCIF format. The pLDDT values ranged from 77.44 for T2R5 to 88.23 for T2R13. The structural models are colored with MOE based on pLDDT confidence levels: dark blue for pLDDT > 90 (very high), light blue for 90 > pLDDT > 70 (confident), yellow for 70 > pLDDT > 50 (low), and orange for 50 > pLDDT (very low).
Fig. 3
Fig. 3
pLDDT values for each region of the T2Rs predicted by AF3. A, pLDDT values for each amino acid residue, along with the corresponding structure. The pLDDT values were higher in the TM regions, while lower values were observed in the ECL regions. Notably, higher pLDDT values were found in TM1, TM2, and TM3, whereas lower values were observed in ECL2. B, The 3D alignment of the predicted structures. In regions with high prediction accuracy, the structures showed high consistency, while in regions with low accuracy, considerable structural variation was observed. C, The pLDDT coloring criteria used in this study, where dark blue indicates pLDDT > 90 (very high), light blue indicates 90 > pLDDT >70 (confident), yellow indicates 70 > pLDDT > 50 (low), and orange indicates 50 > pLDDT (very low).
Fig. 4
Fig. 4
Alignment of the experimental structure of T2R14 with the predicted structures of AF2 and AF3. 8RQL: TAS2R14 receptor bound to flufenamic acid and gustducin; 8VY7: CryoEM structure of Gi-coupled TAS2R14 with cholesterol and an intracellular tastant; 8VY9: CryoEM structure of Ggust-coupled TAS2R14 with cholesterol and an intracellular tastant; 8XQL: Structure of human class T GPCR TAS2R14-miniGs/gust complex with Aristolochic acid A; 8XQN: Structure of human class T GPCR TAS2R14-DNGi complex with Aristolochic acid A; 8XQO: Structure of human class T GPCR TAS2R14-Gi complex with Aristolochic acid A; 8XQP: Structure of human class T GPCR TAS2R14-Gustducin complex with Aristolochic acid A; 8XQR: Structure 2 of human class T GPCR TAS2R14-miniGs/gust complex with Flufenamic acid; 8XQS: Structure of human class T GPCR TAS2R14-DNGi complex with Flufenamic acid; 8XQT: Structure of human class T GPCR TAS2R14-Gi complex; 8YKY: Structure of human class T GPCR TAS2R14-Ggustducin complex with agonist 28.1; 9IIW: A local Cryo-EM structure of Bitter taste receptor TAS2R14; 9IIX: A Cryo-EM structure of Bitter taste receptor TAS2R14 with Ggust; 9IJ9: A Cryo-EM structure of Bitter taste receptor TAS2R14 with Gi complex; 9IJA: A local Cryo-EM structure of Bitter taste receptor TAS2R14 with Gi complex. Transparent white ribbon structures represent experimental structures while structures colored by pLDDT values represent predicted structures by each AF, where dark blue indicates pLDDT > 90 (very high), light blue indicates 90 > pLDDT >70 (confident), yellow indicates 70 > pLDDT > 50 (low), and orange indicates 50 > pLDDT (very low). The smaller the RMSD value, the smaller the discrepancy between structures. RMSD values for AF structures with low RMSD values are shown in bold red. Among the 11 structures used (excluding 8XQR, 9IIW, 9IJ9, and 9IJA), AF3 demonstrated more accurate predictions compared to AF2. The highest resolution structure determined by cryo-EM (2.68 Å, 8VY7) showed the greatest similarity with the AF3 prediction, with an RMSD of 2.089 Å. The average RMSD for AF2 was 2.517 Å, while AF3 improved this to 2.390 Å.
Fig. 5
Fig. 5
Alignment of the experimental structure of T2R46 with the predicted structures of AF2 and AF3. 7XP4: T2R46 in apo state; 7XP5: T2R46 in ligand free state; 7XP6: T2R46 in active state. Transparent white ribbon structures represent experimental structures, while structures colored by pLDDT values represent predicted structures by each AF, where dark blue indicates pLDDT > 90 (very high), light blue indicates 90 > pLDDT > 70 (confident), yellow indicates 70 > pLDDT > 50 (low), and orange indicates 50 > pLDDT (very low). The smaller the RMSD value, the smaller the discrepancy between structures. RMSD values for AF structures with low RMSD values are shown in bold red. AF3 provided more accurate predictions than AF2 for all three structures. The highest similarity was observed for the T2R46 in strychnine-bound active state, with an RMSD of 1.709 Å.
Fig. 6
Fig. 6
Predicted complex structures of T2R14 and T2R46 with G proteins using AlphaFold3. T2R14: PDB ID 8VY7, RMSD = 1.641 Å; T2R46: PDB ID 7XP6, RMSD = 1.793 Å. Transparent white ribbon structures represent experimental structures while structures colored by pLDDT values represent predicted structures by each AF, where dark blue indicates pLDDT > 90 (very high), light blue indicates 90 > pLDDT >70 (confident), yellow indicates 70 > pLDDT > 50 (low), and orange indicates 50 > pLDDT (very low). The smaller the RMSD value, the smaller the discrepancy between structures.
Fig. 7
Fig. 7
Similarities and differences between the amino acid sequences of 25 T2Rs and their predicted structures by AF3. A, the 2D alignment of amino acid sequences, the corresponding structures, and the structural variation of each residue, represented by RMSD values. Amino acid residues are color-coded based on sequence identity (%), with regions of higher identity shown in darker magenta. Additionally, the RMSD values for each residue, indicated above the sequence, transition from green to red as the values increase. The TM regions exhibited high sequence identity overall, while the extracellular regions showed lower identity, especially in the ECL structures where sequence diversity was observed. Furthermore, there was a tendency for sequence identity to decrease as it approaches the extracellular region, even within the TM domains. B, 3D alignment of the predicted structures. TM regions displayed high structural consistency, while the ECL structures, particularly ECL2, exhibited greater diversity. Additionally, the intracellular regions tended to show more consistent structures. C, The color-coding criteria used in the present figure, where higher identity percentages are represented by darker magenta, and RMSD values transition from green to red as the values increase.
Fig. 8
Fig. 8
RMSD values for each helix and loop structure. Based on the full structural alignment shown in Fig. 7B, each helix (TM1–TM7, Helix 8) and loop region (ECLs and ICLs) was individually extracted, and RMSD values were calculated for each region. The RMSD values were as follows: TM1, 2.343 Å; TM2, 1.736 Å; TM3, 1.790 Å; TM4, 3.356 Å; TM5, 2.655 Å; TM6, 2.242 Å; TM7, 1.817 Å; Helix 8, 2.384 Å; ECL1, 8.383 Å; ECL2, 17.844 Å; ECL3, 5.940 Å; ICL1, 2.840 Å; ICL2, 2.075 Å; ICL3, 3.808 Å. RMSD values transition from green to red as the values increase.
Fig. 9
Fig. 9
The role of conserved residues at the X.50 positions, based on the Ballesteros–Weinstein numbering system. Transmembrane helices are color-coded as follows: TM1 (green), TM2 (blue), TM3 (yellow), TM5 (purple), TM7 (orange), and TM4 and TM6 (gray). Hydrogen bonds between transmembrane helices were frequently observed across many T2Rs, particularly involving N1.50 and A2.47, as well as N1.50 and S7.50. Additionally, hydrogen bonding between P5.50 and T3.44 was commonly identified. The presence or absence of these interhelical hydrogen bonds for each T2R is summarized in Supplementary Table S1.
Fig. 10
Fig. 10
Clustering by sequence identity and RMSD value between each T2R subtype. A, Sequence identity among each T2R subtype. The sequence identity ranged from 19.5 % (between T2R16 and T2R38) to 89.3 % (between T2R31 and T2R43). B, Clustering results based on Fig. 10A. Circled clusters are clusters validated by silhouette analysis (Supplementary Fig. S2). T2R subtypes belonging to the validated cluster are shown at the bottom. C, RMSD values between each T2R subtype. The RMSD values varied from 0.816 Å (between T2R43 and T2R46) to 7.105 Å (between T2R7 and T2R9). D, clustering results based on Fig. 10C. Clusters circled as if they were clusters validated by silhouette analysis (Supplementary Fig. S3). T2R subtypes belonging to the validated cluster are shown at the bottom.

Similar articles

References

    1. Abramson J., Adler J., Dunger J., Evans R., Green T., Pritzel A., Ronneberger O., Willmore L., Ballard A.J., Bambrick J., Bodenstein S.W., Evans D.A., Hung C.-C., O'Neill M., Reiman D., Tunyasuvunakool K., Wu Z., Žemgulytė A., Arvaniti E., et al. Accurate structure prediction of biomolecular interactions with AlphaFold 3. Nature. 2024;630(8016):493–500. doi: 10.1038/s41586-024-07487-w. - DOI - PMC - PubMed
    1. Andres-Barquin P.J., Conte C. Molecular basis of bitter taste: the T2R family of G protein-coupled receptors. Cell Biochem. Biophys. 2004;41(1):99–112. doi: 10.1385/CBB:41:1:099. - DOI - PubMed
    1. Behrens M., Foerster S., Staehler F., Raguse J.-D., Meyerhof W. Gustatory expression pattern of the human TAS2R bitter receptor gene family reveals a heterogenous population of bitter responsive taste receptor cells. J. Neurosci. 2007;27(46):12630–12640. doi: 10.1523/JNEUROSCI.1168-07.2007. - DOI - PMC - PubMed
    1. Bertheleme N., Chae P.S., Singh S., Mossakowska D., Hann M.M., Smith K.J., Hubbard J.A., Dowell S.J., Byrne B. Unlocking the secrets of the gatekeeper: methods for stabilizing and crystallizing GPCRs. Biochim. Biophys. Acta Biomembr. 2013;1828(11):2583–2591. doi: 10.1016/j.bbamem.2013.07.013. - DOI - PubMed
    1. Buchanan K.L., Rupprecht L.E., Kaelberer M.M., Sahasrabudhe A., Klein M.E., Villalobos J.A., Liu W.W., Yang A., Gelman J., Park S., Anikeeva P., Bohórquez D.V. The preference for sugar over sweetener depends on a gut sensor cell. Nature Neuroscience. 2022;25(2):191–200. doi: 10.1038/s41593-021-00982-7. - DOI - PMC - PubMed

LinkOut - more resources