. 2025 Jul 25:23971983251356123.
doi: 10.1177/23971983251356123. Online ahead of print.

Transcriptomic profiling of scleroderma monocytes reveals links with cardiovascular complications, implicating Notch and interferon pathways

Affiliations

Transcriptomic profiling of scleroderma monocytes reveals links with cardiovascular complications, implicating Notch and interferon pathways

Mehmed T Dinc et al. J Scleroderma Relat Disord. .

Abstract

Objectives: Recent research has highlighted the critical role of monocytes and macrophages in driving both inflammatory and fibrotic processes in systemic sclerosis. This study seeks to elucidate the gene expression profiles of systemic sclerosis monocytes and their potential links to disease complications, with the ultimate goal of uncovering novel therapeutic targets.

Methods: A total of 48 systemic sclerosis patients and 15 controls were recruited and monocytes were isolated using CD14+ magnetic beads. Total RNA was extracted and bulk RNA-seq analysis was performed. Differential gene expression followed by unsupervised hierarchical clustering and pathway analysis was conducted, and correlations with clinical features were analyzed. Interferon signature score (IFN6) was calculated using the log transformed values of six genes (IFIT3, IFIT2, MX1, IFIH1, STAT2, and NCF1).

Results: We identified four distinct patient subgroups, relative to normal, two with inflammatory and two with non-inflammatory gene profiles. The inflammatory subgroups exhibited high expression of interferon-related genes and included all systemic sclerosis patients with pulmonary hypertension and most with cardiac involvement. In these patients, IFN6 was markedly elevated and showed a significant correlation with global longitudinal strain (GLS; r = -0.5, p = 0.006), a key indicator of cardiac function. Furthermore, pathway analysis identified an enrichment of the Notch signaling pathway among genes whose overexpression correlated with impaired global longitudinal strain.

Conclusion: These findings unveil a potential new mechanistic link between interferon activity, Notch signaling, and cardiac complications in systemic sclerosis, offering new insights into disease pathogenesis and potential therapeutic targets.

Keywords: Scleroderma; cardiovascular complications; disease characteristics; gene expression; monocytes.


Conflict of interest statement

The author(s) declared the following potential conflicts of interest with respect to the research, authorship, and/or publication of this article: J.K.L. received research support from United Therapeutics within the past 3 years. R.L. reports research grants from Bristol Myers Squibb, Formation, Moderna, Regeneron and Pfizer; serves/served as consultant for AbbVie, Mediar, Bristol Myers Squibb, Formation, Thirona Bio, Sanofi, Boehringer-Ingelheim, Merck, Genentech/Roche, EMD Serono, Morphic, Third Rock Ventures, Bain Capital and Zag Bio; serves on independent data safety monitoring committees for Advarra/GSK and Genentech; holds stock in Thirona Bio Inc; and is president and stockholder of Modumac Therapeutics Inc. A.M.B. serves as a consultant for Mediar Therapeutics.

Figures

Generate a concise description for an image showing differentially expressed genes and significant pathways in SSc monocytes.
Figure 1.
Differential gene expression in systemic sclerosis monocytes. (a) Volcano plot showing differentially expressed genes (p < 0.05,|log2 fold change| > 1.5) in systemic sclerosis (SSc) monocytes compared to healthy controls. (b) Gene set enrichment analysis results showing significantly enriched pathways in SSc monocytes.
The image illustrates the impact of feature selection and dimensionality reduction on the separation of gene expression data using Principal Component Analysis (PCA). The left PCA plot shows limited separation between Systemic Sclerosis (SSc) and healthy control (HC) samples using all genes, while the right plot, after feature selection, shows enhanced separation. The dendrogram below clusters SSc samples into four main groups, highlighting significant differences among them.
Figure 2.
Enhanced sample separation using feature selection and dimensionality reduction techniques. (a) Principal component analysis (PCA) plots comparing gene expression data before and after feature selection. Left: PCA plot using all genes shows limited separation between systemic sclerosis (SSc) and healthy control (HC) samples. Right: PCA plot using genes selected by elastic net regularization demonstrates clear separation between SSc and HC groups. (b) Dendrogram showing hierarchical clustering of systemic sclerosis (SSc) patient samples based on monocyte gene expression profiles. Four main clusters (A–D) are identified.
Here is the alt text description based on the provided context data:
Figure 3.
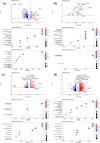
Functional analysis of differentially expressed genes in patient clusters. (a) cluster A, (b) Cluster B, (c) Cluster C and (d) Cluster D. For each cluster: Top: volcano plot showing the distribution of DEGs. Red dots indicate significantly upregulated genes, and blue dots indicate significantly downregulated genes. Bottom: gene ontology (GO) enrichment analysis results for the DEGs. The top enriched biological process terms are shown for upregulated (red) and downregulated (blue) genes. The x-axis represents the −log10(p-value) for each term, and the size of the dots corresponds to the number of genes associated with each term.
The image illustrates the relationship between GLS and Interferon signature scores across four SSc clusters, demonstrating their correlation and potential clinical significance.
Figure 4.
Interferon score correlates with clinical features. (a) GLS average by cluster: boxplot illustrating the distribution of global longitudinal strain (GLS) average values across the four identified SSc patient clusters. Each dot represents an individual patient’s GLS measurement. (b) Interferon score (IFN6) by cluster: boxplot showing the distribution of interferon signature score (calculated based on expression of IFIT3, IFIT2, MX1, IFIH1, STAT2, and NCF) across the four identified patient clusters. Each dot represents an individual patient, with the red dot and error bars indicating the mean and standard error for each cluster. ANOVA p-value = 0.0031. (c) IFN6 by PH Status: boxplot comparing interferon signature scores between SSc patients with and without pulmonary hypertension (PH). The Wilcoxon test p-value = 0.0441. (d) Interferon score (IFN6) vs GLS average: scatter plot showing the relationship between interferon score (IFN6) and global longitudinal strain (GLS) average. Each dot represents an individual patient. The red line indicates the linear regression fit. Pearson’s correlation coefficient = −0.501, p-value = 0.0066.
Volcano plot and correlation plots show strong negative correlations between gene expression and GLS in notch pathway-related genes, suggesting significant involvement of these pathways in systemic sclerosis. Enriched pathways include Notch signaling with high significance.
Figure 5.
Correlation of gene expression with global longitudinal strain (GLS). (a) Volcano plot showing gene expression correlations with GLS in systemic sclerosis (SSc) patients. Significant correlations are defined by p < 0.05 and |r| > 0.4 (indicated by vertical dashed lines). Blue points represent statistically significant correlations. (b) Correlation plots for three key Notch pathway-related genes: NUMB, PSEN1, and DNER. Each plot shows the negative correlation between gene expression and GLS. (c) Pathway enrichment analysis of genes negatively correlating with GLS. The dot plot shows significantly enriched pathways from various databases (indicated by different colors), with dot size corresponding to −log10(FDR q-value). The analysis reveals enrichment of multiple Notch signaling pathways in different databases.

References

    1. Laurent P, Sisirak V, Lazaro E, et al. Innate immunity in systemic sclerosis fibrosis: recent advances. Front Immunol 2018; 9: 1702. - PMC - PubMed
    1. O’Reilly S. Innate immunity in systemic sclerosis pathogenesis. Clin Sci 2014; 126: 329–337. - PubMed
    1. Rudnik M, Hukara A, Kocherova I, et al. Elevated fibronectin levels in profibrotic CD14(+) monocytes and CD14(+) macrophages in systemic sclerosis. Front Immunol 2021; 12: 642891. - PMC - PubMed
    1. Sakata K, Yasuoka H, Yoshimoto K, et al. Decreased activation of ataxia telangiectasia mutated (ATM) in monocytes from patients with systemic sclerosis. Rheumatology 2020; 59: 3961–3970. - PubMed
    1. Tourkina E, Bonner M, Oates J, et al. Altered monocyte and fibrocyte phenotype and function in scleroderma interstitial lung disease: reversal by caveolin-1 scaffolding domain peptide. Fibrogenesis Tissue Repair 2011; 4: 15. - PMC - PubMed

LinkOut - more resources