. 2025 Aug 29;137(6):866-879.
doi: 10.1161/CIRCRESAHA.125.326145. Epub 2025 Jul 30.

Immunoregulatory Endothelial Cells Interact With T Cells After Myocardial Infarction

Affiliations

Immunoregulatory Endothelial Cells Interact With T Cells After Myocardial Infarction

Lukas S Tombor et al. Circ Res. .

Abstract

Background: Endothelial cells (ECs) play pivotal roles in maintaining cardiac blood supply and regulating inflammation by acting as gatekeepers for immune cell activity. This study unveils a novel immunomodulatory function of cardiac ECs following myocardial infarction.

Methods: We used single-cell RNA sequencing and spatial transcriptomics to identify EC states after acute myocardial infarction in mice. Subsequently, we mimicked the cytokine environment that was predicted to induce EC activation in cell culture studies and confirmed the results in an endothelial-specific deletion mouse model.

Results: Single-cell RNA sequencing analysis identified a transient myeloid CD45+CD11b+Cdh5+ immunomodulatory EC phenotype (IMEC) emerging between days 1 and 3 after myocardial infarction. IMECs derived from Cdh5+ tissue resident cells as shown by bone marrow transplantation and lineage tracing experiment. Ligand-receptor interaction predictions indicated a cytokine-mediated activation of IMECs, which we validated through in vitro experiments in cultured ECs. Notably, while cytokine treatment with IL-1β and TGF-β (transforming growth factor β) induced mesenchymal gene expression, the addition of IFN-γ (interferon γ) facilitated the transition into the immunomodulatory phenotype. IMECs exhibited an upregulation of MHC-II (major histocompatibility complex class II) genes, along with the expression of RUNX1 (runt-related transcription factor-1) and proinflammatory cytokines, such as IL-6 and IL-12. IMECs induced T-cell activation through paracrine signaling and were colocalized with T cells in vivo. Inhibition of endothelial-specific IFN-γ-signaling in mice by IFN-γ receptor 1 deletion improved the recovery after myocardial infarction.

Conclusions: These findings provide insight into the role of ECs regulating adaptive immune responses following myocardial infarction, offering potential insights into therapeutic interventions for postinfarction immunomodulation.

Keywords: T-lymphocytes; endothelial cells; infarction; inflammation; ischemia.


Conflict of interest statement

None.

Figures
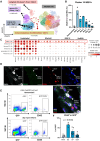
Figure 1.
Figure 1.
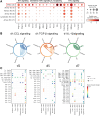
Immunomodulatory endothelial cells (ECs) derive from preexisting ECs in early response after acute myocardial infarction. A, Uniform Manifold Approximation and Projection (UMAP) representation of endothelial and myeloid cell subsets in single-cell RNA sequencing data after myocardial infarction (day [d] 1, d3, d5, d7, d14, and d28) and homeostasis. Eighteen clusters have been identified, 5 of endothelial origin. B, Fraction of IMECs (immunomodulator ECs) in the data set per total number of ECs for each sample (dot). Bars indicate the mean percent for each time point. C, Bubble plot of common EC marker genes, myeloid marker genes, MHC-II (major histocompatibility complex class II) genes, and endothelial-mesenchymal activation (EndMA) markers for all endothelial clusters in the data set. D, Representative immunofluorescence image of infarct/border zone in C57BL/6 mice 3 days postinfarction left ventricle. Wheat germ agglutinin (WGA; white), myeloid marker CD45 (green), pan-endothelial marker ERG1 (ETS-related gene; red), and DAPI (blue). For representative image, 3 mice (male) were stained. Scale bars=13 µm. E, Representative FACS plots of Cdh5-CreERT2;mTmG mice at homeostasis (n=4) or 3 days postinfarction (n=3) showing GFP (left) and CD45 in GFP+ cells (right). F, Quantification of CD45 in GFP+ cell fractions measured with FACS. Homeostasis (Hom, n=4), d3 (n=3), d7 (n=5), and d14 after infarct (n=4). Bars indicate mean percent±SEM for each time point. One-way ANOVA (Kruskal-Wallis test). SSC-W indicates side scatter–width.
Figure 2.
Figure 2.
Immunomodulatory endothelial cells (IMECs) are predicted to be primary receivers of proinflammatory and fibrotic cytokine signals. A, Bubble plot showing endothelial single-cell clusters and expression of genes associated with IFN-γ (interferon γ) signaling, cytokines signaling, TGF-β (transforming growth factor β) signaling, IL-1β (interleukin 1β) signaling and tumor necrosis factor (TNF)-α signaling. Size indicates the fraction of expressing cells; color indicates scaled mean expression. B, Ligand-receptor interactions of day (d) 1 cells for CCL (chemokine) signaling, TGF-β and IL-1β signaling, reveal incoming signals from myeloid cells towards IMECs in vivo. IMECs also receive TGF-β signaling via mural cells or fibroblasts. Arrows indicate enrichment in receiver ligand/receptor pair pathways measured with CellChat. Colors indicate signaling pathway. Color shade indicates cell type. C, Ligand-receptor interaction pairs for d1, d5, and d7 cells in vivo showing incoming signals to IMEC for pathways IL-1, CCL, C-X-C motif chemokine ligand (CXCL), TGF-β, TNF, IL-6, MHC-I (major histocompatibility complex class I), and macrophage inhibitory factor (MIF). Color represents relative interaction strength. Only significant interactions are shown; the dot size marks the P value of interactions.
Figure 3.
Figure 3.
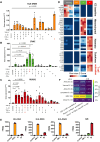
IFN-γ (interferon γ) dictates whether endothelial cells acquire mesenchymal or hematopoietic characteristics. A–C, HLA-DRB5 (MHC-II [major histocompatibility complex class II]), CNN1 (mesenchymal marker), or RUNX1 (runt-related transcription factor-1; hematopoietic marker) RNA expression in human umbilical cord venous endothelial cells (HUVECs) after 5 days of stimulation with combinations or single treatments of 10 ng/mL TGF-β (transforming growth factor β), 100 ng/mL IL-1β (interleukin 1β), 30 ng/mL tumor necrosis factor (TNF)-α, and 100 ng/mL IFN-γ. Quantitative polymerase chain reaction (qPCR) data has been normalized to untreated control and ribosomal protein large P0 (RPLP0) and glyceraldehyde-3-phosphate dehydrogenase (GAPDH) levels. Kruskal-Wallis test with Dunn’s correction for multiple testing, n=3, n=4, or n=5 independent experiments. D, Heatmaps showing row-wise z score of FPKM values measured with bulk RNA sequencing in HUVECs in control, IFN-γ alone, TGF-b, IL-1b (TI) or TGF-b, IL-1b, IFN-γ (TII) treated conditions. E, Individual average fragments per kilobase of transcript per million mapped reads (FPKM) values for bulk RNA sequencing shown in D for human leukocyte antigen (HLA) HLA-DRA, HLA-DRB1, HLA-DQA1, and IL6. F, Heatmap showing the fraction of endothelial cells per cluster expressing either Irf2 or Irf8 and any MHC-II genes (left), Runx1 or Ptprc and any MHC-II gene (middle) or Runx1 or Ptprc and Irf2 or Irf8 (right). MHC-II genes are defined as shown in (Figure 1C). Cells with unique molecular identifier (UMI) >0 were counted.
Figure 4.
Figure 4.
Endothelial-specific knockdown of Ifngr1 improves ejection fraction (EF) after myocardial infarction in vivo. A, Experimental design of in vivo Ifngr1 deletion experiment. Ifngr1fl/fl were injected with endothelial-specific adeno-associated virus (AAV) to induce Cre recombinase expression 4 weeks prior to myocardial infarction. EF was assessed at baseline (day [d] 0), 2 weeks (W2) and 4 weeks (W4) postmyocardial infarction via echocardiography (Echo). B, EF of AAV-Cre treated mice at d0, W2, and W4 postmyocardial infarction (n=8, 3 female, 5 male) compared with AAV-control (n=6, 3 females, 3 males) at the same time point. One animal per group died between d0 and W2. Bars indicate mean percent±SEM for each time point, Kruskal-Wallis test. C, Delta EF at W2, and W4 compared with d0. Dots indicate mean percent±SEM for each time point. D, Representative images for echocardiography recording W4 after myocardial infarction E, Quantification of infarct size in Ifngr1fl/fl mice 4 weeks postmyocardial infarction. Bars indicate mean±SEM (control, n=5; Cre+, n=6) Mann-Whitney test. F, Quantification of fibrosis in Ifngr1fl/fl mice 4 weeks postmyocardial infarction. Bars indicate mean percent±SEM (control, n=5; Cre+, n=6) Mann-Whitney test.
Figure 5.
Figure 5.
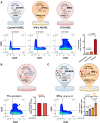
Immunomodulatory endothelial cells (IMECs) modulate T-cell activation in vitro. A, Experimental design for coculture experiments. Human umbilical cord venous endothelial cells (HUVECs) were treated with IFN-γ (interferon γ) or TGF-β (transforming growth factor β), IL-1β (interleukin 1β), IFN-γ (TII). FACS plots and bar plots showing early T cell activation, quantified by CD69+ CD25 in CD4+ cells after direct coculture of unstimulated (left) or with IFN-γ (middle), or TII (right) pretreated HUVECs. The bars show mean±SEM and fold to control, n=4 donors. Paired 2-tailed t test. B, Direct coculture of T cells with or without neutralizing antibody against HLA antigens (anti-HLA, clone Tü39) with TII HUVECs. Representative FACS (left), quantification (right). n=4 donors. C, Direct coculture of T cells with or without IL-6 and IL-12 in control and IFN-γ-treated HUVECs. Representative FACS (left), quantification (right). Tukey multiple comparison test (6 comparisons of paired 2-tailed t test), n=4 donors.
Figure 6.
Figure 6.
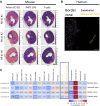
Immunomodulatory endothelial cells (IMECs) spatially colocalize with T cells. A, Integration of spatial transcriptomic data published in Yamada et al and single-cell RNA sequencing data shown in Figure 1A. We used cell2location to resolve cell clusters on spatial maps. Data shows n=3 spatial 10X Visium experiments at d1 after myocardial infarction with mappings of artery ECs (0), immunomodulatory EC (IMECs; 16) and T cells. Colors indicate abundances given a 5% confidence interval of the posterior estimations. Scale bars=1 mm. B, Representative spatial map from human border zone regions (Kuppe et al) showing EC enriched areas (purple) and pan-T-cell areas (yellow). Scale bar=1 mm. C, Colocalization scores (R2 correlation) between endothelial cells and other annotated cell types in Kuppe et al, across human remote zone (n=4), ischemic zone (n=9), border zone (n=4), and fibrotic zone (n=5) samples.

Comment in

References

    1. Gomez-Salinero JM, Itkin T, Rafii S. Developmental angiocrine diversification of endothelial cells for organotypic regeneration. Dev Cell. 2021;56:3042–3051. doi: 10.1016/j.devcel.2021.10.020 - PubMed
    1. Urbanczyk M, Zbinden A, Schenke-Layland K. Organ-specific endothelial cell heterogenicity and its impact on regenerative medicine and biomedical engineering applications. Adv Drug Deliv Rev. 2022;186:114323. doi: 10.1016/j.addr.2022.114323 - PubMed
    1. Tombor LS, John D, Glaser SF, Luxán G, Forte E, Furtado M, Rosenthal N, Baumgarten N, Schulz MH, Wittig J, et al. Single cell sequencing reveals endothelial plasticity with transient mesenchymal activation after myocardial infarction. Nat Commun. 2021;12:681. doi: 10.1038/s41467-021-20905-1 - PMC - PubMed
    1. Zeisberg EM, Tarnavski O, Zeisberg M, Dorfman AL, Mcmullen JR, Gustafsson E, Chandraker A, Yuan X, Pu WT, Roberts AB, et al. Endothelial-to-mesenchymal transition contributes to cardiac fibrosis. Nat Med. 2007;13:952–961. doi: 10.1038/nm1613 - PubMed
    1. Kovacic JC, Dimmeler S, Harvey RP, Finkel T, Aikawa E, Krenning G, Baker AH. Endothelial to mesenchymal transition in cardiovascular disease: JACC state-of-the-art review. J Am Coll Cardiol. 2019;73:190–209. doi: 10.1016/j.jacc.2018.09.089 - PMC - PubMed

MeSH terms