. 2025 Jul;15(7):250200.
doi: 10.1098/rsob.250200. Epub 2025 Jul 30.

Long-read RNA-sequencing reveals transcript-specific regulation in human-derived cortical neurons

Affiliations

Long-read RNA-sequencing reveals transcript-specific regulation in human-derived cortical neurons

Jishu Xu et al. Open Biol. 2025 Jul.

Abstract

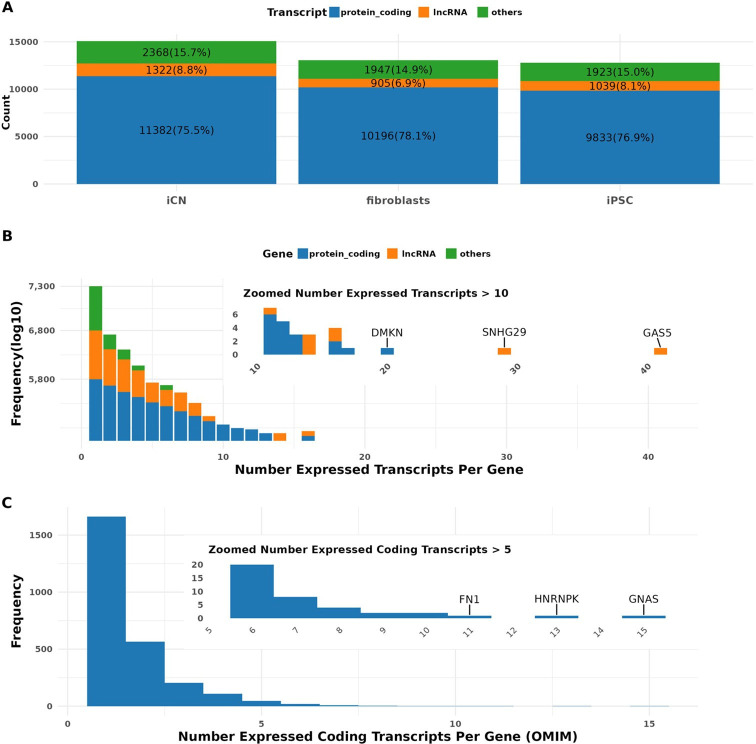
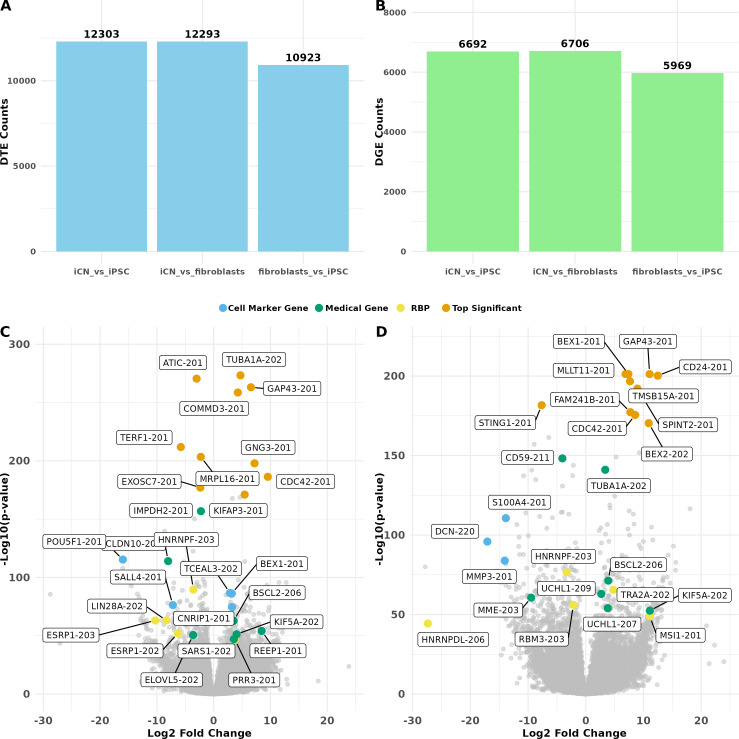
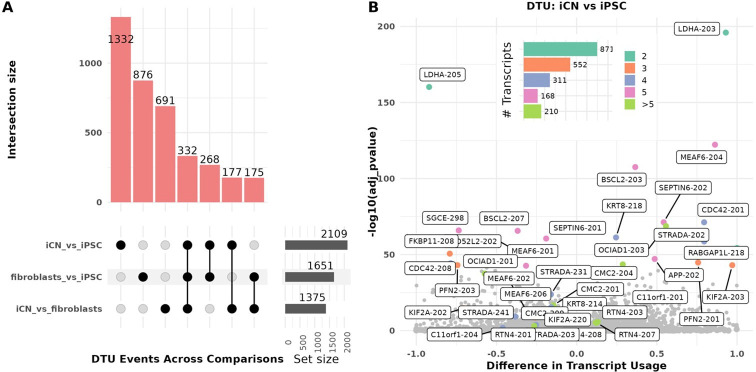
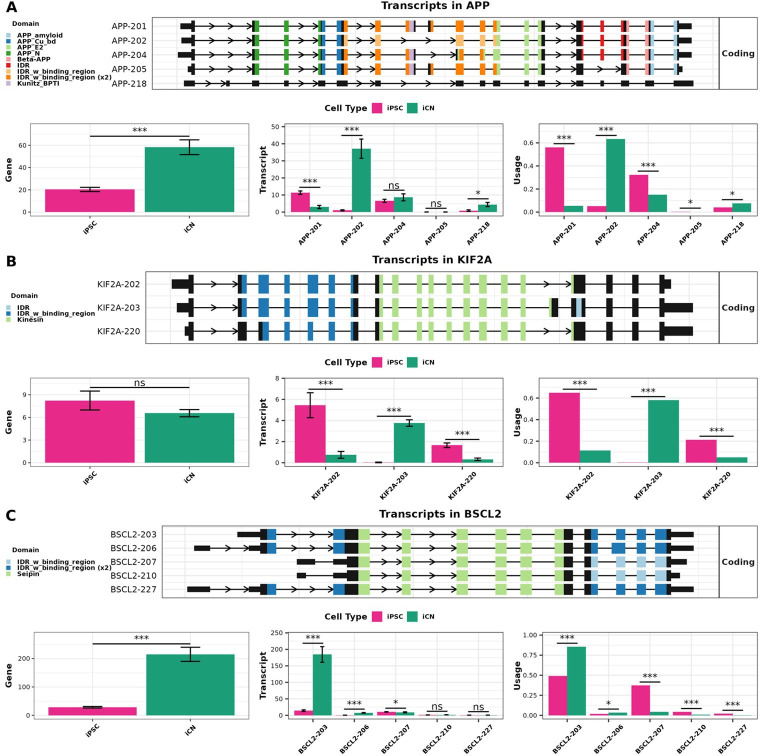
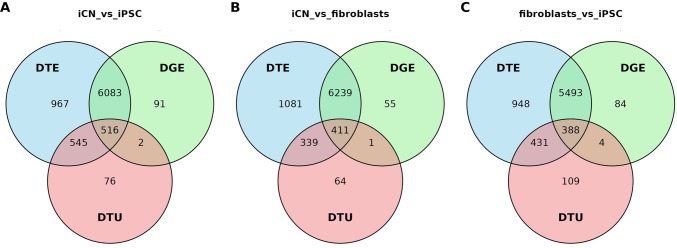
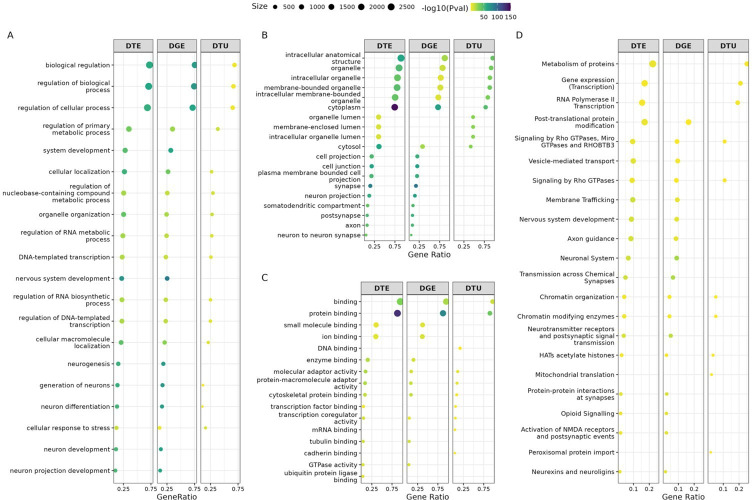
Long-read RNA sequencing has transformed transcriptome analysis by enabling comprehensive mapping of full-length transcripts, providing an unprecedented resolution of transcript diversity, alternative splicing and transcript-specific regulation. In this study, we employed nanopore long-read RNA sequencing to profile the transcriptomes of three cell types commonly used to model brain disorders, human fibroblasts, induced pluripotent stem cells and stem cell-derived cortical neurons, identifying extensive transcript diversity with 15 072 transcripts in stem cell-derived cortical neurons, 13 048 in fibroblasts and 12 759 in induced pluripotent stem cells. Our analyses uncovered 35 519 differential transcript expression events and 5135 differential transcript usage events, underscoring the complexity of transcriptomic regulation across these cell types. Importantly, by integrating differential transcript expression and usage analyses, we gained deeper insights into transcript dynamics that are not captured by gene-level expression analysis alone. Differential transcript usage analysis highlighted transcript-specific changes in disease-relevant genes such as APP, KIF2A and BSCL2, associated with Alzheimer's disease, neuronal migration disorders and degenerative axonopathies, respectively. This added resolution emphasizes the significance of transcript-level variations that often remain hidden in traditional differential gene expression analyses. Overall, our work provides a framework for understanding transcript diversity in both pluripotent and specialized cell types, which can be used to investigate transcriptomic changes in disease states in future work. Additionally, this study underscores the utility of differential transcript usage analysis in advancing our understanding of neurodevelopmental and neurodegenerative diseases, paving the way for identifying transcript-specific therapeutic targets.

Keywords: alternative splicing; human-derived cortical neurons; induced pluripotent stem cells; long-read RNA-sequencing; transcript usage; transcriptomics.


Conflict of interest statement

We declare we have no competing interests.

Figures

Transcriptome Profiling of Cultured Cells Using Long-Read RNA Sequencing
Figure 1.
Transcriptome profiling of cultured cells using long-read RNA sequencing. (A) Transcript type distribution per cell type: bar plot showing the number and proportion of expressed transcripts by biotype—protein-coding (blue), long non-coding RNAs (lncRNA, orange) and others (green)—within each cell type (iCN, fibroblasts and iPSC). Expression is defined by a threshold of TPM > 1. This panel reflects total expressed transcript counts in each cell type but does not distinguish whether transcripts are unique to a given cell type or shared across types. (B) Transcript diversity per gene: distribution of the number of expressed transcripts per gene (TPM > 1), aggregated across all cell types. Genes are categorized by transcript biotype. The inset zooms in on genes expressing more than 10 transcript isoforms, including examples such as DMKN, SNHG29 and GAS5. Note that this analysis does not resolve transcript diversity by cell type. (C) Protein-coding transcript diversity in OMIM genes: bar plot showing the number of expressed coding transcripts per gene for genes listed in the OMIM database, aggregated across all samples. Most genes express fewer than five isoforms. The inset highlights outlier genes with high isoform diversity (e.g. FN1, HNRNPK, GNAS). As in (B), this plot does not represent cell-type-specific expression but instead summarizes global transcript diversity.
Differential Expression Analysis
Figure 2.
Differential expression analysis. (A) Bar plot showing the number of differentially expressed transcript (DTE, blue) and (B) differentially expressed gene (DGE, green) events in three comparisons: iCN versus iPSC (left), iCN versus fibroblasts (middle), and fibroblasts versus iPSC (right). (C) Volcano plot for DTE of iCN versus iPSC: volcano plot displaying the log2 fold change (x-axis) against the −log10(p‐value) (y-axis) for each transcript. A set of highlighted significant DTE events (adjusted p < 0.05 and |log2FC| > 1) are selected and categorized as top high-ranking events by adjusted p‐value (orange), originating from medical-associated genes defined by OMIM (green), from RBP mRNAs (yellow), and from cell marker transcripts (blue). (D) Volcano plot for DTE of iCN versus fibroblasts: volcano plot displaying log2 fold change (x-axis) against the −log10(p‐value) (y-axis) for each transcript. A set of highlighted significant DTE events (adjusted p < 0.05 and |log2FC| > 1) are selected and categorized as top high-ranking events by p‐value (orange), originating from medical-associated genes defined by OMIM (green), from RBP mRNAs (yellow), and from cell marker transcripts (blue). Each comparison group included nine independent replicates (n = 9).
Differential Transcript Usage (DTU) Analysis Across Cell Types
Figure 3.
Differential transcript usage (DTU) analysis across cell types. (A) UpSet plot: UpSet plot illustrating the intersection of DTU events across three comparisons: iCN versus iPSC, fibroblasts versus iCN, and fibroblasts versus iPSC. The bars indicate the number of shared and unique DTU transcripts for each comparison. iPSC versus iCN comparison has the highest number of unique DTU transcripts (1332). The bar plot denotes the intersection size, circles denote which comparisons have overlap, and the set size reflects the total number of genes. (B) Volcano plot for iCN versus iPSC comparison: volcano plot showing the difference in transcript usage (x-axis) against the −log10(p‐value) (y-axis) for each transcript. Top significant DTUs are highlighted, with notable genes such as APP, KIF2A and BSCL2. Points are coloured based on the number of transcripts per gene across all cell types, as indicated by the inset bar chart (aquamarine = 2 transcripts (n = 871); orange = 3 transcripts (n = 552); purple = 4 transcripts (n = 311); pink = 5 transcripts (n = 168); green > 5 transcripts (n = 210)). This reflects the overall transcript diversity of each gene, not limited to DTU-involved isoforms. The highest frequency of DTU events occurs in genes with two expressed transcripts, followed by those with three and four transcripts. Each comparison group included nine independent replicates (n = 9).
Differential Transcript Usage Analysis for the APP, KIF2A and BSCL2 GenesFor each of the selected genes
Figure 4.
Differential transcript usage analysis for the APP, KIF2A and BSCL2 genes. For each of the selected genes (A) APP gene; (B) KIF2A gene; (C) BSCL2 gene, the top panel indicates the transcript structures based on Gencode annotation v43, with main protein domains indicated by different colours. Bottom panels: gene expression (normalized TPM) levels (left), transcript expression (normalized TPM) levels (middle), and transcript usage (right) in iPSC (pink) and iCN (green). Differential gene expression (DGE) and differential transcript expression (DTE) were analysed using DESeq2, while differential transcript usage (DTU) was analysed using DRIMSeq. Statistical significance is indicated by ns (not significant), * (p < 0.05) and *** (p < 0.001). Each comparison group included six independent replicates (n = 9) (error bars: ± lfcSE (standard error of the log2 fold change) are shown for DGE and DTE plots where applicable; for DTU, error bars are not displayed as DRIMSeq is based on a likelihood ratio framework and does not estimate standard errors or confidence intervals for transcript usage proportions).
Venn Diagrams of Differential Gene Expression (DGE), Differential Transcript Expression (DTE)
Figure 5.
Venn diagrams of differential gene expression (DGE), differential transcript expression (DTE) and differential transcript usage (DTU) across cell type comparisons. Venn diagrams illustrating the overlap between differentially expressed genes (DGE; green), differentially expressed transcripts (DTE; blue), and genes with differential transcript usage (DTU; red) in: (A) iCN versus iPSC, (B) iCN versus fibroblasts, (C) fibroblasts versus iPSC. Each circle represents one of the categories (DTE: top right; DGE: top left; DTU: bottom; red), with the numbers indicating the count of genes in each category and their intersections.
Gene Ontology (GO) Term Enrichment Analysis for DGE, DTE, and DTU in iCN
Figure 6.
Gene Ontology (GO) term enrichment analysis for DGE, DTE and DTU in iCN versus iPSC. Dot plots illustrate the top 10 terms with the best p-values for enrichment from three categories: (A) biological processes (BP), (B) cellular components (CC), and (C) molecular functions (MF) for genes identified through DGE, DTE and DTU analyses. (D) Reactome pathway for genes identified through DGE, DTE and DTU analyses. Each dot represents a specific GO term or Reactome pathway (size of dots indicate the number of associated genes; colour reflecting the −log10(p‐value), signifying the level of statistical significance).
None

Similar articles

References

    1. Mallon BS, et al. 2013. StemCellDB: the human pluripotent stem cell database at the National Institutes of Health. Stem Cell Res. 10, 57–66. ( 10.1016/j.scr.2012.09.002) - DOI - PMC - PubMed
    1. Tanabe K, Haag D, Wernig M. 2015. Direct somatic lineage conversion. Phil. Trans. R. Soc. B 370, 20140368. ( 10.1098/rstb.2014.0368) - DOI - PMC - PubMed
    1. Vierbuchen T, Wernig M. 2011. Direct lineage conversions: unnatural but useful? Nat. Biotechnol. 29, 892–907. ( 10.1038/nbt.1946) - DOI - PMC - PubMed
    1. Fowler JL, Ang LT, Loh KM. 2020. A critical look: challenges in differentiating human pluripotent stem cells into desired cell types and organoids. Wiley Interdiscip. Rev. Dev. Biol. 9, e368. ( 10.1002/wdev.368) - DOI - PMC - PubMed
    1. Gopalakrishnan S, Hor P, Ichida JK. 2017. New approaches for direct conversion of patient fibroblasts into neural cells. Brain Res. 1656, 2–13. ( 10.1016/j.brainres.2015.10.012) - DOI - PMC - PubMed

LinkOut - more resources