. 2025 Jul;292(2051):20250698.
doi: 10.1098/rspb.2025.0698. Epub 2025 Jul 30.

Seasonal contact and migration structure mass epidemics and inform outbreak preparedness in a vulnerable marine mammal

Affiliations

Seasonal contact and migration structure mass epidemics and inform outbreak preparedness in a vulnerable marine mammal

Melissa Ann Collier et al. Proc Biol Sci. 2025 Jul.

Abstract

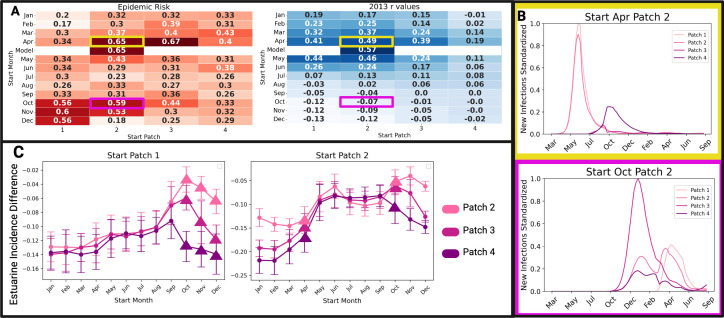
Infectious diseases have detrimental impacts across wildlife taxa. Despite this, we often lack information on the complex spatial and contact structures of host populations, reducing our ability to understand disease spread and our preparedness for epidemic response. This is also prevalent in the marine environment, where rapid habitat changes due to anthropogenic disturbances and human-induced climate change are heightening the vulnerability of marine species to disease. Recognizing these risks, we leveraged a collated dataset to establish a data-driven epidemiological metapopulation model for Tamanend's bottlenose dolphins (Tursiops erebennus), whose populations are periodically impacted by deadly respiratory disease. We found their spatial distribution and contact is heterogeneous throughout their habitat and by ecotype, which explains differences in past infection burdens. With our metapopulation approach, we demonstrate spatial hotspots for epidemic risk during migratory seasons and that populations in some central estuaries would be the most effective sentinels for disease surveillance. These mathematical models provide a generalizable, non-invasive tool that takes advantage of routinely collected wildlife data to mechanistically understand disease transmission and inform disease surveillance tactics. Our findings highlight the heterogeneities that play a crucial role in shaping the impacts of infectious diseases, and how a data-driven understanding of these mechanisms enhances epidemic preparedness.

Keywords: disease model; dolphin; marine mammal; metapopulation; migration.


Conflict of interest statement

We declare we have no competing interests.

Figures

Bottlenose dolphin strandings detected during two DMV outbreaks along the US Atlantic coastline.
Figure 1.
Bottlenose dolphin strandings detected during two DMV outbreaks along the US Atlantic coastline. During both the epidemics beginning in 1987 (left) and 2013 (right), confirmed strandings (when a sick, injured, or dead dolphin is found floating or washed ashore) of dolphins peaked in July and August along the northern part of the US Atlantic coastline, with smaller peaks in the south in October–December. While there is notable spatial heterogeneity in strandings along the coastline during both outbreaks, the spatiotemporal distribution of infections was remarkably similar between the two epidemics.
Methods and structure of the epidemiological metapopulation model for the Tamanend’s bottlenose dolphins.
Figure 2.
Methods and structure of the epidemiological metapopulation model for the Tamanend’s bottlenose dolphins. (A) We matched photos of dorsal fins across 28 photo-ID catalogues from New Jersey to Georgia to (B) establish sighting histories for 423 individuals in the warm water, migratory and cold-water seasons. (C) These sighting histories are transformed into individual time series of sighting locations over the course of a year (represented here visually as lines indicating latitudinal location by season by individual) which we algorithmically group into four clusters. (D) Using these cluster assignments and all the warm-water season sightings of individuals from the catalogues (points, coloured by cluster), we establish four ecologically relevant metapopulation patches (purple lines). (E) The average rates (and 95% CI) of migration (coastal ecotype, blue) or dispersal (estuarine ecotype, green) between the patches (known as ηs,pq) are determined by fitting a multistate capture–recapture model to individual sighting histories. (F) The average transmission rates (βss) and their 95% CI for within and between ecotypes are established with synchronized breathing contact field data. (G) The resulting epidemiological metapopulation SIR model allows individuals to move between patches based on ηs,pq, while within each patch they can move from susceptible (S) to infected (I) based on βss, and recover at recovery rate μ. Created in BioRender (https://BioRender.com/ny8vxau).
The effect of seasonality in transmission on disease dynamics.
Figure 3.
The effect of seasonality in transmission on disease dynamics. The infection time series from an epidemiological model that considers differences in the transmission rate (βss) among ecotypes and (A) only dolphin movement with no seasonal changes to βss; (B) dolphin movement with higher βss in the cold-water season due to the more efficient environmental conditions; and (C) dolphin movement and higher βss in the breeding season due to increased synchrony behaviour. We see that a model with contact structured by seasonal behaviour (C), indicated in blue, is most consistent with DMV outbreak data from the 2013 (D) and 1987 (E) epidemics based on the significantly higher Pearson’s correlation coefficient (r) of the model’s infection results to the 2013 stranding data (boxplot insets) and visual comparisons of the time series to both DMV outbreak years. Figure compiled in BioRender (https://BioRender.com/umi60zb).
The effect of movement and contact on ecotype infection burden.
Figure 4.
The effect of movement and contact on ecotype infection burden. Relative burden is the ratio of the proportion of coastal individuals infected to the proportion of estuarine individuals infected. When relative burden is equal to 1 (dotted line), there is no bias in infection burden between the two ecotypes. We controlled different components of the metapopulation structure captured in figure 2 (labelled here as fully empirical) to examine their effect on relative burden by removing heterogeneity in βss or ηpq, s estimates. We found that infection is biased towards coastal individuals in each control scenario except when there is no heterogeneity in βss among ecotypes, suggesting that this heterogeneity may be responsible for the higher coastal infection burdens observed in past DMV outbreaks. Figure compiled in BioRender (https://BioRender.com/o8ajysq).
Applying the model to inform DMV preparedness.
Figure 5.
Applying the model to inform DMV preparedness. (A) The epidemic risk values for DMV infection beginning in all possible onset scenarios and their associated Pearson’s correlation coefficients (r) to the 2013 outbreak data. These values show that outbreaks beginning in patches 1 and 2 have the highest epidemic risk, but not all of these scenarios result in the dynamics observed in past outbreaks as indicated by their low r values. For example, (B) compares two high-risk epidemic scenarios, showing that outbreaks starting in migratory season 1 (yellow) more closely resemble historic DMV epidemics than those beginning in migratory season 2 (pink). (C) To identify the optimal patch for DMV sentinel surveillance, we compared weekly infection rates among estuarine individuals in patches 2, 3 and 4 against the entire coastline’s rates for outbreaks starting in high-risk patches (1, left and 2, right). Values near zero indicate the patch best represents coastline incidence, with patch 2 emerging as optimal. Triangles mark high epidemic risk scenarios from (A), with error bars showing standard deviation. Figure compiled in BioRender (https://BioRender.com/tax8dem).

Similar articles

References

    1. McCallum H, Dobson A. 1995. Detecting disease and parasite threats to endangered species and ecosystems. Trends Ecol. Evol. 10, 190–194. ( 10.1016/s0169-5347(00)89050-3) - DOI - PubMed
    1. Daszak P, Cunningham AA, Hyatt AD. 2000. Emerging infectious diseases of wildlife: threats to biodiversity and human health. Science 287, 443–449. ( 10.1126/science.287.5452.443) - DOI - PubMed
    1. Bossard GD. 2006. Marine mammals as sentinel species for ocean and human health. Oceanography 19, 134–137. ( 10.5670/oceanog.2006.77) - DOI
    1. Heithaus MR, Frid A, Wirsing AJ, Worm B. 2008. Predicting ecological consequences of marine top predator declines. Trends Ecol. Evol. 23, 202–210. ( 10.1016/j.tree.2008.01.003) - DOI - PubMed
    1. Moore SE. 2008. Marine mammals as ecosystem sentinels. J. Mammal. 89, 534–540. ( 10.1644/07-MAMM-S-312R1.1) - DOI

LinkOut - more resources