. 2025 Jul 29:16:621-641.
doi: 10.18632/oncotarget.28759.

PCAIs stimulate MAPK, PI3K/AKT pathways and ROS-Mediated apoptosis in aromatase inhibitor-resistant breast cancer cells while disrupting actin filaments and focal adhesion

Affiliations

PCAIs stimulate MAPK, PI3K/AKT pathways and ROS-Mediated apoptosis in aromatase inhibitor-resistant breast cancer cells while disrupting actin filaments and focal adhesion

Jassy Mary S Lazarte et al. Oncotarget. .

Abstract

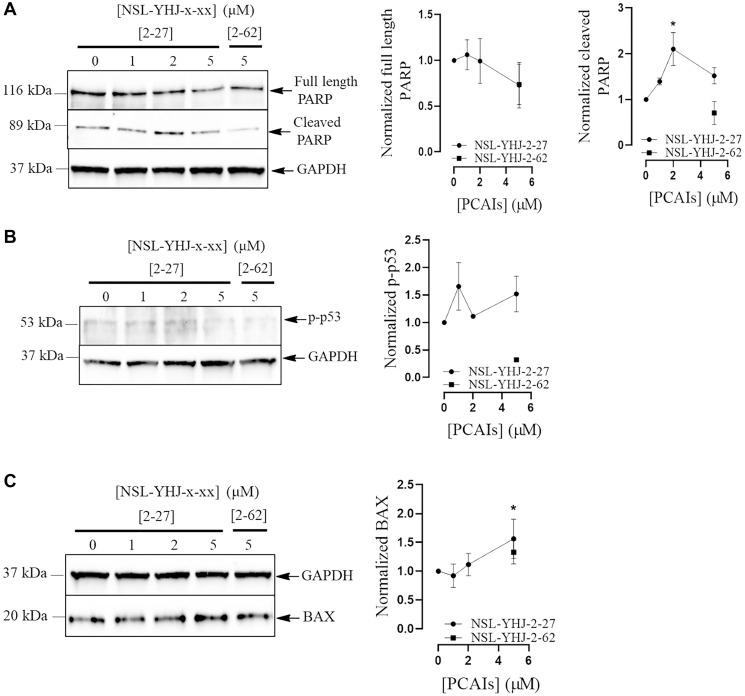
The estrogen receptor is overexpressed in and promotes 67-80% and 90% of female and male breast cancer cases, respectively. Hormone independence, enhanced motility, and signaling by growth factors have been attributed to aromatase inhibitor (AI) resistance and MAPK pathway activation. We used long-term letrozole-treated (LTLT-Ca) breast cancer cells to evaluate polyisoprenylated cysteinyl amide inhibitors (PCAIs) as potential therapies for AI-resistant breast cancer. PCAIs specifically disrupt G-proteins such as KRAS, an upstream regulator of MAPK and PI3K/AKT pathways. PCAIs were tested against the viability, phosphorylation of MAPK and PI3K/AKT pathways, apoptosis, and migration of LTLT-Ca cells. NSL-YHJ-2-27 was potent against LTLT-Ca viability with an EC50 of 4.8 μM. MEK (p-MEK1/2), ERK (p-ERK1/2), and p90RSK (p-p90RSK) phosphorylation were significantly increased by 2-, 2-, and 6.4-fold, respectively. PCAIs increased AKT phosphorylation 36-fold. NSL-YHJ-2-27 at 2, 3 and 5 μM stimulated ROS generation by 4-, 8- and 10-fold, respectively. PCAIs inhibited cell proliferation and colony formation by 95% and 74%, respectively, increased active caspase 7 and BAX 1.5-fold and 56%, respectively. NSL-YHJ-2-27 (10 μM) induced LTLT-Ca spheroid degeneration by 61%. LTLT-Ca cell migration was inhibited by 31 and 80% following treatment with 2 and 5 μM NSL-YHJ-2-27, respectively. NSL-YHJ-2-27 disrupted F-actin filaments, vinculin punctates and levels by 33%. These results indicate that the PCAIs' activation of the MAPK and PI3K/AKT pathways causes apoptosis, possibly through proapoptotic p-p90RSK isoforms, AKT-induced ROS production or anoikis through disruption of focal adhesion. These effects against LTLT-Ca cells suggest potential PCAIs therapeutic applications against antihormonal-resistant breast cancers.

Keywords: LTLT-Ca cells; MAPK; PCAIs; PI3K/AKT; ROS.


Conflict of interest statement

CONFLICTS OF INTEREST

The authors declare no conflicts of interest. The funders had no role in the design of the study, in the collection of data, analyses, or interpretation of data, in the writing of the manuscript, or in the decision to publish the results.

Figures

Figure 1
Figure 1. PCAIs inhibit the viability and proliferation of AI-resistant LTLT-Ca breast cancer cells.
(A) LTLT-Ca cells were treated with the indicated concentrations of respective agents for 48 h. The resazurin reduction assay was performed to determine cell viabilities as described in the methods section. The EC50 values were obtained from nonlinear regression plots. (B) Cells were grown in 6-well plates and treated with the indicated concentrations of PCAIs. After treatment, images of the cells were captured using the Keyence microscope at 20× magnification (Scale bar = 100 μm). (C) The cells were then trypsinized and viable cells were counted using Countess II automated cell counter. Data are representative of three independent experiments. Statistical significance (* p < 0.05; ** p < 0.01; *** p < 0.001) was determined by one-way ANOVA with post hoc Dunnett’s test.
Figure 2
Figure 2. NSL-YHJ-2-27 stimulates the phosphorylation of MAPK and AKT pathway enzymes in AI-resistant cells.
LTLT-Ca cells were treated with the indicated concentrations of NSL-YHJ-2-27 or the non-farnesylated analog, NSL-YHJ-2-62 for 48 h. They were then lysed and analyzed by western blotting as described in the methods section. Data are representative of three independent experiments. Statistical significance (* p < 0.05; *** p < 0.001; **** p < 0.0001) was determined by one-way ANOVA with post hoc Dunnett’s test.
Figure 3
Figure 3. NSL-YHJ-2-27 stimulates the generation of ROS in LTLT-Ca.
(A) LTLT-Ca cells were treated with 0, 0.5, 1, 2, 3 and 5 μM of NSL-YHJ-2-27 for 24 h. Cells were washed with 1 X PBS and DCFH-DA working solution was introduced and incubated for 45 mins. Fluorescent images of the ROS production in LTLT-Ca were captured with the Keyence BZ-X800 series microscope at 10X magnification. (B) Quantification of mean fluorescent intensities was done with Keyence BZ-800 analyzer. The mean fluorescence intensities against varying concentration was plotted using GraphPad Prism. One-Way ANOVA was used to determine statistical significance between increasing concentration of NSL-YHJ-2-27 and mean fluorescence intensities (** p < 0.01, *** p < 0.001). Data is representative of triplicated experiments.
Figure 4
Figure 4. PCAIs effects on HER2 and ERα levels.
LTLT-Ca cells were treated with (0-5 μM) concentrations of NSL-YHJ-2-27 or (5 μM) of the non-farnesylated analog, NSL-YHJ-2-62 for 48 h. They were then lysed and analyzed for p-ERα and HER2 levels by western blotting as described in the methods section. Data are representative of three independent experiments. Statistical significance (* p < 0.05) was determined by one-way ANOVA with post hoc Dunnett’s test.
Figure 5
Figure 5. NSL-YHJ-2-27 depletes RAC1 and CDC42 levels in LTLT-Ca cells.
LTLT-Ca cells were treated with the indicated concentrations of NSL-YHJ-2-27 or the non-farnesylated analog, NSL-YHJ-2-62 for 48 h. They were then lysed and analyzed by western blotting as described in the methods section. Data are representative of three independent experiments. Statistical significance (* p < 0.05; ** p < 0.01) was determined by one-way ANOVA with post hoc Dunnett’s test.
Figure 6
Figure 6. NSL-YHJ-2-27 causes the disintegration of compact 3D LTLT-Ca spheroids and caspase activation in cells.
LTLT-Ca cells were seeded in 96U round bottom Nunclon Sphera plate and left to grow for 48 h to form compact spheroids. The compact spheroids were then treated with the indicated concentrations of NSL-YHJ-2-27 and analyzed for 144 h. Spheroids were cultured and treated in triplicates. (A) Brightfield images of the spheroids were captured at different time points. (B) The spheroids were stained with 10 μg/mL of AO/EB dye mixture at 144 h post-PCAIs treatment and images captured at 4× magnification using Nikon Ti Eclipse microscope (scale bars = 100 μm). Note that the brightfield images taken at 144 h are aligned with the AO/EB-stained images for easier visualization only. (C) The fluorescence intensity of both dyes was determined using NIS Element software. The mean AO/EB intensity ratios (equivalent to the viable/dead cells) were calculated, representative of three different independent experiments. (D) Western blotting for caspase 7 was performed after lysing LTLT-Ca cells and full length and cleaved caspase levels determined. Three independent experiments were conducted. (E). Cells were stained on 8-well μ slide plates (ibidi) after NSL-YHJ-2-27 (0–5 μM) treatments in triplicates using CaspaTagTM caspase-3/7 kit. The fluorescence intensities were measured with the Keyence BZ-X800 fluorescence microscope, analyzed using Keyence BZ-X800 analyzer software. (F) Mean fluorescence intensities per cell against respective concentration of NSL-YHJ-2-27 were plotted using Graph Pad Prism. Statistical significance (* p < 0.05; ** p < 0.01) was determined by one-way ANOVA with post hoc Dunnett’s test.
Figure 7
Figure 7. NSL-YHJ-2-27 alter the levels of apoptotic markers.
LTLT-Ca cells were treated with the indicated concentrations of NSL-YHJ-2-27 or the non-farnesylated analog, NSL-YHJ-2-62 for 48 h. They were then lysed and analyzed by western blotting for full length and cleaved PARP (A), phosphorylated p53 (B), and BAX protein levels (C) as described in the methods section. Data are representative of three independent experiments. Statistical significance (* p < 0.05; ** p < 0.01) was determined by one-way ANOVA with post hoc Dunnett’s test.
Figure 8
Figure 8. NSL-YHJ-2-27 inhibits LTLT-Ca colony formation.
(A, B) Cells were initially grown in 25 cm2 flasks and treated with the indicated concentrations of PCAIs. Then, 1000 cells from the respective flasks were seeded onto a 6-well plate and left to grow for 12 days. These were then fixed and stained as described in the methods section. (C) Colonies with more than 20 cells were counted and the survival fractions were calculated and plotted. Significance was calculated from three independent experiments. Statistical significance (*** p < 0.001) was determined by one-way ANOVA with post hoc Dunnett’s test.
Figure 9
Figure 9. NSL-YHJ-2-27 inhibits LTLT-Ca cells migration and LTLT 3D spheroids.
(A) The ‘wound’ was formed using cell culture inserts (ibidi) and were grown to confluency in a 24-well plate. These were then treated with the indicated concentrations of PCAIs. Cell culture and treatments were done in triplicates and closure of the wound was monitored for 24 h, capturing images at 0 and 24 h using the Nikon Ti Eclipse microscope at 4x magnification (scale bar = 100 μm). (B) The cells that migrated into the wound were counted and plotted against concentration. Statistical significance (* p < 0.05, *** p < 0.001) was determined by one-way ANOVA with post hoc Dunnett’s test (C) LTLT-Ca preformed spheroids in experimental media were treated with the (0, 1, 2, 5, 10 and 15 μM) concentrations of NSL-YHJ-2-27. PCAIs-treated Matrigel was then added to the spheroids and allowed to solidify for 30 minutes. Images were then taken at 0 h and every 24 h for seven days, using a Nikon Ti Eclipse microscope at 4X magnification. Time-dependent changes in spheroid invasion regions were measured for each treatment concentration and quantified using NIS-Elements AR version 4.30. (D) The area invaded by the spheroids at each concentration was measured and plotted against time points. Invasion area against concentration of PCAIs at each time point was analyzed with Two-Way ANOVA with Dunnett’s posthoc test, statistical significance (* p < 0.05).
Figure 10
Figure 10. PCAIs treatment collapses actin filaments and delocalizes focal adhesion proteins.
Cells were grown in 8-well ibidi μ-slides overnight and treated with the respective concentrations of PCAIs for 48 h, then fixed and permeabilized. Images of the cells treated with 0 and 5 μM NSL-YHJ-2-27 are shown at higher magnification whereby yellow arrows indicating retracting lamellipodia indicative of collapsing actin filaments. (A) Triplicates of the fixed cells were stained with Alexa Fluor 568 Phalloidin for actin filaments. Yellow arrows indicate retracting lamellipodia indicative of the collapsing actin filaments (magnified images). (B) Vinculin punctates were probed using vinculin antibody and visualized using rabbit IgG Alexa Fluor 555 conjugate. White arrows indicate vinculin punctates. (C) Fascin was probed with fascin antibody and visualized using mouse IgG Alexa Fluor 488. White arrows indicate defined fascin spots. Images were captured using Keyence BX-X800 microscope at 40X magnification. (D) Cells treated for 48 h with the indicated concentrations of NSL-YHJ-2-27 or 5 μM of the non-farnesylated PCAIs analog, NSL-YHJ-2-62. Lysis of the cells and analysis by western blotting for vinculin and fascin were conducted as described in the methods. Western blot images and plots of chemiluminescence intensities of the bands following quantification using Image Lab Software normalized against GAPDH against concentration. Data are representative of three independent experiments. Statistical significance (** p < 0.01 in relation to the negative control, 0 μM) was determined by one-way ANOVA with post hoc Dunnett’s test.

Similar articles

References

    1. Key TJ. Hormones and cancer in humans. Mutat Res. 1995; 333:59–67. 10.1016/0027-5107(95)00132-8. - DOI - PubMed
    1. Drummond AE, Swain CTV, Brown KA, Dixon-Suen SC, Boing L, van Roekel EH, Moore MM, Gaunt TR, Milne RL, English DR, Martin RM, Lewis SJ, Lynch BM. Linking Physical Activity to Breast Cancer via Sex Steroid Hormones, Part 2: The Effect of Sex Steroid Hormones on Breast Cancer Risk. Cancer Epidemiol Biomarkers Prev. 2022; 31:28–37. 10.1158/1055-9965.EPI-21-0438. - DOI - PMC - PubMed
    1. Yager JD, Davidson NE. Estrogen carcinogenesis in breast cancer. N Engl J Med. 2006; 354:270–82. 10.1056/NEJMra050776. - DOI - PubMed
    1. Tremont A, Lu J, Cole JT. Endocrine Therapy for Early Breast Cancer: Updated Review. Ochsner J. 2017; 17:405–11. - PMC - PubMed
    1. Goldhirsch A, Wood WC, Coates AS, Gelber RD, Thürlimann B, Senn HJ, and Panel members. Strategies for subtypes--dealing with the diversity of breast cancer: highlights of the St. Gallen International Expert Consensus on the Primary Therapy of Early Breast Cancer 2011. Ann Oncol. 2011; 22:1736–47. 10.1093/annonc/mdr304. - DOI - PMC - PubMed

MeSH terms

Substances