. 2025 Oct 6;222(10):e20250161.
doi: 10.1084/jem.20250161. Epub 2025 Jul 30.

Early and opposing neutrophil and CD4 T cell responses shape pulmonary tuberculosis pathology

Affiliations

Early and opposing neutrophil and CD4 T cell responses shape pulmonary tuberculosis pathology

Benjamin H Gern et al. J Exp Med. .

Abstract

Pulmonary Mycobacterium tuberculosis (Mtb) infection results in a variety of heterogeneous lesion structures, from necrotic granulomas to alveolitis, but the mechanisms regulating their development remain unclear. Using a mouse model of concomitant immunity and subsequent aerosol infection, we demonstrate that counter regulation between neutrophils and CD4 T cells occurs very early during infection and governs these distinct pathologies. In primary Mtb infection, a dysregulated feed-forward circuit of neutrophil recruitment occurs, in which neutrophils hinder CD4 T cell interactions with infected macrophages, cause granuloma necrosis, and establish a replicative niche that drives a two-log increase in lung bacterial burden. Conversely, the rapid recruitment and activation of T cells due to concomitant immunity promotes local macrophage activation and dampens detrimental neutrophil responses. Together, these studies uncover fundamental determinants of tuberculosis lung pathology, which have important implications for new strategies to prevent or treat tuberculosis.


Conflict of interest statement

Disclosures: The authors declare no competing interests exist.

Figures

None
Graphical abstract
Figure 1.
Figure 1.
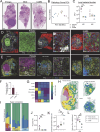
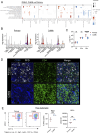
Pre-existing immunity abrogates the formation of necrotic granulomas. (A–C) d98 after CD infection (n = 5 per group). (A) Representative histology images of lung sections. Scale bar: 1 mm. (B) PCA of pathology scores. (C) Mtb lung burden in primary, BCG, and CoMtb groups. (D–L) d35 after ULD infection (n= 10 primary, 5 CoMtb). (D) Representative confocal microscopy images demonstrating preserved alveolar integrity in non-necrotic primary and CoMtb lesions. Scale bar: 500 μm; zoom: 50 μm. (E) Representative confocal microscopy images depicting major cell populations within lesions. Scale bar: 500 μm; zoom: 50 μm. (F) Percent of mice with necrotic lesions, covers two independent experiments. (G) Heatmap showing cellular composition of clustered microenvironments. (H) Representative map showing 50 µm neighborhoods, color-coded microenvironment. Scale bar: 500 μm. (I) Percent area of lesion comprised by each microenvironment. Uninvolved regions (gray) not included. (J) Percent of lesion comprised by necrotic region (pink). (K) Ratio of lymphoid (blue and green) to myeloid (yellow, orange, and pink) predominant regions. (L) Relative density of PPD signal per 50 µm2 neighborhood. Single-group comparisons by Mann–Whitney U test. *P < 0.05, **P < 0.01, ***P < 0.001, ****P < 0.0001, and ns, P ≥ 0.05. Error bars (F) reflect 95% confidence intervals. Points represent individual mice or lesions from individual mice. Data are representative of one (A–C) or two (D–L) independent experiments with at least four mice per group. See also Fig. S1. PCoA, principal coordinate analysis
Figure S1.
Figure S1.
Related to Fig. 1 . Pre-existing immunity abrogates the formation of necrotic granulomas: (A) Lesion zoom-ins from Fig. 1 A. Scale bar: 1 mm. (B) PCA loadings from Fig. 1 B. (C) Representative confocal images showing necrotic debris in center of primary necrotic lesion and intact nuclei surrounded by p120 staining within lesion formed in setting of CoMtb. Scale bar: 50 μm. (D) Representative confocal images of markers used for analysis in Fig. 1. Scale bar: 25 μm. (E) Histo-cytometry gating scheme to determine cell types for analysis in Fig. 1, G–K. Scale bar: 500 μm; zoom: 100 μm.
Figure 2.
Figure 2.
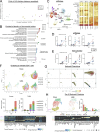
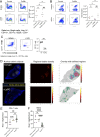
CoMtb alters the immune landscape following Mtb infection. (A and B) d35 after ULD infection, n = 8. (A) PCoA analysis of ROI transcriptomes, colored by lesion type (necrotic versus non-necrotic, 3 ROIs per point) or location (uninvolved, 1 ROI per point). (B) GSEA analysis showing enriched pathways per lesion type. (C–E) Multiple time points after CD infection. (C) UMAP depicting cell types identified by scRNAseq analysis of lung parenchymal cells, heatmap showing cellular abundance, numbers reflect the median number of cells per thousand. (D) Proportions of selected cell populations over time, scRNAseq. (E) Numbers of selected cell populations over time, flow cytometry. (F) UMAP depicting clusters within activated CD4+ cell cluster from C, heatmap showing the top 10 discriminatory genes. (G) Pseudotime analysis showing neutrophils across time points. (H) UMAP depicting clusters within d34 neutrophils from C, as well as heatmap showing the top 10 discriminatory genes. Points represent individual lesions (A, 3 ROIs samples per lesion, 1 per uninvolved area) and individual mice (D–F). False discovery rate–adjusted P values determined using the R fgsea package. Single-group comparisons by t test. Data are representative of one (A–D and F–H) or two (E) independent experiments with at least four mice per group. See also Fig. S2. UMAP, uniform manifold approximation and projection.
Figure S2.
Figure S2.
Related to Fig. 2 . CoMtb alters the immune landscape following Mtb infection. (A) Top 50 differentially expressed genes for necrotic and non-necrotic lesions in Fig. 2 A. (B) Top genes that discriminate scRNAseq clustering into the specific cell types in Fig. 2 C. (C) Pulmonary bacterial burdens corresponding to Fig. 2 E. (D) Lymphoid flow cytometry gating scheme for Fig. 2 E. (E) Myeloid flow cytometry gating scheme for Fig. 2 E. (F) Neutrophil pseudotime analysis showing differentially expressed genes within low (<25), intermediate (25–75), and high (>75) groups. Single-group comparisons by unpaired t test. *P < 0.05, ****P < 0.0001, and ns, P ≧ 0.05. Correlations by Pearson’s correlation test.
Figure 3.
Figure 3.
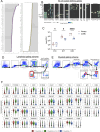
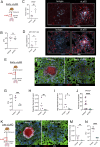
CoMtb accelerates T cell and MDC activation, blunts neutrophil responses. Multiple time points after CD infection. (A) GSEA analysis showing pathways enriched following aerosol infection at days 10, 17, and 34 p.i., in the setting of primary infection and CoMtb. (B) Predicted strength of selected T cell to myeloid cell signaling interactions quantified using CellChat. (C) Predicted strength of significant neutrophil to MDC interactions using CellChat. (D) Predicted strength of significant neutrophil to T cell interactions using CellChat. (E) Predicted strength of significant neutrophil to neutrophil chemotactic interactions using CellChat. (F) Levels of IFN and CXCL2, measured by Luminex. False discovery rate-adjusted P values determined using the R fgsea package. Dots in B–E indicate strength is significantly higher compared with a null distribution (i.e., CellChat-reported P value <0.05). *P < 0.05, and ns, P ≥ 0.05. Single-group comparisons in D and F by t test. Data are representative of one (A–E) or two independent experiments (F) experiments with at least four mice per group. See also Fig. S3. FDR, false discovery rate.
Figure S3.
Figure S3.
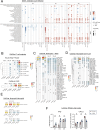
CoMtb shapes early immune cell responses. (A–C) Related to Fig. 3: CoMtb accelerates T cell and MDC activation, blunts neutrophil responses. (A) GSEA analysis comparing CoMtb to primary Mtb infection across time points, corresponding to Fig. 3 A. (B)Ifng expression at d10 in our scRNAseq dataset, across all major cell types. (C) Pulmonary bacterial burdens corresponding to Fig. 3 F. FDR determined by the R fgsea package. Single-group comparisons by unpaired t test. (D and E) Related to Fig. 4. CoMtb shapes early tuberculous lesion cellularity and organization. (D) 1–2 color images from identical ROIs are shown in T cell panels in Fig. 4 A depicting density of CD4 T cells surrounding PPD in the lesions of primary and CoMtb mice. Scale bar: 50 μm. (E) Flow cytometry determination of the proportion and MFI of MHCII in MDCs, data from Fig. 2 E. Single-group comparisons by unpaired t test. **P < 0.01, ***P < 0.001, ****P < 0.0001, and ns, P ≧ 0.05. FDR, false discovery rate.
Figure 4.
Figure 4.
CoMtb shapes early tuberculous lesion cellularity and organization. d17 after CD infection, n = 5 per group. (A) Representative confocal images showing lesions and zoom-ins highlighting T cells, MDCs, and neutrophils. Scale bar: 200 μm; zoom: 50 μm. 1–2 color images from T cell regions are shown in Fig. S3 D. (B) Relative cellular density of specified cell types within lesions as determined by histo-cytometry. (C) Ratio of PPD+ neutrophils to PPD+ macrophages. (D) PPD MFI of PPD+ neutrophils. (E) Pearson correlation coefficients of the indicated cell populations within microenvironments. (F) Confocal image and spots/neighborhood of p120 staining. Scale bar: 50 μm. Single-group comparisons by unpaired t test. *P < 0.05, **P < 0.01, ***P < 0.001, ****P < 0.0001, and ns, P ≥ 0.05. Correlations by Pearson’s correlation test. Points represent individual lesions. Data are representative of two independent experiments with at least four mice per group. See also Fig. S3.
Figure 5.
Figure 5.
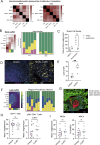
CD4 T cells are required for CoMtb-mediated protection from lesion necrosis. (A) Experimental outline. Subset of mice received CoMtb, then all mice aerosol infected with CD Mtb. Mice then received αCD4-depleting antibody or isotype from d-1 until harvest. n = 3–5 per group. (B) Representative confocal images showing presence of necrosis with αCD4 administration. Scale bar: 200 μm. (C) Pulmonary bacterial burdens. (D) Representative map showing 50 µm2 neighborhoods, color-coded microenvironment, and heatmap showing cellular composition of clustered microenvironments. Scale bar: 1 mm. (E) Percent area of lesion comprised by each microenvironment. Uninvolved regions (gray) not included. (F) Percent of lesion comprised by necrotic region (pink). Single-group comparisons by Mann–Whitney U test. *P < 0.05, ***P < 0.001, ****P < 0.0001, and ns, P ≥ 0.05. Points represent individual mice. Data are representative of two independent experiments with at least four mice per group. See also Fig. S4.
Figure S4.
Figure S4.
CD4 T cell and neutrophil deplation shape lesion composition. (A and B) Related to Fig. 5. CD4 T cells are required for CoMtb-mediated protection from lesion necrosis. (A) Representative flow plots and CD4 T cell enumeration following αCD4-depleting antibody administration. (B) Representative flow plots and neutrophil enumeration following αCD4-depleting antibody administration. Single-group comparisons by unpaired t test. (C–F) Related to Fig. 6: Neutrophils drive lesion necrosis. (C) Representative flow plots and neutrophil enumeration following αLy6G-depleting antibody administration. Also demonstrates concordance of CD177 and Ly6G in an Mtb-infected lung. (D) Validation of necrotic regions with nuclear debris objects. Scale bar: 1 mm. (E) Quantitative imaging determination of CD4+ T cell density within lesions. (F) Quantitative imaging determination of MDC density within lesions. Single-group comparisons by unpaired t test. **P < 0.01, ***P < 0.001, ****P < 0.0001, and ns, P ≧ 0.05.
Figure 6.
Figure 6.
Neutrophils drive lesion necrosis. (A) Experimental outline for A–H. Mice received CD aerosol infection, then were administered αLy6G-depleting antibody or isotype from d7–d28, lungs were taken on d29. (B) Representative confocal images showing abrogation of necrosis with αLy6G administration. Scale bar: 150 μm. (C) Pulmonary bacterial burdens. (D) Representative map showing 50 µm2 neighborhoods, color-coded microenvironment, and heatmap showing cellular composition of clustered microenvironments Scale bar: 1 mm. (E) Percent area of lesion comprised by each microenvironment. Uninvolved regions (gray) not included. (F) Percent lesion (any color) of total lung area. (G) Percent of lesion comprised by necrotic region (pink). (H) Representative confocal images and quantification showing increased pS6+ T cells following αLy6G administration. Scale bar: 50 μm. (I) Representative confocal images and quantification showing increased MHCII+ in MDCs following αLy6G administration. Scale bar: 50 μm. Single-group comparisons by unpaired t test (C and F) or Mann–Whitney U test (G–I). *P < 0.05, **P < 0.01, ***P < 0.001, and ns, P ≥ 0.05. Points represent individual mice. Data are each representative of three independent experiments with at least four mice per group. See also Fig. S4.
Figure 7.
Figure 7.
Neutrophils shape lesions throughout infection. (A) Experimental outline for B–D. Mice received CD aerosol infection, then were administered αLy6G-depleting antibody or isotype from d7–d15, lungs were taken on d15. (B) Pulmonary bacterial burdens. (C) Representative confocal images and quantification showing increased MHCII+ in MDCs following αLy6G administration. Scale bar: 50 μm. (D) Representative confocal images and quantification showing increased pS6+ T cells following αLy6G administration. Scale bar: 50 μm. (E) Experimental outline for F–I. Mice received CD aerosol infection, then were administered αLy6G-depleting antibody or isotype from d7–d15, lungs were taken on d43. (F) Representative confocal images showing abrogation of necrosis with “early” αLy6G administration. Scale bar: 250 μm. (G) Pulmonary bacterial burdens. (H) Percent of lesion comprised by necrotic region (pink). (I) Percent of lesion comprised by microenvironments with high neutrophil density. (J) Proportion of lesion neutrophils that express CXCL2. (K) Experimental outline for L–N. Mice received CD aerosol infection, then were administered αLy6G-depleting antibody or isotype from d28–d49, lungs were taken on d50. (L) Representative confocal images showing decreased necrosis with “late” αLy6G administration. Scale bar: 250 μm. (M) Percent of lung area comprised by necrotic region (pink). (N) Pulmonary bacterial burdens. Single-group comparisons by unpaired t test (B–D, G, and N) or Mann–Whitney U test (H–J and M). *P < 0.05, **P < 0.01, ***P < 0.001, ****P < 0.0001, and ns, P ≥ 0.05. Points represent individual mice. Data are each representative of two independent experiments with at least four mice per group. See also Fig. S5.
Figure S5.
Figure S5.
Related to Fig. 7 . Neutrophils shape lesions throughout infection. (A) Pearson correlation coefficients of the indicated cell populations within lesion microenvironments. (B) Heatmap showing cellular composition of clustered microenvironments and percent area of lesion comprised by each microenvironment, uninvolved regions not included, corresponding to Fig. 7 E. (C) Density of MDCs and neutrophils within lesions. (D) Representative confocal microscopy image showing CXCL2 staining (magenta). Scale bar: 50 μm. (E) Quantitative imaging determination of CD11b MFI within neutrophils. (F) Heatmap showing cellular composition of clustered microenvironments and percent area of lesion comprised by each microenvironment, uninvolved regions not included, corresponding to Fig. 7 J. (G) Confocal microscopy image of one small necrotic lesion with low antigen abundance, identified following late Ly6G depletion. Single-group comparisons by unpaired t test. Scale bar: 250 μm. (H) Quantitative imaging determination of CD4+ T cell and pS6+ CD4+ T cell density within lesions. (I) Quantitative imaging determination of MDC density and MHCII positivity within lesions. Single-group comparisons by unpaired t test. *P < 0.05, **P < 0.01, and ns, P ≧ 0.05.

Update of

References

    1. Allwood, B.W., Byrne A., Meghji J., Rachow A., Van Der Zalm M.M., and Schoch O.D.. 2021. Post-tuberculosis lung disease: Clinical review of an under-recognised global challenge. Respiration. 100:751–763. 10.1159/000512531 - DOI - PubMed
    1. Barrios-Payán, J., Aguilar-León D., Lascurain-Ledezma R., and Hernández-Pando R.. 2006. [Neutrophil participation in early control and immune activation during experimental pulmonary tuberculosis]. Gac Med. Mex. 142:273–281. - PubMed
    1. Bekker, L.-G., Beyrer C., Mgodi N., Lewin S.R., Delany-Moretlwe S., Taiwo B., Masters M.C., and Lazarus J.V.. 2023. HIV infection. Nat. Rev. Dis. Primers. 9:42. 10.1038/s41572-023-00452-3 - DOI - PubMed
    1. Benator D., Bhattacharya M., Bozeman L., Burman W., Cantazaro A., Chaisson R., Gordin F., Horsburgh C.R., Horton J., Khan A., et al. 2002. Rifapentine and isoniazid once a week versus rifampicin and isoniazid twice a week for treatment of drug-susceptible pulmonary tuberculosis in HIV-negative patients: A randomised clinical trial. Lancet. 360:528–534. 10.1016/S0140-6736(02)09742-8 - DOI - PubMed
    1. Blomgran, R., and Ernst J.D.. 2011. Lung neutrophils facilitate activation of naive antigen-specific CD4+ T cells during Mycobacterium tuberculosis infection. J. Immunol. 186:7110–7119. 10.4049/jimmunol.1100001 - DOI - PMC - PubMed

MeSH terms