. 2025 Jul 30;21(7):e1013380.
doi: 10.1371/journal.ppat.1013380. eCollection 2025 Jul.

VapC toxins promote the pathogenesis of Rickettsia heilongjiangensis by cleaving essential RNAs from both Rickettsia and its host

Affiliations

VapC toxins promote the pathogenesis of Rickettsia heilongjiangensis by cleaving essential RNAs from both Rickettsia and its host

Yan Liu et al. PLoS Pathog. .

Abstract

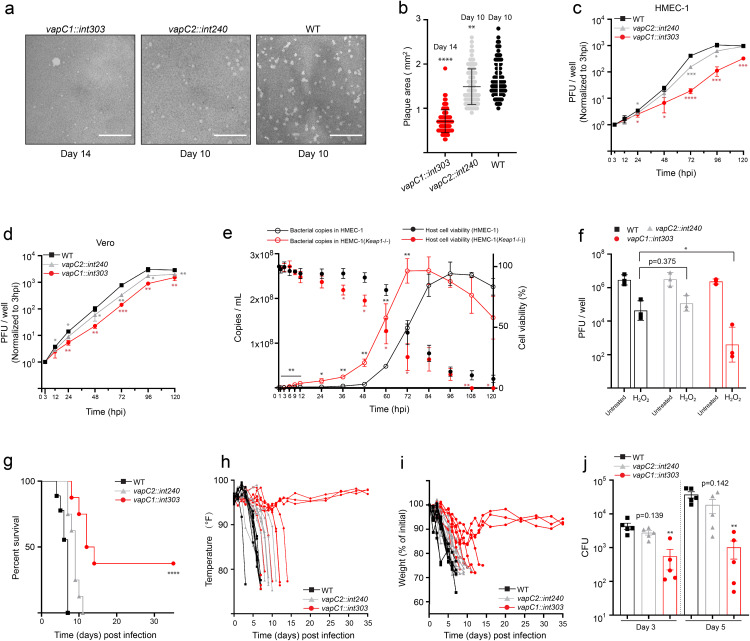
Toxin-antitoxin (TA) modules enable bacteria to persist under stressful environments. However, they are typically absent from host-associated prokaryotes due to their potential host toxicity. Here, the obligate intracellular bacterium spotted fever group (SFG) rickettsiae, which causes mild to severe human illness, was shown to harbor two vapBC TA modules. One of the vapBC modules (vapBC1) is crucial for Rickettsia to withstand accumulated host reactive oxidative species (ROS), via induction of bacterial dormancy through cleavage on the anti-codon loop of tRNAfMet, thereby facilitating intracellular survival and infection in a mouse model. Another vapBC module (vapBC2) was found to be activated and toxin exposed to host cytoplasm, contributing to Rickettsia's virulence and adaptability in its human host by non-specifically degrading host rRNAs rather than regulating rickettsial growth. Recognition of these rickettsial effectors contributes to understanding the intracellular adaptability and pathogenicity of all host-associated pathogens that harbor TA modules.


Conflict of interest statement

The authors have declared that no competing interests exist.

Figures

Fig 1
Fig 1. The transcription of two Rh-B8 vapBC modules was activated during the early infection.
(a) Chromosomal location of 5 intact TA modules in Rh-B8. (b) Growth curves and host cell viability during the infection of Rh-B8 in HMEC-1 cell lines (MOI = 0.1). A magnified view of the bacterial growth within the first 48 hours was shown in the inset. (c) and (d) Genomic localization of two vapBC TA modules and their transcription level during bacterial growth. Gene transcription levels were measured after normalization to levels of ompB. The data was shown as the fold change in comparison to 0 hpi. Data with the mean ± SD are from n = 3 independent experiments, each with three technical replicates.
Fig 2
Fig 2. The toxin-antitoxin interaction patterns of Rh-B8 VapBC modules.
(a) The amino acid sequences of Rh-B8 VapBC modules. The secondary structure elements were annotated based on the predicted 3D structure, with β-sheets labeled as ‘S’, α-helices as ‘H’, and irregular loop regions as ‘L’. Conserved acidic residues of the “catalytic triad” in VapC were indicated in red. The region of the “pseudo-palindromic” sequence in VapB1 was underlined. The disordered C-terminus of VapB antitoxin was indicated using dashed lines. (b) and (c) Schematic representation of wild and truncated VapB1 and VapB2 fused to an N-terminal GST tag. (d) VapC1 binding to GST-VapB1. Lane 1, GST without VapC1; lane 2, GST with VapC1; lanes 3–8, GST fused to wild-type and truncated mutants of VapB1 with VapC1, as indicated above each lane; lane 9, VapC1. (e) VapC2 binding to GST-VapB2. Lane 2, GST without VapC2; lane 3, GST with VapC2; lanes 4–13, GST fused to wild-type and truncated mutants of VapB2 with VapC2, as indicated above each lane; lane 14, VapC2.
Fig 3
Fig 3. Oxidative stress activates vapBC modules.
(a) and (b) Transcripts level of vapBC modules upon stress stimulation at 12 hpi, for 3, 6, 9, 12, and 24 hours, respectively. The relative transcription level was quantified upon exposure to oxidative stress (H2O2), nitrosative stress (NO2-), nutrient limitation (NL), Rifampin (Rif), or Chloramphenicol (Chl). Gene transcription levels were measured after normalization to levels of ompB. The data was shown as the fold change in comparison to 0 hpi. Bar represents the mean ± SD from n = 3 independent experiments. (c) and (d) Transcripts level of vapB upon H2O2 exposure for 3, 6, 9, 12, and 24 hours, at 12, 24, 48, or 72 hpi, respectively. Data at each time point represents the mean value from n = 3 independent experiments, each with three technical replicates. (e) and (f) Transcript levels of vapBC modules during early infection in wild-type HMEC-1 cells versus Keap1-deficient (Keap1-/-) cells with impaired ROS production. Data represent mean ± SD from three independent experiments. Statistical significance (*p < 0.1, **p < 0.01) was determined by unpaired t-test comparing Keap1-/- to wild-type HMEC-1 controls. (g) Reactive oxygen species (ROS) abundance in HMEC-1 cell lines upon Rh-B8 infection at an MOI of 0.1. ROS levels were measured and expressed as ratios relative to time-matched untreated cells. Data with the mean ± SD are from n = 3 independent experiments (* p < 0.1, ** p < 0.01, *** p < 0.001 relative to time-matched SPG-treated sample, p-value calculated using an unpaired t-test (two-tailed)). (h) GSH abundance in HMEC-1 upon Rh-B8 infection from metabolism analysis (n = 10 independent experiments). (i) GSH amounts in HMEC-1 upon SPG treatment and Rh-B8 infection were quantified using the DTNB method. Data with the mean ± SD are from n = 3 independent experiments (* p < 0.1, ** p < 0.01, *** p < 0.001 relative to time-matched SPG-treated sample, p-value calculated using an unpaired t-test (two-tailed)). (j) The protein level of host antioxidant enzymes, including glutathione peroxidase (GSH-Px), glutathione reductase (GSR), superoxide dismutase (SOD) 1/2, and catalase from HMEC-1 at indicated time points upon infection of Rh-B8. OmpB from Rh-B8 was used to indicate bacterial growth. (k) and (l) In vitro cleavage assay on VapB antitoxins by purified Lon protease. Lanes 2-5 in (k) and lanes 1, 3-6 in (l) represent GST and GST-fused VapB truncates used as indicators for the cleavage products, which were shown in lanes 6-8 of (k) for VapB1, lanes 7-9 of (l) for VapB2.
Fig 4
Fig 4. vapBC modules are crucial for the infection and multiplication of Rh-B8 in host cells and mouse models.
(a) Representative images of plaques stained with neutral red at 10 days post-infection (dpi) (WT and vapC2::int240 strain) and 14 dpi (vapC1::int303 strain). Scale bar 10 mm. (b) Plaque areas in HMEC-1 monolayer infected with WT (10 dpi), vapC1::int303 strain (14 dpi), and vapC2::int240 strain (10 dpi) (n = 2 independent experiments; WT n = 97 plaques, vapC1::int303 strain n = 90 plaques, vapC2::int240 strain n = 106 plaques). All data points were shown, with the bar representing mean ± SD (* p < 0.1, ** p < 0.01, *** p < 0.001, **** p < 0.0001 relative to WT strain, p-value calculated using an unpaired t-test (two-tailed)). (c) and (d) Bacterial abundance of WT, vapC1::int303, and vapC2::int240 strains in (c) HMEC-1 and (d) Vero cell lines (n = 3 independent experiments), MOI = 0.1. Data are mean values with ± SD; * p < 0.1, ** p < 0.01, *** p < 0.001, **** p < 0.0001 relative to WT strain, p-values were calculated using two-tailed unpaired t-test. (e) Growth kinetics and host cell viability during infection with WT Rh-B8 strain in HMEC-1 and HMEC-1 (Keap1-/-) cells at MOI = 0.1. Data represent mean ± SD from three independent experiments. Statistical significance (*p < 0.1, **p < 0.01) was determined by two-tailed unpaired t-test comparing Keap1-/- to wild-type HMEC-1 cells. (f) Susceptibility of WT, vapC1::int303, and vapC2::int240 strains to H2O2 exposure (100 μM) for 24 hours, MOI = 5.0. Data are mean values with ± SD obtained from n = 3 independent experiments, each with three technical replicates. (g) Survival of Ifnar1-/- mice infected with WT, vapC1::int303 and vapC2::int240 strain. Data were analyzed using a log-rank (Mantel-Cox) test, **** p < 0.0001. (h) Temperature changes over time in Ifnar1-/- mice infected with WT, vapC1::int303, and vapC2::int240 strain; data from individual mice were shown (n = 8 mice for WT, n = 9 mice for vapC2::int240, n = 8 mice for vapC1::int303, n = 2 independent experiments). (i) Weight change over time in Ifnar1-/- mice infected with WT, vapC1::int303, and vapC2::int240 strain, data from individual mice were expressed as percent change from initial weight. (j) The bacterial loads were determined using qPCR with collected spleen homogenates after intravenous infection. The data in these panels are mean ± SD of log10 CFU obtained from 5 infected mice per group. ** p < 0.01 relative to WT strain, p-values are calculated using an unpaired t-test (two-tailed).
Fig 5
Fig 5. Effect of Rh-B8 VapCs’ expression on bacterial growth.
(a) The growth rates of E. coli K-12 cells carrying pBAD-VapC1 and pACYCDuet-1-VapB1 under different induction conditions. Cultures were grown in the LB medium at 37 °C. At time zero, pBAD-VapC1 was induced with 0.2% L-arabinose, and pACYCDuet-1-VapB1 was induced with 0.5 mM IPTG. (b) The growth rates of E. coli carrying pBAD-VapC2 and pACYCDuet-1-VapB2 under different induction conditions were compared as described in (a). (c) and (d) Rates of translation (c) and transcription (d) of E. coli K-12 cells carrying the pBAD empty vector, pBAD-VapC1, or pBAD-VapC2. E. coli K-12 were grown exponentially in M9 minimal medium at 37 °C. Samples at indicated time points were collected and pulsed with [35S]methionine (c) or [3H]uracil (d). At time zero, culture was induced with 0.2% arabinose. Data were normalized according to the A600 value at each time point and plotted relative to the value at -5 min (rates of translation or transcription were set to 100%). The data shown were averages of three independent experiments with resulting ± SD. (e) The bacterial abundance of WT (square) and strain expressing wild-type VapC2 (circle) or inactive mutant VapC2D6A (triangle) in HMEC-1 cell lines (solid lines), and the corresponding host cell viability (dashed lines). Data shown are the mean values from 3 independent experiments with resulting ± SD; * p < 0.1, ** p < 0.01, *** p < 0.001 relative to WT strain, p-values were calculated using an unpaired t-test. (f) Representative images of plaques formed by wild-type strain Rh-B8 and strain expressing VapC2 or VapC2D6A. Scale bar 10 mm. (g) Plaque areas in HMEC-1 cells infected with WT, VapC2WT, and VapC2D6A expressing strain (n = 2 independent experiments; WT n = 95 plaques, a strain expressing VapC2WT n = 98 plaques, a strain expressing VapC2D6A n = 90 plaques). All data points were shown with the bar representing mean ± SD (**** p < 0.0001 relative to WT strain, p-value calculated using an unpaired t-test).
Fig 6
Fig 6. VapC1 cleaves the anti-codon loop of tRNAfMet in Rh-B8.
(a) Analysis of total RNA from E. coli upon induction of VapC1. E. coli harboring pBAD-VapC1 and pBAD-VapC1D6A were grown in the LB medium, and transcription was induced at time zero by adding L-arabinose (0.2%). VapC20 from M. tuberculosis (Mtb-VapC20) was used as a control. Cell samples were collected at the indicated time points (min). Total RNA extracted from the samples was separated on a 6% denaturing polyacrylamide gel and visualized by ethidium bromide staining. The cleavage products by wild-type VapC1 were indicated with a dashed box, and the Mtb-VapC20 cleavage products were indicated with an arrow. (b) Counts of tRNA fragments identified from RNA-seq. (c) Secondary structure diagrams of tRNAfMet identified as potential VapC cleavage products. The arrows indicate the site of cleavage based on sequencing results. (d) Sequence alignment of E. coli tRNAfMet and Rh-B8 tRNAfMet-1 and tRNAfMet-2. The anticodon sequences were underlined. The different sequences of Rh-B8 tRNAfMet were shown in bold font. (e) Analysis of total small RNA from Rh-B8 after incubation with purified VapC1. VapC1 was inactivated by phenol/chloroform extraction and 1 μg of extracted RNA was detected on an 8% denaturing polyacrylamide gel and visualized by ethidium bromide staining. (f, g) Northern blot analysis of VapC1-mediated tRNA cleavage, as outlined in (e). Probes were specific to (f) tRNAfMet-1 and tRNAfMet-2, and (g) tRNAAsp, tRNAThr and tRNAGly. Control reactions included excess purified VapB1 antitoxin (lane 3) and EDTA (lane 4). Cleavage products are marked with arrows. (h) Northern blot analysis was performed on total small RNA extracted from Rh-B8 at selected post-infection time points using probes specific for tRNAfMet-1 and tRNAfMet-2. 5S rRNA served as the loading control. (i) Densitometric quantification of target tRNA bands shown in (h) normalized to 5S rRNA levels (mean ± SD; *p < 0.1, **p < 0.01, ***p < 0.001 vs. 0 hpi; unpaired t-test).
Fig 7
Fig 7. Rh-B8 VapCs degrades rRNAs from human cells.
(a) GSK-tagged inactive VapC1 mutant and wild-type VapC2 and GSK-tagged GFP were expressed in Rh-B8. Samples were collected at 24, 48, and 72 hpi (MOI = 5.0). The samples were immunoblotted to detect total GSK-tagged protein with an anti-GSK epitope tag antibody and the GSK-tagged protein upon exposure to host cytosolic kinases with a specific anti-phospho-GSK antibody. GFP-GSK was used as a non-secreted protein control and did not show reactivity with the anti-phospho-GSK antibody. (b) The effect of expression of wild-type VapCs and the inactive mutants in HEK293 cell lines after transformation for 12 hours. The bright field (BF) images show cytopathic effects upon VapCs’ expression. Co-expressed GFP protein was used as a marker for exogenous gene expression. Scale bar, 10 μm. (c) Western blot to show the protein expression of VapC and GFP as described in (b). After co-expression of GFP and inactive VapC mutants for 12 hours, the cell lysates were used as a control. (d) Cell viability upon expression of wild-type VapCs and the inactive mutants. Data represent the mean ± SD of three independent biological replicates (** p < 0.01, *** p < 0.001 vs. time-matched VapC mutants; two-tailed unpaired t-test). (e) and (f) Agarose gel analysis of total RNA extracted from HEK293 cells upon expression of VapC1 and VapC2. (g) and (h) Total RNA isolated from HMEC-1 was incubated with purified VapCs showing rRNA degradation. The mixture was subjected to a 4.5% denaturing polyacrylamide gel and visualized by ethidium bromide staining. The rRNA degradation could be visualized, while 28S rRNA cannot be separated on the gel due to the large molecular size. (i) Reactive oxygen species (ROS) levels in HMEC-1 cells infected with WT and mutant Rh-B8 strains. ROS abundance was quantified and normalized to time-matched untreated controls. Data represent the mean ± SD of three independent biological replicates (* p < 0.1, ** p < 0.01, *** p < 0.001 vs. time-matched WT strain; two-tailed unpaired t-test). (j) Protein levels of host antioxidant enzymes in HMEC-1 cells following vapC1::int303 strain infection. Expression of glutathione peroxidase (GSH-Px), glutathione reductase (GSR), superoxide dismutase (SOD1/2), and catalase were assessed at indicated time points post-infection. Bacterial growth was monitored via Rh-B8 OmpB levels.
Fig 8
Fig 8. Proposed model for the stress response regulation by vapBC modules.
Under host oxidative crisis, VapC1, which is upregulated in the expression during the early rickettsial infection via degradation of VapB1 antitoxins by Lon protease, cleaves rickettsial initiator tRNAfMet, thereby inducing persisters. VapC2 could be exposed to host cytoplasm and impair host anti-infection response by degrading host rRNAs. See also the discussion for details.

Similar articles

References

    1. Narra HP, Sahni A, Walker DH, Sahni SK. Recent Research Milestones in the Pathogenesis of Human Rickettsioses and Opportunities Ahead. Future Microbiol. 2020;15(9):753–65. doi: 10.2217/fmb-2019-0266 - DOI - PMC - PubMed
    1. Dantas-Torres F. Rocky Mountain spotted fever. The Lancet Infectious Diseases. 2007;7(11):724–32. doi: 10.1016/s1473-3099(07)70261-x - DOI - PubMed
    1. Rovery C, Raoult D. Mediterranean Spotted Fever. Infectious Disease Clinics of North America. 2008;22(3):515–30. doi: 10.1016/j.idc.2008.03.003 - DOI - PubMed
    1. He M, Zhang L, Hu H, Liu X, Zhang C, Xin Y, et al. Complete genome sequencing and comparative genomic analyses of a new spotted-fever Rickettsia heilongjiangensis strain B8. Emerging Microbes & Infections. 2023;12(1). doi: 10.1080/22221751.2022.2153085 - DOI - PMC - PubMed
    1. Walker DH, Ismail N. Emerging and re-emerging rickettsioses: endothelial cell infection and early disease events. Nat Rev Microbiol. 2008;6(5):375–86. doi: 10.1038/nrmicro1866 - DOI - PubMed

LinkOut - more resources