. 2025 Aug;11(31):eadv8896.
doi: 10.1126/sciadv.adv8896. Epub 2025 Jul 30.

A trehalase-derived MAMP triggers LecRK-V-mediated immune responses in Arabidopsis

Affiliations

A trehalase-derived MAMP triggers LecRK-V-mediated immune responses in Arabidopsis

Erika Iino et al. Sci Adv. 2025 Aug.

Abstract

Plant-parasitic nematodes (PPNs) cause major agricultural losses worldwide, yet the molecular basis of plant immunity against these pathogens remains poorly understood. To investigate how plants recognize PPNs, we aimed to identify microbe-associated molecular patterns (MAMPs) from nematodes and the corresponding plant immune components. Because of the limited availability of material from obligate PPNs, we used Caenorhabditis elegans, a free-living nematode, as a MAMP source. C. elegans extract activated MAMP-triggered immune responses in Arabidopsis Col-0. Through chromatography-based purification, we identified a secreted trehalase and pinpointed a conserved peptide region essential for its MAMP activity. A corresponding peptide from root-knot nematode trehalase enabled the identification of lectin receptor kinases LecRK-V.5 and LecRK-V.6 as key components in immune induction. Notably, this peptide region is conserved across some phytophagous insects and fungal pathogens, with LecRK-Vs required for immune responses to these peptides, highlighting the role of LecRK-V-mediated mechanism for broad-spectrum pathogen detection via trehalase-derived peptides.


Figures

Fig. 1.
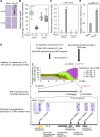
Fig. 1.. Purification and characterization of MAMPs from C. elegans.
(A and B) C. elegans extract (100 μg/ml) triggers MAMP-inducible responses in Arabidopsis Col-0, including CYP71A12 expression (A) and root pigmentation (B). CYP71A12 expression was assessed using the cerk1 fls2 pCYP71A12:GUS line. Scale bars, 100 μm. Each treatment included four seedlings, and experiments were repeated at least three times with consistent results. (C) Venn diagram showing genes up-regulated [log2fold change (log2FC) ≥ 1, adjusted P ≤ 0.01] in efr fls2 cerk1 triple mutants treated with C. elegans and M. incognita extract (100 μg/ml, 12 hours). (D) Genes up-regulated by C. elegans extract substantially overlap with those induced by flg22 (25) and chitin (26). (E) Workflow for MAMP identification from C. elegans extract via chromatography and LC-MS/MS. (F) Sequence alignment of trehalase-derived peptides from C. elegans and plant-parasitic nematodes (PPNs). Red lines mark predicted substrate-binding residues; asterisks indicate essential residues for MAMP activity (see fig. S9). Amino acids are color-coded by chemical properties. Secreted trehalase gene models in M. incognita were manually refined to correct annotation errors (figs. S6 to S8). (G to I) 50 μM TreCe24 and TreMi31 peptides induce CYP71A12 expression (G), root pigmentation (H), and seedling growth inhibition (I) in Col-0. Scale bars, 100 μm. Box plots show median (line), interquartile range (box), range (whiskers), and mean (cross); individual points represent eight biological replicates. Different letters indicate significant differences [P ≤ 0.00001, one-way analysis of variance (ANOVA) with Tukey’s test]. Each treatment included four seedlings, and experiments were repeated at least three times with consistent results. (J) Venn diagram showing genes up-regulated (log2FC ≥ 1, adjusted P ≤ 0.01) in Col-0 treated with TreMi31 (50 μM, 12 hours), overlapping with genes induced by C. elegans and M. incognita extract. (K) TreMi31-induced genes substantially overlap with those induced by flg22 (25) and chitin (26).
Fig. 2.
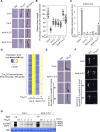
Fig. 2.. Identification of the genomic region conferring TreMi31 insensitivity in Cvi-0.
(A to C) Cvi-0 is insensitive to TreMi31, unlike Col-0. Col-0 seedlings, but not Cvi-0, display root pigmentation (A), growth inhibition (B), and CYP71A12 expression (C) upon treatment with 50 μM TreMi31. Four seedlings were analyzed per treatment. Scale bars, 100 μm. Box plots show median (line), interquartile range (box), range (whiskers), and mean (cross); individual points represent 10 biological replicates; different letters denote significant differences (P ≤ 0.05, one-way ANOVA with Tukey’s test). In (C), CYP71A12 transcript levels were measured by reverse transcription quantitative polymerase chain reaction (RT-qPCR) after 6 hours of 50 μM TreMi31 treatment, normalized to the U-box housekeeping transcript AT5G15400. Data represent means ± SE of three technical replicates; different letters denote significant differences (P ≤ 0.05, one-way ANOVA with Tukey’s test). Experiments were repeated three times with consistent results. (D) Whole-genome sequencing of insensitive F2 individuals from Col-0 × Cvi-0 crosses and phenotyping of RILs revealed a genomic region on chromosome 3 associated with TreMi31 insensitivity (fig. S18). SNP substitution ratios [Cvi-0/(Col-0 + Cvi-0)] were averaged within 0.05-Mb windows and color-coded by frequency (30 to 50%, 50 to 70%, 70 to 90%, and 90 to 100%). The closest marker identified was C3_22147, with C3_20729 as the second closest. Sanger sequencing narrowed the candidate region to 78 kb between At3g59690 and At3g59890, encompassing 20 genes (table S10). T-DNA insertion screening identified lecrk-V.5 (SALK_133163: lecrk-V.5-3) as showing reduced TreMi31 sensitivity (table S11). Four seedlings were analyzed per treatment. Scale bars [(A) and (D)], 100 μm. (E) TreMi31 induces LecRK-V.5 expression. Transcript levels were measured by RT-qPCR after 6 hours of 40 μM TreMi31 treatment, normalized to AT5G15400. Two seedlings per treatment in each biological replicate. Data represent means ± SE of three biological replicates; asterisks indicate significant differences (***P ≤ 0.001, Student’s t test).
Fig. 3.
Fig. 3.. lecrk-V.5 mutants have defects in TreMi31 signaling.
(A to C) lecrk-V.5-3 mutants show reduced responses, whereas lecrk-V.5-2 mutants show no response to TreMi31. Col-0, but not Cvi-0 or lecrk-V.5-2, displayed root pigmentation (A), growth inhibition (B), and CYP71A12 expression (C) upon treatment with 50 μM TreMi31, while all genotypes responded to 2 μM SCOOP12. Four seedlings were analyzed per treatment. Scale bars, 100 μm. Box plots show median (line), interquartile range (box), range (whiskers), and mean (cross); individual points represent 10 biological replicates; different letters denote significant differences (P ≤ 0.01, one-way ANOVA with Tukey’s test). In (C), CYP71A12 transcript levels were measured by RT-qPCR after 6 hours of 50 μM TreMi31, normalized to the U-box housekeeping transcript AT5G15400. Values represent means ± SE of three technical replicates, with different letters indicating significant differences (P ≤ 0.05, one-way ANOVA with Tukey’s post hoc test). Experiments were repeated three times with consistent results. (D) RNA-seq shows reduced induction of TreMi31-upregulated genes (logFC ≥1, adjusted P ≤ 0.01) in lecrk-V.5-3 compared to Col-0 after 12 hours of 30 μM TreMi31 treatment. (E and F) Expression of LecRK-V.5-3xHA under its native promoter rescues root pigmentation (E) and growth inhibition (F) in lecrk-V.5-2 mutants treated with 50 μM TreMi31. T2 complementation lines with the transgene were used for the assay, and homozygous individuals were retrospectively identified on the basis of T3 segregation. At least four confirmed homozygous seedlings were analyzed per treatment. Scale bars, 100 μm (E) and 1 cm (F). Experiments were repeated three times with consistent results. (G) Col-0, but not lecrk-V.5-2, showed slow, sustained MAPK activation upon 50 μM TreMi31 treatment. The flg22 (1 μM) served as a positive control. Experiments in (E) to (G) were repeated three times with consistent results.
Fig. 4.
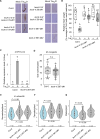
Fig. 4.. LecRK-V.5 and LecRK-V.6 are involved in TreMi31 recognition.
(A) Root pigmentation upon 50 μM TreMi31 treatment is reduced in the CRISPR deletion line lecrk-V.5-3/lecrk-V.78-d and absent in lecrk-V.567-d and lecrk-V.8/lecrk-V.56-d mutants. Black bars represent 100 μm. (B and C) lecrk-V.567-d mutants fail to show seedling growth inhibition (B) or induction of CYP71A12 expression (C) in response to 50 μM TreMi31. Box plots show median (line), interquartile range (box), range (whiskers), and mean (cross); individual points represent 10 biological replicates; different letters denote significant differences (P ≤ 0.01, one-way ANOVA with Tukey’s test). In (C), transcript levels of CYP71A12 were measured by RT-qPCR after 6 hours of treatment, normalized to the U-box housekeeping transcript AT5G15400. Two seedlings were used per treatment per replicate. Data represent means ± SE of three biological replicates; different letters indicate significant differences (P ≤ 0.0001, one-way ANOVA with Tukey’s post hoc test). Experiments were repeated three times with consistent results. (D) Nematode infection assay using M. incognita (~80 J2s per plant) revealed no significant difference (n.s.) in gall formation between lecrk-V.567-d mutants and Col-0 plants (n = 30, Student’s t test). Experiments were repeated three times with consistent results. (E to G) Number of total (E), female (F), and male (G) H. schachtii CNs per root system at 14 days post-infection (dpi) after inoculation with ~80 J2s per plant. Violin plots show kernel density estimates (polygons), box limits (25th and 75th percentiles), median (thick line), whiskers extending to ≤1.5× the interquartile range (IQR), and outliers (dots). Data shown are from one representative experiment out of three independent experiments with consistent results. To account for environmental variation, data were analyzed using a best linear unbiased estimators model (R v4.2.1, lme4 package); pairwise differences were assessed using the emmeans package and added manually.
Fig. 5.
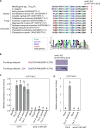
Fig. 5.. LecRK-V.5 and LecRK-V.6 are involved in the recognition of trehalase peptides from phytophagous insects and pathogenic fungi.
(A) Sequence alignment of trehalase peptides from C. elegans, M. incognita, phytophagous insects, fungi, and oomycetes, with their MAMP activities determined via the CYP71A12 expression assay using TreCe19 (fig. S9A). The sequence logo highlights conserved residues in MAMP active peptides from nematodes (fig. S11A), insects, and fungi. Trehalases in Hyaloperonospora brassicae (AI5734068.1) and Albugo laibachii (CCA17719.1) do not have signal peptides predicted by SignalP-6.0 (*). Amino acid residues highlighted in gray differ in properties from those found in MAMP active peptides. (B) A charge-reverse substitution of the third glutamic acid residue to lysine (E3K) in a MAMP-inactive trehalase peptide from A. laibachii restores MAMP activity. CYP71A12 expression was analyzed upon treatment with 50 μM peptide in the cerk1 fls2 pCYP71A12:GUS line. Black bars represent 100 μm. (C and D) Col-0 seedlings, but not the lecrk-V.567-d line, show CYP71A12 expression in response to trehalase-derived peptides from insects (C) and fungi (D). Transcript levels of CYP71A12 in the seedlings upon treatment with 50 μM trehalase-derived peptides were measured by RT-qPCR after normalization to the U-box housekeeping transcript AT5G15400. Data represent means ± SE of three biological replicates, with different letters indicating significant differences (P ≤ 0.0001, one-way ANOVA with Tukey’s post hoc test). Experiments were repeated three times with consistent results.

References

    1. Jones J. T., Haegeman A., Danchin E. G., Gaur H. S., Helder J., Jones M. G., Kikuchi T., Manzanilla-Lopez R., Palomares-Rius J. E., Wesemael W. M., Perry R. N., Top 10 plant-parasitic nematodes in molecular plant pathology. Mol. Plant Pathol. 14, 946–961 (2013). - PMC - PubMed
    1. M. R. Khan, in Novel Biological and Biotechnological Applications in Plant Nematode Management, M. R. Khan, Ed. (Springer Nature Singapore, Singapore, 2023), pp. 3–45.
    1. Molloy B., Baum T., Eves-van den Akker S., Unlocking the development- and physiology-altering ‘effector toolbox’ of plant-parasitic nematodes. Trends Parasitol. 39, 732–738 (2023). - PubMed
    1. Siddique S., Grundler F. M., Parasitic nematodes manipulate plant development to establish feeding sites. Curr. Opin. Microbiol. 46, 102–108 (2018). - PubMed
    1. Couto D., Zipfel C., Regulation of pattern recognition receptor signalling in plants. Nat. Rev. Immunol. 16, 537–552 (2016). - PubMed

MeSH terms

Substances

LinkOut - more resources