. 2025 Aug;11(31):eadu3700.
doi: 10.1126/sciadv.adu3700. Epub 2025 Jul 30.

Low-dose metformin requires brain Rap1 for its antidiabetic action

Affiliations

Low-dose metformin requires brain Rap1 for its antidiabetic action

Hsiao-Yun Lin et al. Sci Adv. 2025 Aug.

Abstract

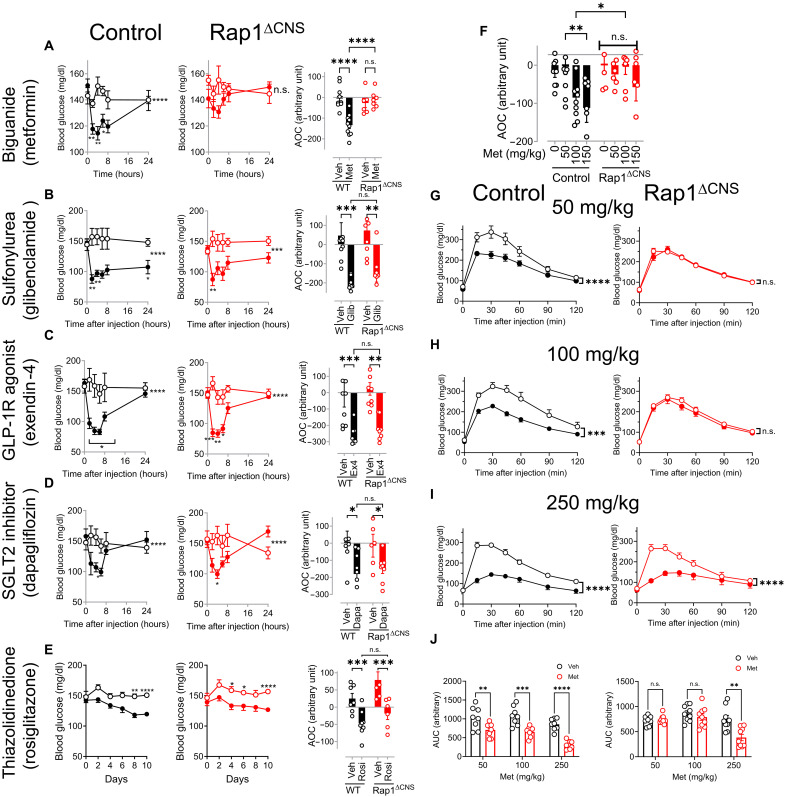
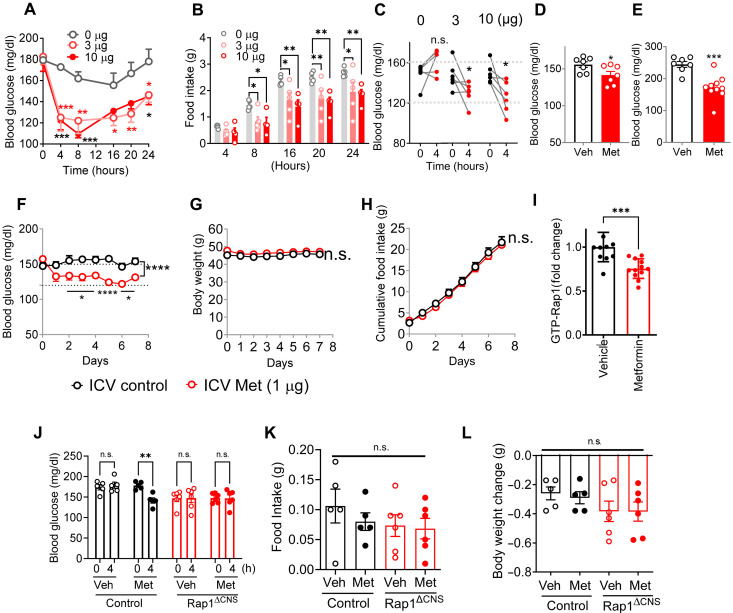
Metformin is the most commonly prescribed antidiabetes drug, yet its precise mechanism of action remains controversial. Previous studies have suggested that metformin acts peripherally by reducing hepatic glucose output and altering gut functions. Here, we report a neural mechanism via the small guanosine triphosphatase Ras-related protein 1 (Rap1). Mice with forebrain-specific Rap1 knockout exhibited resistance to the antidiabetic effects of low-dose metformin while remaining sensitive to other antidiabetic agents. Centrally administered metformin inhibited brain Rap1 and reduced hyperglycemia. Conversely, forced activation of brain Rap1 increased glycemia and abolished the glycemic effect of metformin. Metformin activated a specific subset of neurons in the ventromedial hypothalamic nucleus (VMH) that requires Rap1. Both loss-of-function and gain-of-function studies suggest that VMH Rap1 is indispensable for the antidiabetic effects of metformin. These findings highlight the VMH Rap1 pathway as a critical mediator of metformin action.


Figures

Fig. 1.
Fig. 1.. Rap1ΔCNS mice are resistant to the glycemic effect of low-dose metformin.
(A to E) Blood glucose levels in control (left; control; n = 8 to 10) and Rap1ΔCNS (middle; Rap1ΔCNS; n = 6 to 7) mice after a single injection of US Food and Drug Administration (FDA)–approved antidiabetic agents. The area of the curve (AOC) of metformin-induced glucose lowering (right). Metformin (A) (100 mg/kg, ip; 39 weeks of HFD) lowered blood glucose in control mice but not in Rap1ΔCNS mice. Acute glucose lowering was observed in both mice receiving glibenclamide (B) (1 mg/kg, ip; 39 weeks of HFD), exendin-4 (C) (0.1 mg/kg, ip; 40 weeks of HFD), dapagliflozin (D) [20 mg/kg, per os (p.o.); 45 weeks of HFD], or rosiglitazone (E) (10 mg/kg, ip; 40 weeks of HFD; note: glucose lowering was observed only after chronic treatment in mice). Open circles: vehicle-treated mice; closed circles: drug-treated mice. Glib, glibenclamide; GLP-1R, GLP-1 receptor; Ex4, exendin-4; Dapa, dapagliflozin; Rosi, rosiglitazone. (F) Dose-dependent glucose lowering by metformin in control and Rap1ΔCNS mice (n = 6 to 10; HFD for 39 to 42 weeks). The data show the AOC of metformin-induced glucose lowering. Metformin was administered at various doses (0 to 150 mg/kg, ip), and blood glucose levels were measured over 24 hours as shown in (A) to (E). The AOC was calculated to determine the overall glucose-lowering effect of metformin. (G to J) Glucose tolerance was assessed in control and Rap1ΔCNS mice by administering a bolus of glucose (1.5 g/kg), 30 min after an injection of metformin (0 to 250 mg/kg, ip; n = 8 to 9; HFD for 59 weeks). The area under the curve (AUC) is the area under the glucose tolerance test (GTT) curve (J). *P < 0.05, **P < 0.01, ***P < 0.001, and ***P < 0.0001 by two-way analysis of variance (ANOVA) followed by Šídák’s multiple-comparison test or uncorrected Fisher’s least significant difference (LSD) test.
Fig. 2.
Fig. 2.. Centrally administered metformin reduces blood glucose levels without affecting food intake or body weight.
(A) Acute ICV injection of metformin (3 and 10 μg) reduced blood glucose levels in DIO mice (n = 4 to 5). (B) Food intake of mice as in (A). (C) ICV metformin–induced glucose lowering in the absence of food (n = 6). (D and E) Glucose lowering by ICV metformin (3 μg) in STZ/DIO mice (D) (16 hours; n = 7) or ob/ob mice (E) (4 hours; n = 7 to 10). (F to H) Low dose of metformin reduced blood glucose levels (F) but did not change body weights (G) and cumulative food intake (H) when infused into the brain of DIO C57BL/6J mice (1 μg; n = 8 to 9; 18 weeks of HFD) over 7 days. (I) Hypothalamic Rap1 activity is reduced in C57BL/6J mice receiving ICV metformin (3 μg for 4 hours; n = 12). (J to L) Centrally administered metformin did not further lower blood glucose levels in brain-specific Rap1–deficient mice. Blood glucose levels (A), food intake (B), and body weight change (C) of control and Rap1ΔCNS mice before or 4 hours after a single ICV injection of metformin (3 μg) or vehicle (1 μl; n = 4 to 6). h, hours. *P < 0.05, **P < 0.01, ***P < 0.001, and ****P < 0.0001 by t test [(C) to (E) and (I)] and two-way ANOVA followed by Tukey’s multiple-comparison test [(A), (B), (F) to (H), and (J) to (L)].
Fig. 3.
Fig. 3.. Neuronal expression of a constitutively active form of Rap1 (Rap1V12) diminishes the glycemic effects of metformin.
(A) Strategy for generating conditional Rap1V12 overexpression mice (Rosa26-LSL-Rap1V12 mice). The construct containing “CAG promoter-loxP-Transcription blocker-loxP-RAP1V12-IRES-eGFP” was inserted into the Rosa26 locus. Upon Cre-mediated recombination, the transcription blocker is removed, enabling Rap1V12 expression. (B) Increased Rap1 activity in the hypothalamus of Rap1CNSV12 (Rosa26-LSL-Rap1V12; CaMKCre) mice. Rap1 activity was measured as the amount of active GTP-bound Rap1 using a Rap1 pull-down assay. (C) Body weight comparison between control and Rap1CNSV12 mice showing no significant difference (n = 8). (D) Fasting blood glucose levels in control and Rap1CNSV12 mice. (E) GTT in control and Rap1CNSV12 mice after vehicle (Veh) or metformin (Met) treatment (150 mg/kg, ip) 30 min before glucose administration (1.5 g/kg). Metformin significantly improved glucose tolerance in control mice but not in Rap1CNSV12 mice (n = 4). (F) AUC analysis of the GTT data shown in (E). Littermate controls were used in all experiments. Statistical analysis was performed using one-tailed Student’s t test (B); two-tailed Student’s t test [(C) and (D)]; three-way repeated-measures ANOVA (time × treatment × genotype) followed by uncorrected Fisher’s LSD test (E); and two-way ANOVA followed by Šídák’s multiple-comparison test (F). *P < 0.05, ***P < 0.001, and n.s. = not significant. Asterisks indicate metformin versus its paired vehicle within the same genotype at each time point in (E).
Fig. 4.
Fig. 4.. Metformin activated VMH SF1 neurons in a Rap1-dependent manner.
(A and B) c-Fos induction by ICV metformin. HFD-fed C57BL/6 mice (13 weeks of HFD) received daily ICV injections of metformin (1 μg) or vehicle (1 μl) for 3 days. Four hours after the last injection, brains were immunostained for c-Fos expression (A). 3V, third ventricle. (B) Quantification of the number of c-Fos–positive neurons (n = 2 to 3) in (A). (C to E) Metformin increases action potential frequency and depolarizes the resting membrane potential of VMH SF1 neurons. (C) Representative action potential firing traces after treatment with metformin (100 μM) in VMH SF1–positive neurons of the hypothalamic slice from tdTomato/SF1 Cre mice. Quantification of changes in resting membrane potential (D) and spontaneous action potential firing frequency (E) of VMH SF1 neurons (n = 15 to 17) after treatment with increasing doses of metformin. (F to H) Rap1 is required for the metformin response. (F) Representative action potential firing traces of VMH SF1 neurons in hypothalamic slices from control and SF1-specific Rap1-knockout slices with or without metformin (1 μM). Rap1 deletion abolishes metformin-induced increases in firing frequency (G) and membrane depolarization (H). *P < 0.05, **P < 0.01, ***P < 0.001, and ***P < 0.0001 by t test [(B), (G), and (H)] and one-way ANOVA followed by Dunnett’s multiple-comparison test [(D) and (E)].
Fig. 5.
Fig. 5.. Rap1 in SF1 neurons mediates metformin’s antidiabetic effects.
(A and B) Rap1∆SF1 mice exhibited reduced blood glucose levels comparable to those of metformin-treated mice, with no additional reduction following acute or chronic treatment. (A) Blood glucose levels in response to acute metformin treatment (50 mg/kg, ip) or vehicle in Rap1∆SF1 and control mice (n = 5 to 8; 22 weeks of HFD) over 4 hours. (B) Blood glucose levels in Rap1∆SF1 or control mice (n = 8; 40 weeks of HFD) receiving vehicle (saline; intraperitoneally, for 3 days) or metformin (50 mg/kg, ip, for 4 days). (C to G) VMH expression of constitutively active Rap1 significantly attenuated metformin’s glycemic effects. (C) Schematic representation of adeno-associated virus injection into the VMH. (D) Representative image of AAV-Rap1V12 viral injection into the VMH. (E) Mice expressing Rap1V12 in the VMH showed an attenuated glucose-lowering response to chronic metformin treatment (150 mg/kg, orally, for 4 days; n = 6 to 7; 13 weeks of HFD). (F) AUC of the data in (E). (G) Metformin (150 mg/kg, ip, for 24 hours; n = 6 to 7; 13 weeks of HFD) acutely reduced blood glucose in controls but not in VMH Rap1V12 mice. (H) Metformin (150 mg/kg, ip; n = 9 to 11; 37 weeks of HFD) improved glucose tolerance in HFD-fed controls, but this effect was significantly attenuated in Rap1V12 mice. (I) AUC of GTT in (H). *P < 0.05, **P < 0.01, ***P < 0.001, and ****P < 0.0001 by two-way ANOVA followed by Tukey’s multiple-comparison test [(A) and (B)]; two-way ANOVA followed by uncorrected Fisher’s LSD test in (E); unpaired two-tailed t tests in (F); two-way ANOVA followed by uncorrected Fisher’s LSD test (G); and three-way repeated-measures ANOVA (time × treatment × genotype) followed by Šídák’s post hoc test (H). Asterisks indicate significant differences between metformin and vehicle within the same genotype in (H).

References

    1. Hesse E., Taubmann G., Die wirkung des biguanids und seiner derivate auf den zuckerstoffwechsel. Naunyn Schmiedebergs Arch. Exp. Pathol. Pharmakol. 142, 290–308 (1929). [The effect of biguanide and its derivatives on carbohydrate metabolism].
    1. Slotta K. H., Tschesche R., Über biguanide, II.: Die blutzucker-senkende wirkung der biguanide. Ber. Dtsch. Chem. Ges. 62, 1398–1405 (1929). [On biguanides, II: The blood-sugar-lowering effect of biguanides].
    1. Diabetes Prevention Program Research Group , Long-term safety, tolerability, and weight loss associated with metformin in the Diabetes Prevention Program Outcomes Study. Diabetes Care 35, 731–737 (2012). - PMC - PubMed
    1. Fullerton M. D., Galic S., Marcinko K., Sikkema S., Pulinilkunnil T., Chen Z. P., O’Neill H. M., Ford R. J., Palanivel R., O’Brien M., Hardie D. G., Macaulay S. L., Schertzer J. D., Dyck J. R., van Denderen B. J., Kemp B. E., Steinberg G. R., Single phosphorylation sites in Acc1 and Acc2 regulate lipid homeostasis and the insulin-sensitizing effects of metformin. Nat. Med. 19, 1649–1654 (2013). - PMC - PubMed
    1. Stumvoll M., Nurjhan N., Perriello G., Dailey G., Gerich J. E., Metabolic effects of metformin in non-insulin-dependent diabetes mellitus. N. Engl. J. Med. 333, 550–554 (1995). - PubMed

MeSH terms