. 2025 Aug;11(31):eadx6732.
doi: 10.1126/sciadv.adx6732. Epub 2025 Jul 30.

Morphology- and adhesion-dual biomimetic nanovaccine boosts antigen cross-presentation through subcellular transport regulation

Affiliations

Morphology- and adhesion-dual biomimetic nanovaccine boosts antigen cross-presentation through subcellular transport regulation

Zhenyu Wang et al. Sci Adv. 2025 Aug.

Abstract

In situ tumor vaccines have immense potential for immunotherapy because they generate whole tumor-derived antigens (TDAs) to activate antitumor immune responses. However, the rapid degradation and clearance of the released TDAs severely hinder subsequent antigen presentation and the final efficacy of the in situ vaccine. Here, we synthesized gold nanoxanthium coated with polydopamine (AuNX-PDA) to mimic the morphological and biological adhesion properties of xanthium and mussels, respectively. AuNX-PDA facilitated effective absorption of released TDAs after near-infrared II photothermal treatment and delivery of the absorbed TDAs to the endoplasmic reticulum and Golgi apparatus of dendritic cells for cross-presentation, thereby activating CD8+ T cells for efficient tumor-specific immunity. The nanovaccine (NV) significantly inhibited irradiated primary tumors and nonirradiated distant tumors by producing robust antitumor immune responses in B16F10 melanoma and 4T1 breast cancer mouse models. These findings highlight the potency of morphology- and adhesion-dual biomimetic NVs in whole-tumor vaccine therapy.


Figures

Fig. 1.
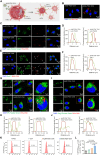
Fig. 1.. Schematic depiction of AuNX-PDA fabrication and its vaccine effect.
(A) Schematic illustration showing the fabrication of AuNX-PDA. (B) Combination of AuNX-PDA with 1064-nm NIR-II laser irradiation induces tumor tissue ICD, generating a large amount of TDAs onsite. Then, AuNX-PDA enriches and delivers TDAs to the ER and Golgi apparatus of dendritic cells (DCs), promoting their maturation for antigen cross-presentation. Last, the maturated DCs transport to LNs, where it induces the differentiation of naïve T cells into cytotoxic CD8+ T lymphocytes for effective killing of both residual primary tumors and distant tumors.
Fig. 2.
Fig. 2.. Characterization of NVs.
TEM images of (A) AuNP and (B) AuNX with different thicknesses of PDA. (C) FDTD simulation of electric field enhancement of AuNP and AuNX. (D) Temperature-rising curve of PBS, AuNP, AuNP-PDA1, AuNX, and AuNX-PDA1 (Au concentration of 100 μg/ml) under 1064-nm laser irradiation at a power density of 1.5 W/cm2. Photothermal profiles of (E) AuNP and (F) AuNX with or without PDA coating after four laser on/off cycles. (G) Schematic illustration of the interactions between proteins and PDA. (H) The absorption of immunogenic proteins from dead cells by NVs following a 5-min exposure to a 1064-nm laser. The data were extracted from fig. S4 for further comparison. Data in (D) and (H) were presented as means ± SD (n = 3). *P < 0.05; **P < 0.01; ***P < 0.001, analyzed by two-tailed unpaired t test.
Fig. 3.
Fig. 3.. NVs enhance tumor immunogenicity.
(A) Confocal laser scanning microscope (CLSM) images of fixed B16F10 cells after incubation with NVs for 30 min. (B) CLSM images of live B16F10 cells cocultured with different NVs for 4 hours. The uptake of (C) AuNP and (D) AuNX with different thicknesses of PDA by B16F10 cells, determined by flow cytometry. MFI, mean fluorescence intensity. (E) TEM images of fixed B16F10 cells after incubation with NVs for 30 min. (F) TEM images of live B16F10 cells cocultured with NVs for 4 hours. (G) Flow cytometry quantification and (H) CLSM images of CRT exposure on the surface of B16F10 cells after treatments. (I) ATP and (J) HMGB-1 released from treated B16F10 cells, detected by enzyme-linked immunosorbent assay (ELISA) and enhanced ATP assay kit, respectively. (K) Quantitative results showing the maturation of DCs (CD11c+CD80+CD86+) after incubation with treated B16F10 cells. Data in (C), (D), (G), (I), (J), and (K) are presented as means ± SD (n = 3). **P < 0.01; ***P < 0.001; ****P < 0.0001, analyzed by two-tailed unpaired t test. n.s., not significant.
Fig. 4.
Fig. 4.. NVs assist with antigen cross-presentation.
(A) Schematic illustration of the transportation of AuNX-PDA1-OVA in BMDCs. imDCs, immature DCs; mDCs, mature DCs. (B) CLSM images showing the selective uptake of fluorescein isothiocyanate (FITC)–labeled NVs and Cy5-labeled OVA by BMDCs after 4 hours of coincubation. (C, E, G, and I) CLSM images and (D, F, H, and J) corresponding curves depicting the colocalization of AuNP-PDA1-OVA and AuNX-PDA1-OVA with (C and D) lysosomes, (E and F) Rab11, (G and H) ER, and (I and J) golgiosome. a.u., arbitrary units. (K) Flowcharts and (L) quantitative results showing the expression of H-2kb/OVA257-264 on CD11c+ DCs after incubation. Data in (L) are presented as means ± SD (n = 3). *P < 0.05; **P < 0.01, analyzed by two-tailed unpaired t test.
Fig. 5.
Fig. 5.. Biodistribution of NVs after laser irradiation.
(A) Experimental schematic of NV-assisted delivery of TDAs to LNs. Immunofluorescence staining of B16F10 tumors by (B) terminal deoxynucleotidyl transferase–mediated deoxyuridine triphosphate nick end labeling (TUNEL) and (C) γ-H2AX after 5 min of laser irradiation. h, hours. (D) Living imaging of B16F10 tumor–bearing mice following in situ injection of NVs and laser treatment. (E) Fluorescence images of inguinal LNs at 48 hours posttreatment with different NVs. p, photons. (F) Fluorescence intensity–time curves of NVs on the tumor site after 1064-nm laser irradiation. (G) Fluorescence intensity of NVs on LNs at 48 hours post–laser irradiation. (H) CLSM images of NVs within LNs at 48 hours after injection. Data in (F) and (G) are presented as means ± SD (n = 3). *P < 0.05; **P < 0.01; ***P < 0.001, analyzed by two-tailed unpaired t test.
Fig. 6.
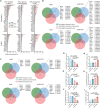
Fig. 6.. NVs deliver released TDAs to LNs.
(A) The relative abundance of neoantigens and DAMPs released from tumors, captured by NVs, and transported to LNs. (B) Venn diagram of the released, captured, and transported neoantigens to LNs by NVs. (C) Venn diagram of the released, captured, and transported DAMPs to LNs by NVs. The percentage of NV-containing DCs (Cy5+CD11c+), macrophages (Cy5+F4/80+), and B cells (Cy5+B220+) in (D to F) irradiated tumors and (G to I) LNs. Data in (D) to (I) are presented as means ± SD (n = 3). *P < 0.05; **P < 0.01; ***P < 0.001; ****P < 0.0001, analyzed by two-tailed unpaired t test.
Fig. 7.
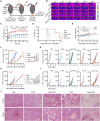
Fig. 7.. NVs inhibit B16F10 tumor.
(A) Schematic diagram of the treatment regimen. (B) Infrared thermal images and (C) temperature-rising curve of the tumor site during photothermal treatment. (D) Survival curves of tumor-bearing mice after various treatments. (E) Changes of mice body weight after various treatments. (F) Average and (G) individual tumor growth curves of primary tumors in different groups. CR, complete response. (H) Average and (I) individual tumor growth curves of distant tumors in different groups. (J) H&E staining of the tumor tissues on day 16 after different treatments. Data in (C), (E), (F), and (H) are presented as means ± SD (n = 5). **P < 0.01; ***P < 0.001; ****P < 0.0001, analyzed by two-tailed unpaired t test.
Fig. 8.
Fig. 8.. NVs activate the innate immune system.
(A) Detection diagram of inflammatory factors in the irradiated primary tumor after 24 hours of treatment. (B) The inflammatory factor level in tumors after various treatments. (C) Schematic diagram of in vivo immunoassay in B16F10 tumor–bearing mice 8 days after laser therapy. (D) The serum levels of IFN-γ, TNF-α, and IL-6 after various treatments. The percentages of type I macrophages (CD45+CD11b+F4/80+CD86+) in the (E) blood, (F) primary LN, (G) distant LN, (H) primary tumor, and (I) distant tumor. The percentages of neutrophils (CD45+CD11b+Ly6G+) in the (J) primary tumor and (K) distant tumor. The percentages of DCs (CD45+CD11b+CD11c+) in the (L) blood, (M) primary LN, (N) distant LN, (O) primary tumor, and (P) distant tumor. Data are presented as means ± SD [n = 3 in (B) and n = 5 in (D) to (P)]. *P < 0.05; **P < 0.01; ***P < 0.001; ****P < 0.0001, analyzed by two-tailed unpaired t test.
Fig. 9.
Fig. 9.. NVs regulate CD8+ T cell immunity.
The percentages of CD45+CD8+ T cells in the (A) primary tumor and (B) distant tumor. The percentages of CD8+CD69+ T cells in the (C) primary tumor and (D) distant tumor. The percentages of CD8+IFN-γ+ T cells in the (E) primary tumor and (F) distant tumor. The percentages of TEM (CD8+CD44+CD62L T cells) in the (G) blood, (H) primary tumor, and (I) distant tumor. The percentages of TCM (CD8+CD44+CD62L+ T cells) in the (J) spleen, (K) primary LN, and (L) distant LN. (M) Representative immunofluorescence images of primary and distant tumors stained with anti-Ki67 and anti-CD8 antibodies. The percentages of (N and O) CD8+Ki67+ and (P and Q) CD8+Ki67 cells in the (N and P) primary and (O and Q) distant tumors, counted from three random CLSM images. Data in (A) to (L) and (N) to (Q) are presented as means ± SD (n = 5). *P < 0.05; **P < 0.01; ***P < 0.001; ****P < 0.0001, analyzed by two-tailed unpaired t test.

Similar articles

References

    1. Long G. V., Swetter S. M., Menzies A. M., Gershenwald J. E., Scolyer R. A., Cutaneous melanoma. Lancet 402, 485–502 (2023). - PubMed
    1. Prokhnevska N., Cardenas M. A., Valanparambil R. M., Sobierajska E., Barwick B. G., Jansen C., Moon A. R., Gregorova P., delBalzo L., Greenwald R., Bilen M. A., Alemozaffar M., Joshi S., Cimmino C., Larsen C., Master V., Sanda M., Kissick H., CD8+ T cell activation in cancer comprises an initial activation phase in lymph nodes followed by effector differentiation within the tumor. Immunity 56, 107–124.e5 (2023). - PMC - PubMed
    1. Liu C., Shi Q., Huang X., Koo S., Kong N., Tao W., mRNA-based cancer therapeutics. Nat. Rev. Cancer 23, 526–543 (2023). - PubMed
    1. Rojas L. A., Sethna Z., Soares K. C., Olcese C., Pang N., Patterson E., Lihm J., Ceglia N., Guasp P., Chu A., Yu R., Chandra A. K., Waters T., Ruan J., Amisaki M., Zebboudj A., Odgerel Z., Payne G., Derhovanessian E., Mueller F., Rhee I., Yadav M., Dobrin A., Sadelain M., Luksza M., Cohen N., Tang L., Basturk O., Goenen M., Katz S., Do R. K., Epstein A. S., Momtaz P., Park W., Sugarman R., Varghese A. M., Won E., Desai A., Wei A. C., D’Angelica M. I., Kingham T. P., Mellman I., Merghoub T., Wolchok J. D., Sahin U., Tuereci O., Greenbaum B. D., Jarnagin W. R., Drebin J., O’Reilly E. M., Balachandran V. P., Personalized RNA neoantigen vaccines stimulate T cells in pancreatic cancer. Nature 618, 144–150 (2023). - PMC - PubMed
    1. Rivero Hinojosa S., Grant M., Panigrahi A., Zhang H., Caisova V., Bollard C. M., Rood B. R., Proteogenomic discovery of neoantigens facilitates personalized multi-antigen targeted T cell immunotherapy for brain tumors. Nat. Commun. 12, 6689 (2021). - PMC - PubMed

MeSH terms