. 2025 Jul 19;104(10):105589.
doi: 10.1016/j.psj.2025.105589. Online ahead of print.

Identification of the T-box transcription factor t-bet in chickens and its role in immune response

Affiliations

Identification of the T-box transcription factor t-bet in chickens and its role in immune response

Yuxin Guo et al. Poult Sci. .

Abstract

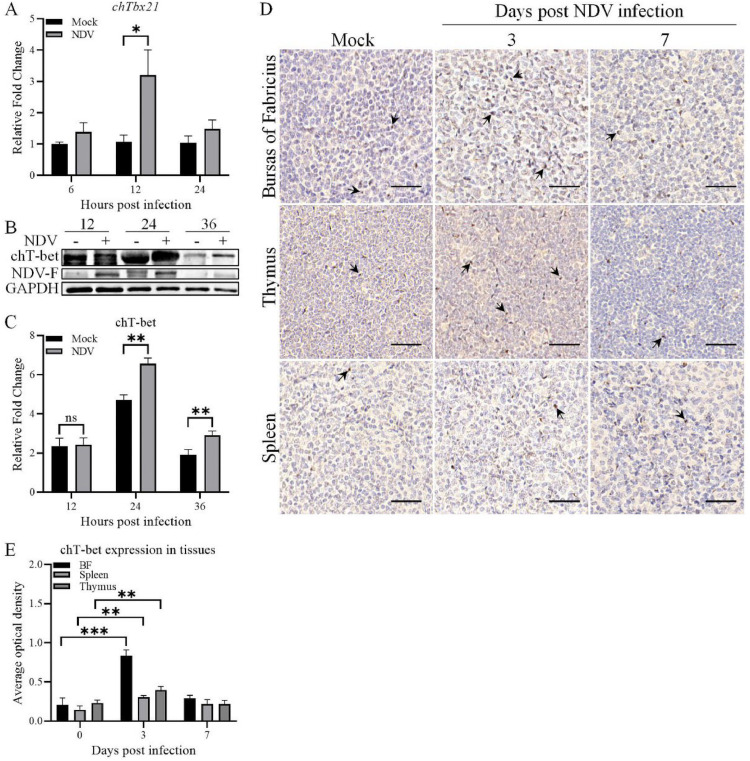
T-bet (T-box transcription factor TBX21), encoded by the Tbx21 gene, is a key regulator of T helper 1 (Th1) cell differentiation and cellular immunity. However, the role of T-bet in avian species remains elusive. To investigate the role of T-bet in avian immune response, we cloned chicken T-bet (chT-bet) from a White Leghorn chicken spleen-derived cDNA library. Multiple sequence alignments and structural analyses revealed that the amino acid sequence of chT-bet has 50.4 % and 51.1 % identity to its human and mouse orthologs, respectively, but the T-box DNA-binding domain remains conserved across species. We found that chT-bet is highly expressed in immune-related organs, particularly the spleen and thymus, and that Newcastle disease virus (NDV) infection significantly upregulated chT-bet expression both in virto and in vivo. Knockdown of chT-bet by RNAi markedly reduced the expression of IFN-γ but not IL-4 in MSB1 cells. Furthermore, chT-bet overexpression in DF-1 cells activated the promoter of IFN-γ while suppressing promoter activation of IL-2 and IL-4. Chromatin immunoprecipitation (ChIP) assays confirmed the direct binding of chT-bet to IFN-γ and IL-2 promoters. In contrast, chT-bet's regulation of IL-4 appeared indirect. These findings establish chT-bet as a central orchestrator of Th1 immunity in chickens, directly driving IFN-γ production and regulating IL-2 and IL-4 expressions through distinct pathways, providing insights for vaccine development and disease control strategies.

Keywords: Chicken; Cytokine regulation; T-bet; Th1 immune response.


Conflict of interest statement

Disclosures The authors declare that they have no known competing financial interests or personal relationships that could have appeared to influence the work reported in this paper.

Figures

Fig 1
Fig. 1
Phylogenetic and sequence analysis of chTbx21. (A) Phylogenetic tree of the coding regions of Tbx21 from different species. The Neighbor-Joining method with 1000 bootstrap replicates was used to construct the tree. Gene names and GenBank accession numbers are provided. The scale bar represents the nucleotide substitution rate per site. (B) Schematic illustration of chT-bet protein structure. The T-box domain is denoted by a pentagon. (C) Multiple sequence alignment of the T-box domain of T-bet homologs from different species. Amino acid conservation is color-shaded, the darker shades, the higher conservation levels (100 %, 80 %, and 60 % from dark orange to light yellow).
Fig 2
Fig. 2
mRNA expression profiles of chT-bet in different tissues and its subcellular localization. (A) Quantitative RT-PCR analysis of chT-bet mRNA expression in different chicken tissues. Tissues were collected from the spleen, thymus, bursa of Fabricius, heart, liver, kidney, lung, trachea, esophagus, crop, gizzard, proventriculus, duodenum, pancreas, jejunum, ileum, cecum, rectum, brain, and muscle of two-week-old SPF chickens (n = 3). Gapdh was used as an internal control. The relative expression levels were calculated using the 2-ΔΔCt method and normalized to that of spleen tissue. Data represent mean ± SD from three independent experiments. ns, p > 0.05; *, p ≤ 0.05. (B) Subcellular localization of chT-bet-EGFP fusion protein in DF-1 cells. Cells were seeded in 24-well plates and transfected with pEGFP-N1 or pEGFP-N1-chT-bet plasmids (500 ng/well). Twenty-four hours after transfection, nuclei were stained with DAPI, and fluorescence was visualized using an inverted fluorescence microscope. Images were merged using ImageJ software. Scale bar = 20 μm.
Fig 3
Fig. 3
NDV infection upregulated chT-bet expression both in vitro and in vivo. (A) mRNA expression of chT-bet increased in NDV-infected lymphocytes. Splenic lymphocytes were mock-infected or infected with NDV (MOI = 0.5). Total RNA was extracted at different time points (6, 12, and 24 h post-infection) and subjected to qRT-PCR analysis. GAPDH served as an internal control for normalization. Data represent mean ± SD from three independent experiments. *, p ≤ 0.05. (B & C) Protein expression of chT-bet increased in NDV-infected lymphocytes. Cells were infected as described in (A). Cell lysates were prepared at 12, 24, and 36 h post-infection and analyzed by Western Blot using specific antibodies against chT-bet, NDV Fusion protein, and GAPDH. Endogenous GAPDH expression was used as an internal control. The band intensities for chT-bet in (B) were quantitated by densitometry as shown in (C). Data represent mean ± SD from three independent experiments. **, p ≤ 0.01; ns, p > 0.05. (D) Immunohistochemical analysis of chT-bet expression in chicken organs after NDV infection. Black arrows indicate typical chT-bet positive cells. Three and seven days post-infection, bursa, spleen, and thymus tissues were prepared for immunohistochemical staining using chT-bet polyclonal antiserum. Scale bar = 30 μm. (E) Quantitative analysis of chT-bet expression in tissues performed using ImageJ. Data represent mean ± SD from three independent microscopic fields. **, p ≤ 0.01; ***, p ≤ 0.001.
Fig 4
Fig. 4
knockdown of chT-bet by RNAi inhibited the transcription of Ifng and Il2 in MSB1 cells. (A&B) Effects of chT-bet knockdown on endogenous chT-bet expression in MSB1 cells. Cells were transfected with 50 pmol of siRNA (chT-bet RNAi or control RNAi). Twenty-four hours post-transfection, cytosolic proteins were analyzed by Western Blot using anti-chT-bet and anti-GAPDH antibodies. Endogenous GAPDH expression was used as an internal control. The band intensities for chT-bet in (A) were quantitated by densitometry as shown in (B). (C-E) Effects of chT-bet knockdown on cytokine expression at an mRNA level. MSB1 cells were treated as described in (A). Twenty-four hours post-transfection, cells were maintained in fresh 2 % 1640 medium for 1-2 h, followed by stimulation with a cell stimulation cocktail (containing PMA and ionomycin) for 4-6 hours. mRNA expression levels of IFN-γ (C), IL-2 (D), and IL-4 (E) were quantified by qRT-PCR using gene-specific primers. Gapdh was used as an internal control. Data represent mean ± SD from three independent experiments. ***, p < 0.001; **, p < 0.01; *, p < 0.05.
Fig 5
Fig. 5
knockdown of chT-bet inhibited the expression of IFN-γ but promoted the expression of IL-2 and IL-4 in MSB1 cells. MSB1 Cells were transfected with siRNA (chT-bet RNAi or control RNAi) as described in Fig. 4. Twenty-four hours post-transfection, cells were maintained in fresh 10 % 1640 medium for 1-2 h, followed by stimulation with PMA and ionomycin in the presence or absence of Brefeldin A for 4-6 h. Intracellular cytokine staining was performed to detect IFN-γ, IL-2, and IL-4 expressions in cells using flow cytometry. (A) Viable MSB1 cells were gated for further analysis. (B) Antibody isotype staining was used as nonspecific staining controls. Cells were stained with isotype-matched IgG for nonspecific staining controls. (C—H) Examination of IFN-γ, IL-2 and IL-4 positive cells by flow cytometry via intracellular staining. Flow cytometry contour plots of IFN-γ+ cells were shown in (C), and the bar graph for percentage of IFN-γ+ cells in (C) were shown in (D). Flow cytometry contour plots of IL-2+cells were shown in (E), and the percentage IFN-γ+ cells in (E) were shown in (F). Flow cytometry contour plots of IL-4+cells were shown in (G), and the percentage IFN-γ+ cells in (G) were shown in (H). Data represent mean ± SD from three independent experiments. **, p ≤ 0.01; ns, p > 0.05.
Fig 6
Fig. 6
chT-bet promoted the activity of the Ifng promoter, but inhibited Il2 and Il4 promoter activation in DF-1 cells. (A) Genomic organization of chicken Ifng, Il2, and Il4 genes and predicted chT-bet binding sites in their promoter regions. Binding site predictions were performed using the JASPAR database. Schematic illustration shows gene structures: Black lines represent introns, gray boxes indicate exons, red squares denote coding regions, and ovals indicate the predicted binding positions of T-bet. (B-D) Identification of the promoters of Ifng, Il2 and Il4. DF-1 cells were co-transfected with 500 ng of pGL3-Ifng-Luc (B), pGL3-Il2-Luc (C), or pGL3-Il4-Luc (D) together with 20 ng of pRL-TK as an internal control. Cell lysates were prepared 24 h post-transfection, and luciferase reporter gene assays were performed. (E-G) Effect of chT-bet overexpression on promoter activation of Ifng, Il2 and Il4. DF-1 cells were co-transfected with pGL3-Ifng-Luc (E), pGL3-Il2-Luc (F), or pGL3-Il4-Luc (G) together with either pRK5-Flag-chT-bet or empty pRK5-Flag vector. pRL-TK plasmid was added to each transfection as a control. Cell lysates were prepared 24 h post-transfection, and luciferase reporter gene assays were performed. Data represent mean ± SD from three independent experiments. **, p ≤ 0.01; *, p ≤ 0.05.
Fig 7
Fig. 7
Binding of chT-bet to Ifng and Il2 promoters. (A&B) The ectopic expression level of chT-bet by transfection was comparable to that of PMA-stimulated expression of chT-bet. MSB1 cells were either transfected with 50 pmol pRK5-Flag-chT-bet or stimulated with PMA. Cell lysates were prepared 24 h post-transfection or 6 h post-stimulation with PMA, and examined with Western Blot analysis using anti-chT-bet and anti-GAPDH antibodies. GAPDH served as an internal control. The band intensities for chT-bet in (A) were quantitated by densitometry as shown in (B). Data are presented as mean ± SD from three independent experiments. ns, p > 0.05. (C) Annotation of binding events across different genomic features, including promoters, exons, introns, and intergenic regions. (D) ChIP-seq enrichment profiles of Flag-tagged chT-bet across Ifng, Il2, and Il4 genomic loci. Light-yellow boxes indicate regions analyzed by ChIP-qPCR, centered on predicted T-bet binding motifs or enrichment peaks. Scale bar = 1 kb. (E) Quantitative analysis of Flag-chT-bet binding to Ifng, Il2, and Il4 promoters by ChIP-qPCR. Data represent mean ± SD from three independent experiments. (F) De novo motif analysis of top five enriched transcription factor binding motifs in MSB1 cells. (G) Position weight matrix of the chicken T-bet binding motif. (H) Position weight matrix of the human T-bet binding motif, obtained from the JASPAR database. (I) Known motif analysis of top ten enriched transcription factor binding motifs in MSB1 cells. (J) ChIP-seq enrichment profiles of endogenous chT-bet across Ifng, Il2, and Il4 genomic loci. Light-yellow boxes indicate regions analyzed by ChIP-qPCR, centered on predicted T-bet binding motifs or enrichment peaks. Scale bar = 1 kb. (K) Quantitative analysis of endogenous chT-bet binding to Ifng, Il2, and Il4 promoters by ChIP-qPCR. Data represent mean ± SD from three independent experiments. ***, p < 0.001; **, p < 0.01; *, p < 0.05; ns, p > 0.05.

Similar articles

References

    1. Afkarian M., Sedy J.R., Yang J., Jacobson N.G., Cereb N., Yang S.Y., Murphy T.L., Murphy K.M. T-bet is a STAT1-induced regulator of IL-12R expression in naïve CD4+ T cells. Nat. Immunol. 2002;3:549–557. - PubMed
    1. Amirian M., Jafari-Nozad A.M., Darroudi M., Farkhondeh T., Samarghandian S. Overview of the miR-29 family members’ function in breast cancer. Int. J. Biol. Macromol. 2023;230 - PubMed
    1. Bean A.G.D., Lowenthal J.W. In: Chapter 9 - avian Cytokines and Their Receptors. Pages 249–276 in Avian Immunology. Third Edition. Kaspers B., Schat K.A., Göbel T.W., Vervelde L., editors. Academic Press; Boston: 2022.
    1. Bódi I., Minkó K., Molnár D., Nagy N., Oláh I. A novel aspect of the structure of the avian thymic medulla. Cell Tissue Res. 2015;359:489–501. - PubMed
    1. Boyd A.C., Peroval M..Y., Hammond J.A., Prickett M.D., Young J.R., Smith A.L. TLR15 is unique to avian and reptilian lineages and recognizes a yeast-derived agonist. J. Immunol. 2012;189:4930–4938. - PubMed