. 2025 Aug 13;33(8):1381-1395.e7.
doi: 10.1016/j.chom.2025.07.005. Epub 2025 Jul 29.

Metagenomic selections reveal diverse antiphage defenses in human and environmental microbiomes

Affiliations

Metagenomic selections reveal diverse antiphage defenses in human and environmental microbiomes

Luis Rodriguez-Rodriguez et al. Cell Host Microbe. .

Abstract

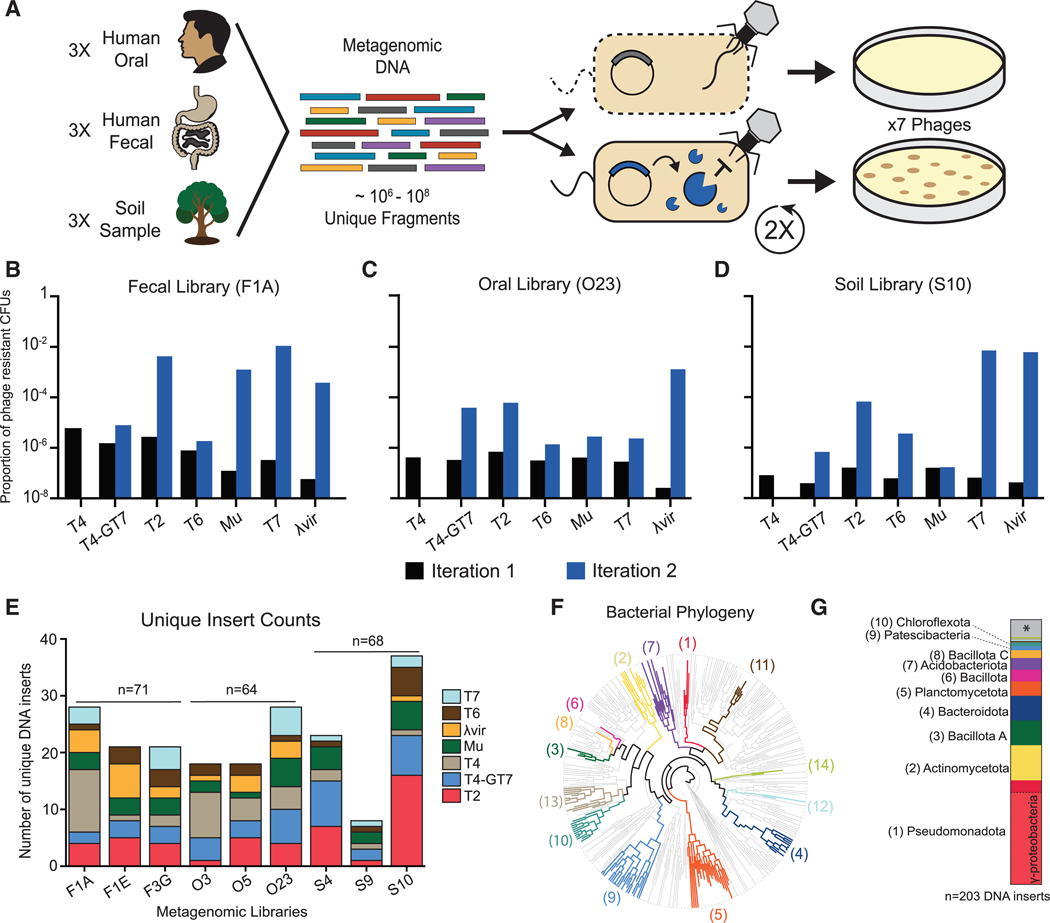
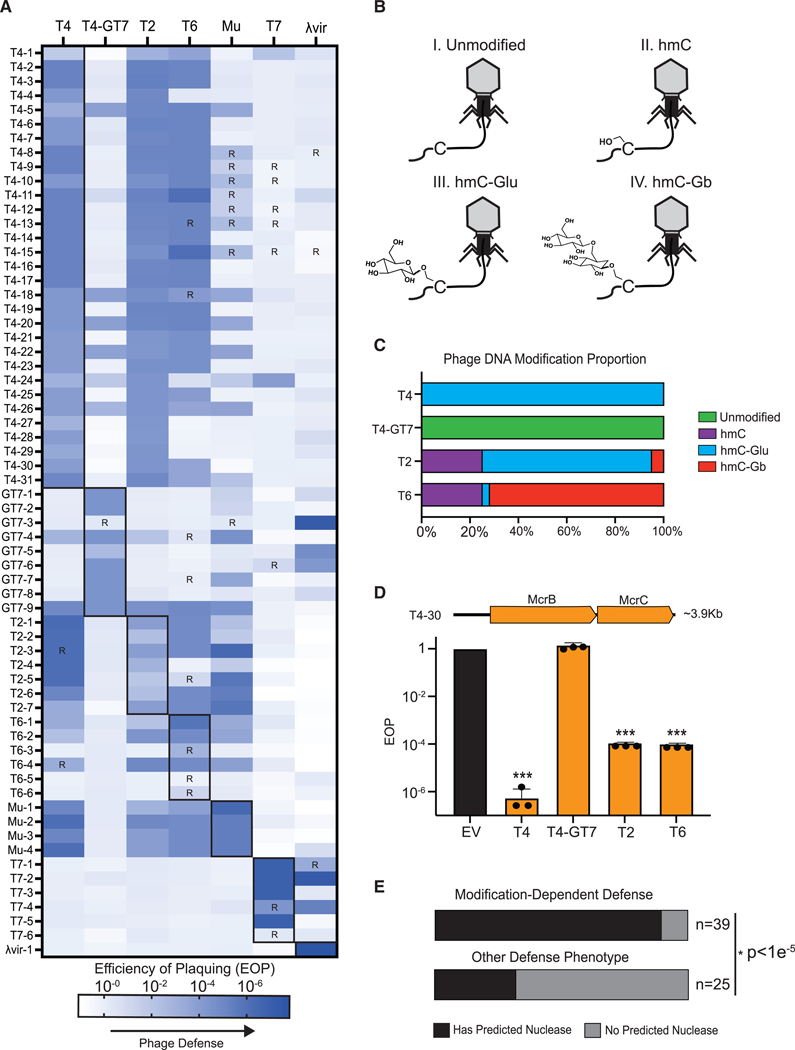
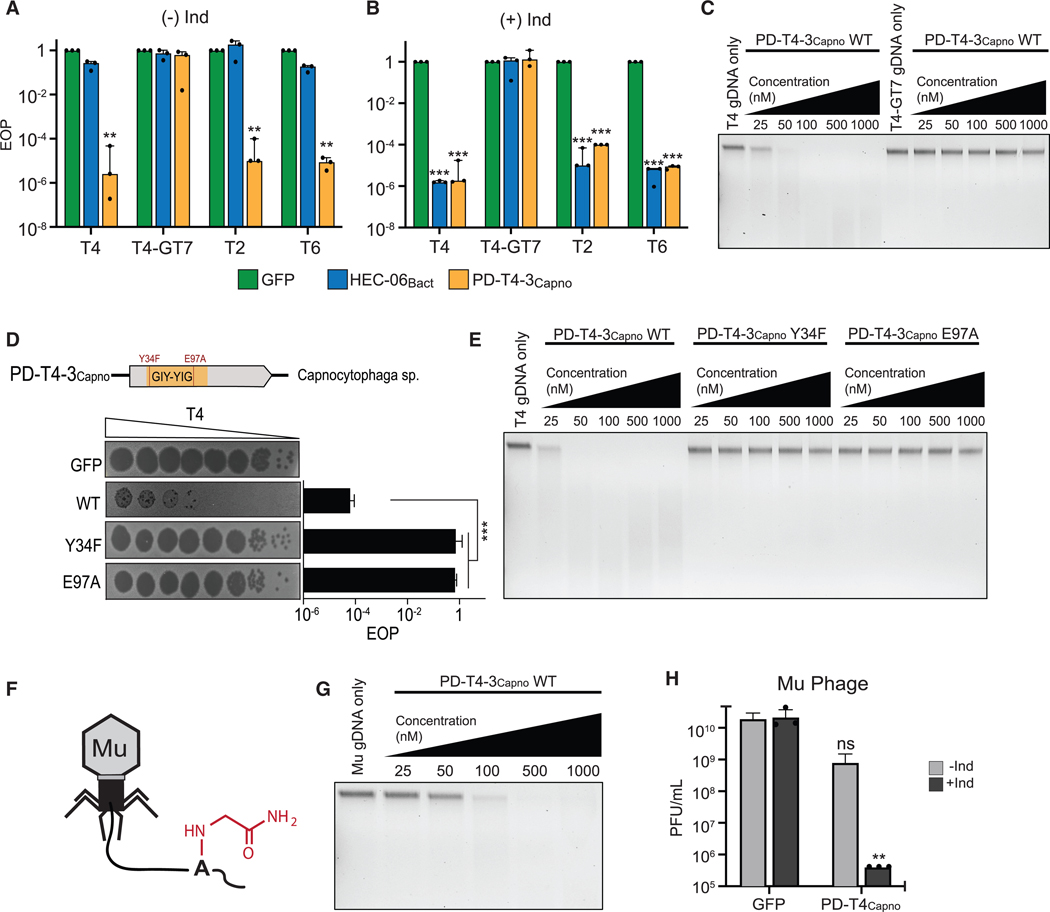
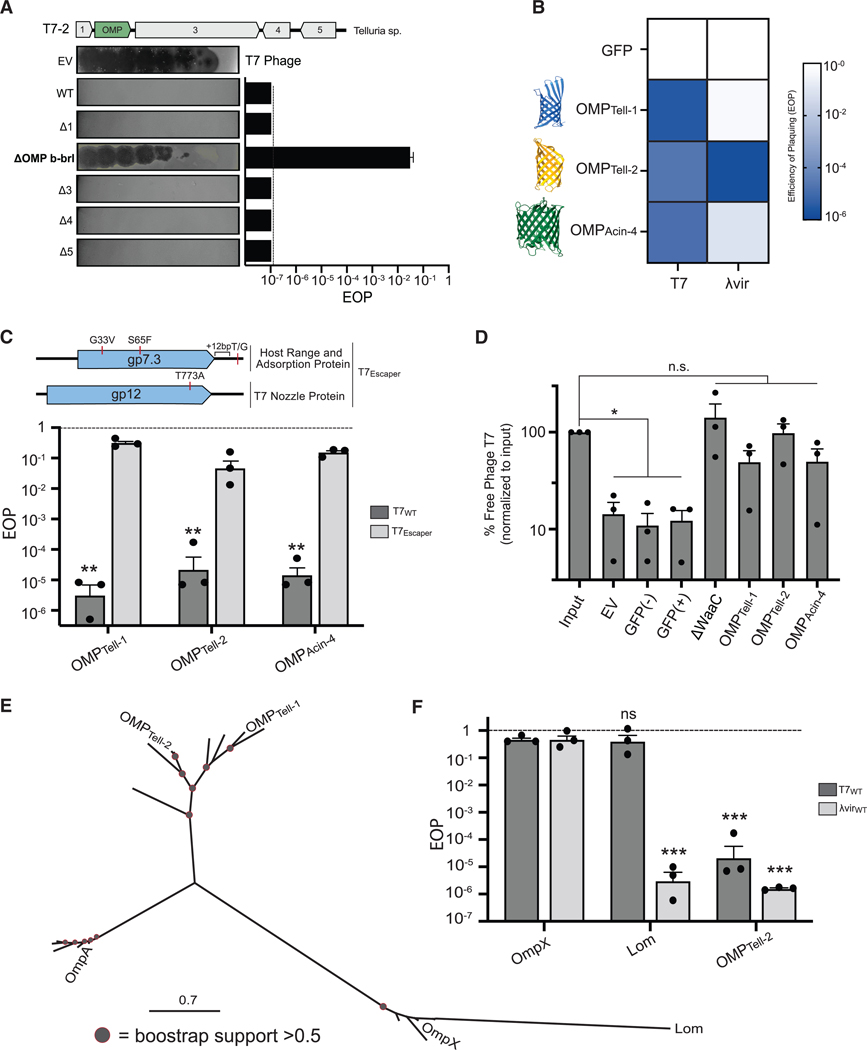
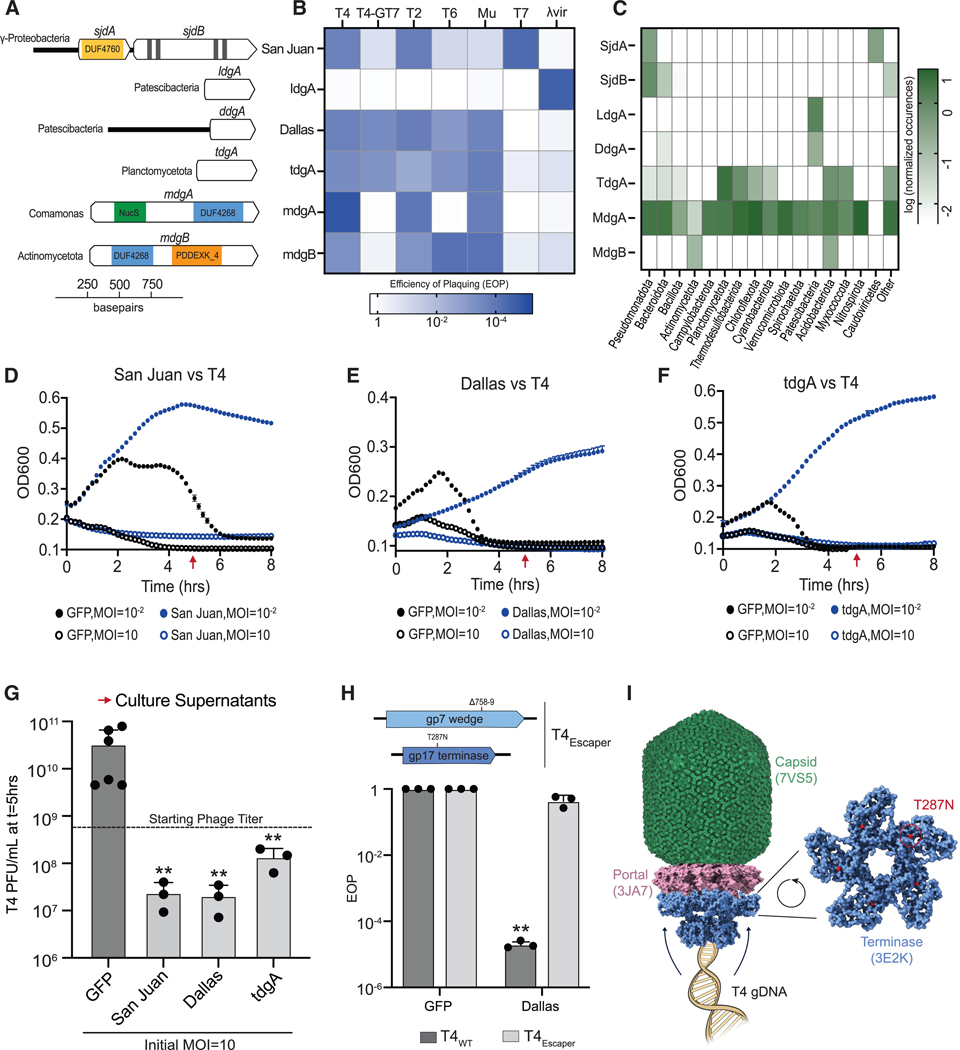
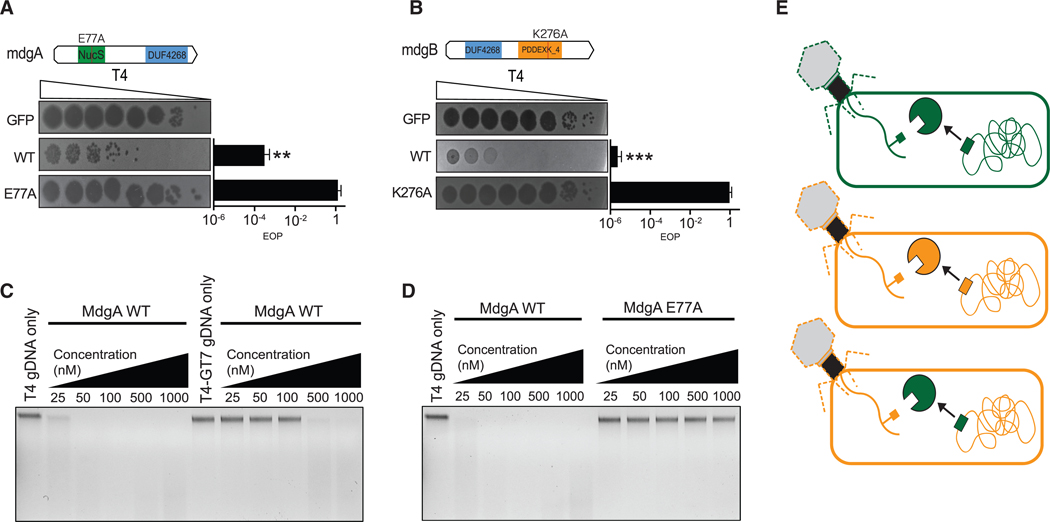
To prevent phage infection, bacteria have developed an arsenal of antiphage defenses. Evidence suggests that many examples in nature have not been described. Using plasmid libraries expressing small DNA inserts and functional selections for antiphage defense in Escherichia coli, we identified over 200 putative defenses from 14 bacterial phyla in 9 human and soil microbiomes. Many defenses were unrecognizable based on sequence or predicted structure and thus could only be identified via functional assays. In mechanistic studies, we show that some defenses encode nucleases that distinguish phage DNA via diverse chemical modifications. We also identify outer membrane proteins that prevent phage adsorption and a set of unknown defenses with diverse antiphage profiles and modalities. Most defenses acted against at least two phages, indicating that broadly acting systems are widely distributed. Collectively, these findings highlight the diversity and interoperability of antiphage defense systems.

Keywords: functional metagenomics; genomics; horizontal gene transfer; metagenomics; microbial; nuclease; phage; phage biology; phage defense; phylogenetics.


Conflict of interest statement

Declaration of interests The authors declare that they have no competing interests.

Figures

Figure 1.
Figure 1.. Functional metagenomic selections reveal antiphage defenses
(A) Scheme for functional metagenomic selections. Nine DNA libraries in E. coli were subjected to infection with a panel of seven phages. (B–D) Proportion of phage-resistant colony forming units (CFUs) after one and two rounds of iterative phage selection. Proportions for (B) fecal (F1A), (C) oral (O23), and (D) soil (S10) after the first and second iteration are shown in black and blue, respectively. An elevated proportion of phage resistance suggests enrichment for phage defense elements. (E) Distribution of unique DNA inserts from 60 independent selections. Each bar represents a different metagenomic library, while the colored layers indicate the phage used for selection. (F) A phylogenetic tree of known bacteria. Source phyla for putative phage defense inserts are depicted in bold and color; each color represents a different phylum. Each tip represents a bacterial class and branch lengths are cropped at a defined radius. Colors and numbers correspond to the stacked bar chart in G. (G) Predicted phyla-of-origin for all 203 putative phage defense inserts. The ten most prevalent phyla are named and numbered to the left of the stacked bar chart. The 13 defense inserts that lack a confident phylum-level prediction are indicated in gray and with an asterisk. Class-level predictions of γ-proteobacteria are depicted as a subset of their parent phylum, Pseudomonadota, below the dashed line. See also Figures S1 and S2; Tables S1 and S2–S6.
Figure 2.
Figure 2.. Metagenomic inserts confer broad-spectrum phage defense
(A) Heatmap showing efficiency of plaquing for a set of 64 validated DNA inserts against a panel of seven phages. Bold outlines depict infections with the phage used in an insert’s initial discovery. R; reduced plaque size. (B) Cartoon of four T-even phages, each with a different covalent modification on cytosines. I, unmodified cytosine; II, hydroxymethyl cytosine (hmC); III, glucosyl hydroxymethyl cytosine (hmC-Glu); IV, gentiobiose hydroxymethyl cytosine (hmC-Gb). (C) Stacked bar chart depicting the proportion of cytosine modifications for each of the T-even phages, adapted from Lehman and Pratt. (D) Efficiency of plaquing for T-even phages against insert T4–30, which encodes a homolog of the type IV restriction system McrBC, but no other ORFs; *** denotes p ≤ 0.0001 vs. T4-GT7, one-way ANOVA, n = 3. (E) Stacked bar chart showing the number of nuclease-encoding inserts associated with modification-dependent defense phenotypes versus others; p < 1e−5, Fisher exact test. Efficiency of plaquing (EOP) values depicted as triplicate averages and error bars depict standard deviation. See also Figure S3.
Figure 3.
Figure 3.. Nucleases cleave modified phage genomes to elicit defense
(A and B) EOP for HEC-06Bact and PD-T4–3Capno against T-even phages compared with GFP controls; (A) no inducer, (B) with inducer; significance: ** p ≤ 0.001, *** p ≤ 0.0001 (one-way ANOVA vs. T4-GT7). (C) Purified PD-T4–3Capno incubated with T4 and T4-GT7 genomic DNA for 10 at different concentrations; DNA was stained with ethidium bromide and visualized under UV light after agarose gel electrophoresis. (D) Predicted catalytic residues for PD-T4–3Capno and their impact on infection via plaque assay; *** p ≤ 0.0001 (one-way ANOVA vs. wild type [WT]). (E) The degradation of T4 genomic DNA in vitro by PD-T4–3Capno and its mutants. Reaction products were analyzed as in C. (F) Cartoon of phage Mu showing the addition of a carbamoyl methyl group to the N6 position of adenine. (G) In vitro degradation of Mu genomic DNA by purified PDT4–3Capno at different concentrations. Reaction products were analyzed as in C. (H) Defense of PD-T4–3Capno against phage Mu compared with a GFP control; PFU = plaque forming units, (+/−) Ind indicates whether expression was induced; ** p ≤ 0.001, ns = no significance (Welch’s t test vs. condition-match GFP control). All experiments in biological triplicate; error bars depict standard deviation.
Figure 4.
Figure 4.. OMPs block phage adsorption
(A) A gene encoding a predicted OMP is necessary for phage defense by the T7–2 insert. A Δ symbol indicates that the start codon of indicated gene was deleted. Mutants were challenged via T7 plaque assays. The bar chart indicates the EOP for each genotype. (B) Heatmap depicting EOP for GFP, OMPTell-1, OMPTell-2, and OMPAcin-4 when challenged with T7 and λvir. Structures of each OMP predicted by Alphafold3 are depicted without their signal peptide. (C) Top, missense mutants in T7Escaper mapped to two loci, encoding genes associated with phage adsorption and DNA injection. Bottom, EOP for T7WT and T7Escaper against OMPTell-1, OMPTell-2, and OMPAcin-4; ** p ≤ 0.001 (Welch’s t test; T7WT vs. T7Escaper). (D) T7-phage adsorption assay. The y axis depicts free, unadsorbed phages following incubation with E. coli cells of the indicated genotypes. Asterisks denote p < 0.05, Student’s t test with Bonferroni-Holm correction for multiple hypotheses. (E) An unrooted phylogenetic tree depicting various OMPs and their homologs. Red outlines on gray circles depict nodes with bootstrap support > 0.5. (F) EOP for OmpX, Lom, and OMPTell-2 against T7WT and λvir; *** p ≤ 0.0001, ns = no significance (one-way ANOVA vs. condition-matched OmpX control). Dashed lines in C and F indicate infectivity against a GFP control, used to calculate other EOP values. All experiments performed in biological triplicate; error bars depict standard deviation. See also Figure S4.
Figure 5.
Figure 5.. Metagenomic defenses exhibit diverse antiphage profiles and modalities
(A) Cartoon representation of two defense systems (San Juan and Dallas) and four defense genes (IdgA, tdgA, mdgA, and mdgB). Acronyms: sjd, San Juan defense; ldg, lambda defense gene; ddg, Dallas defense gene; tdg, T-even defense gene; mdg, modification defense gene. (B) Heatmap depicting EOP values relative to GFP controls for each defense against a panel of seven phages. (C) A heatmap illustrating the prevalence of defense proteins across different phyla. (D–F) T4 infection of defense system and GFP-expressing E. coli cells using MOIs of 0.01 and 10. Defense systems tested included (D) San Juan, (E) Dallas, and (F) tdgA. At the time point indicated by red arrows (5 h), parallel infections were sampled and PFUs enumerated by plaque assay to quantify free phages. (G) Free T4 PFU counts at t = 5 h from infections depicted in D–F from MOI 10 experiments. The same starting phage titer was used for all experiments and is depicted via the dashed line to indicate whether free phages increased or decreased in each sample. Asterisks (**) indicate significant differences compared with GFP (p < 0.001, one-way ANOVA). (H) Top, mutants in T4Escaper mapped to two loci, encoding late expressed wedge and terminase proteins. Bottom, EOP for T4WT and T4Escaper against Dallas and GFP-expressing cells. The EOP for GFP cells is defined as 1. Asterisks (**) indicate significant difference between T4WT and T4Escaper (p < 0.001, Welch’s t test). (I) Model depicting the engagement of T4 capsid, portal, and large terminase proteins to highlight the location of the putative T287N mutation in the terminase. As indicated in the inset, this mutation occurs at the portal-facing side of the large terminase and couples ATPase activity to genomic DNA translocation during T4 packaging (see text). PDB models used in I are indicated parenthetically. All experiments performed in at least biological triplicate; error bars depict standard deviation. PFU; plaque forming units. See also Figures S5–S7.
Figure 6.
Figure 6.. Metagenomic nucleases exhibit phage defense
(A) A predicted catalytic residue in MdgA and its impact on T4 infection as measured via plaque assay; ** p ≤ 0.001 (Welch’s t test, WT vs. mutant). (B) A predicted catalytic residue in MdgB and its impact on T4 infection as measured via plaque assay; *** p ≤ 0.0001 (Welch’s t test, WT vs. mutant). (C) Purified MdgA incubated with T4 and T4-GT7 genomic DNA for 10 at different concentrations. Reaction products were analyzed as in Figure 3C. (D) The degradation of T4 genomic DNA by MdgA and its catalytic mutant. Reaction products were analyzed as in Figure 3C. (E) A cartoon model depicting the interoperable defense activity of modification-dependent nucleases across different host backgrounds. Green, orange depict lineage-specific arms races where nucleases recognize and cleave modifications on their target phage genome. This activity is cross-compatible across hosts. All experiments performed in biological triplicate; error bars depict standard deviation.

Update of

Similar articles

References

    1. Forsberg KJ, and Malik HS (2018). Microbial Genomics: The Expanding Universe of Bacterial Defense Systems. Curr. Biol. 28, R361–R364. 10.1016/j.cub.2018.02.053. - DOI - PubMed
    1. Georjon H, and Bernheim A (2023). The highly diverse antiphage defence systems of bacteria. Nat. Rev. Microbiol. 21, 686–700. 10.1038/s41579-023-00934-x. - DOI - PubMed
    1. Mayo-Muñoz D, Pinilla-Redondo R, Camara-Wilpert S, Birkholz N, and Fineran PC (2024). Inhibitors of bacterial immune systems: discovery, mechanisms and applications. Nat. Rev. Genet. 25, 237–254. 10.1038/s41576-023-00676-9. - DOI - PubMed
    1. Murtazalieva K, Mu A, Petrovskaya A, and Finn RD (2024). The growing repertoire of phage anti-defence systems. Trends Microbiol. 32, 1212–1228. 10.1016/j.tim.2024.05.005. - DOI - PubMed
    1. Amitsur M, Levitz R, and Kaufmann G (1987). Bacteriophage T4 anti-codon nuclease, polynucleotide kinase and RNA ligase reprocess the host lysine tRNA. EMBO J. 6, 2499–2503. 10.1002/j.1460-2075.1987.tb02532.x. - DOI - PMC - PubMed

LinkOut - more resources