. 2025 Jul 30;16(1):7009.
doi: 10.1038/s41467-025-62354-0.

Sociodemographic factors, biomarkers and comorbidities associated with post-acute COVID-19 sequelae in UK Biobank

Affiliations

Sociodemographic factors, biomarkers and comorbidities associated with post-acute COVID-19 sequelae in UK Biobank

Marta Alcalde-Herraiz et al. Nat Commun. .

Abstract

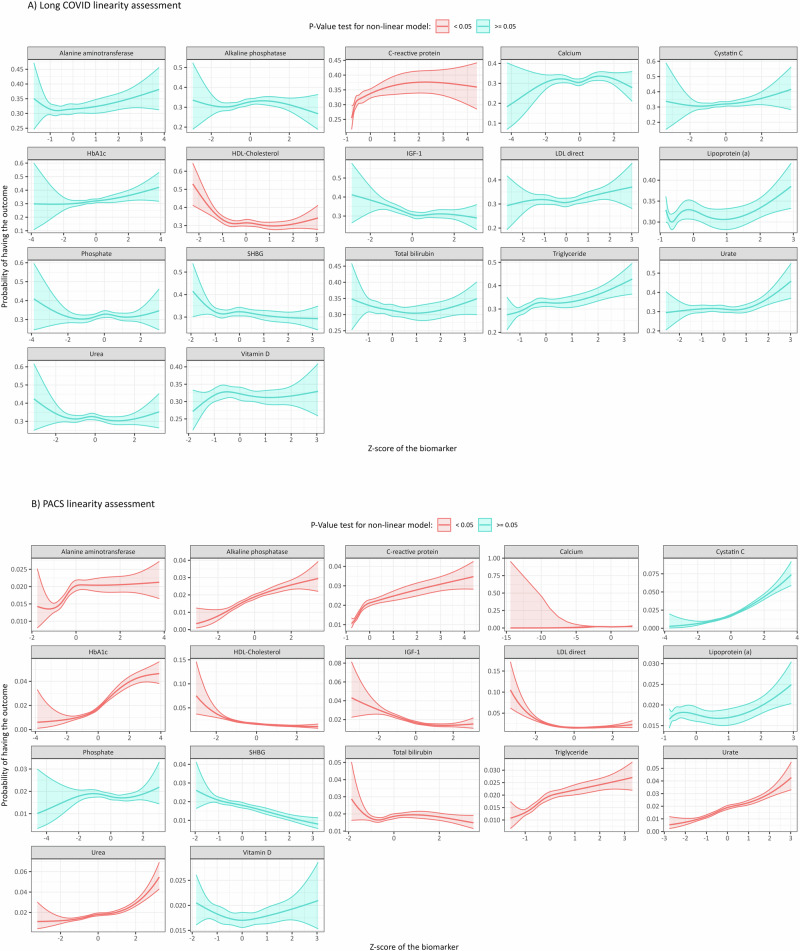
Long-term sequelae of COVID-19 remain critical public health concerns, with limited therapeutic options available. We conducted two case-control studies among COVID-19 infected individuals in the UK Biobank to explore the association of sociodemographic factors, clinical biomarkers, and comorbidities with the risk of two key phenotypes: Long COVID (LC, defined by patient self-report symptoms) and post-acute complications of SARS-CoV-2 infection (PACS, defined by clinical diagnosis), separately. Our study included 8,668 participants in the LC cohort (32% classified as cases) and 108,407 in the PACS cohort (with 2% being cases). Findings showed that age and sex were associated with both LC and PACS but in opposite directions. Additionally, obesity, socioeconomic deprivation, elevated C-reactive protein, triglyceride, vitamin D, HbA1c, cystatin C, urate, and alanine aminotransferase, and decreased HDL cholesterol and IGF-1, as well as CKD and COPD, were associated with LC. Most of these factors were also significant for PACS, except for alanine aminotransferase and vitamin D. These findings have potential mechanistic implications for the distinction between LC and PACS and can guide clinical implementation of identifying high-risk groups for targeted vaccination or other public health mitigation strategies.


Conflict of interest statement

Competing interests: DPA research group from the University of Oxford has received research grants from the European Medicines Agency, from the Innovative Medicines Initiative, from Gilead Science, and from UCB Biopharma. S.I., J.J.W., W.N., Y.L., and M.B. are employees of Gilead Sciences and may own stock in the company. The remaining authors declare no competing interests.

Figures

Fig. 1
Fig. 1. Scheme of the overall study design to create the cohorts.
Note: PACS post acute COVID-19 sequelae, UK United Kingdom.
Fig. 2
Fig. 2. Linearity assessment.
Evaluation of the non-linear relationship between the biomarkers and A Long COVID or B PACS using a natural cubic spline model. Error bands were calculated using 95% confidence intervals. The two-sided P-value was calculated using ANOVA. Red colour indicates a P-value smaller than 0.05, indicating that the non-linear model is a better fit compared to the linear model. Blue colour indicates a P-value higher than 0.05, suggesting that the non-linear model and the linear model are similar. Note: Notice that the non-linear test was performed between the log-odds of the outcome model, not the probability of the outcome itself. However, the probability of the outcome is plotted as it is more intuitive and accessible for interpretation. Notice that the shape of the curve is similar when plotted on the log-odds scale.
Fig. 3
Fig. 3. Forest plot of Long COVID regression results.
Long COVID cohort included 8668 participants, with 2751 (32%) classified as cases and 5917 (68%) as controls. Data is presented as an odds ratio (OR) with 95% confidence intervals (CI). OR was calculated using a logistic regression. The two-sided p-value was calculated using ANOVA. A Results including only baseline characteristics and risk factors. Dark blue corresponds to crude findings; light blue corresponds to adjusted findings. B Results including only biomarker results. Dark maroon corresponds to crude findings; light maroon corresponds to adjusted findings. C Results including only the comorbidities results. Orange corresponds to crude findings; yellow corresponds to adjusted findings.
Fig. 4
Fig. 4. Forest plot of PACS regression results.
PACS cohort included 108,407 participants, with 1940 (2%) classified as cases and 106,467 classified as controls (98%). Data is presented as an odds ratio (OR) with 95% confidence intervals (CI). OR was calculated using a logistic regression. The two-sided p-value was calculated using ANOVA. A Results including only baseline characteristics and risk factors. Dark blue corresponds to crude findings; light blue corresponds to adjusted findings. B Results including only biomarker results. Dark maroon corresponds to crude findings; light maroon corresponds to adjusted findings. C Results including only the comorbidities results. Orange corresponds to crude findings; yellow corresponds to adjusted findings.

References

    1. Parotto, M. et al. Post-acute sequelae of COVID-19: understanding and addressing the burden of multisystem manifestations. Lancet Respir. Med.11, 739–754 (2023). - PubMed
    1. Munblit, D. et al. A core outcome set for post-COVID-19 condition in adults for use in clinical practice and research: an international Delphi consensus study. Lancet Respir. Med.10, 715–724 (2022). - PMC - PubMed
    1. Office of National Statistics. Prevalence of ongoing symptoms following coronavirus (COVID-19) infection in the UK: 30 March 2023. https://www.ons.gov.uk/peoplepopulationandcommunity/healthandsocialcare/.... Accessed 29/05/2025.
    1. Peluso, M. J. & Deeks, S. G. Mechanisms of long COVID and the path toward therapeutics. Cell187, 5500–5529 (2024). - PMC - PubMed
    1. Chippa, V., Aleem, A. & Anjum, F. Postacute coronavirus (COVID-19) syndrome. In: StatPearls. Treasure Island (FL) (2025). - PubMed