Randomized Controlled Trial
. 2025 Jul 30;16(1):6989.
doi: 10.1038/s41467-025-62362-0.

Long-term effect of temporary ART initiated during primary HIV-1 infection on viral persistence

Affiliations
Randomized Controlled Trial

Long-term effect of temporary ART initiated during primary HIV-1 infection on viral persistence

Alexander O Pasternak et al. Nat Commun. .

Abstract

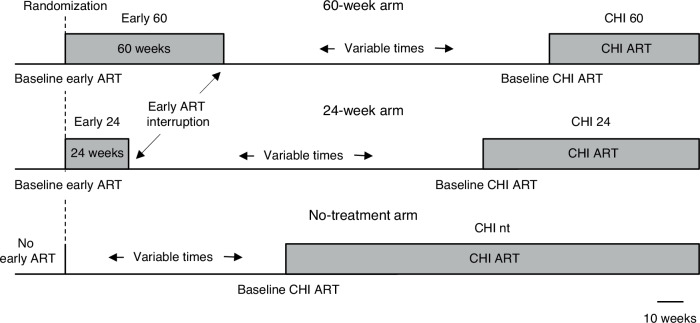
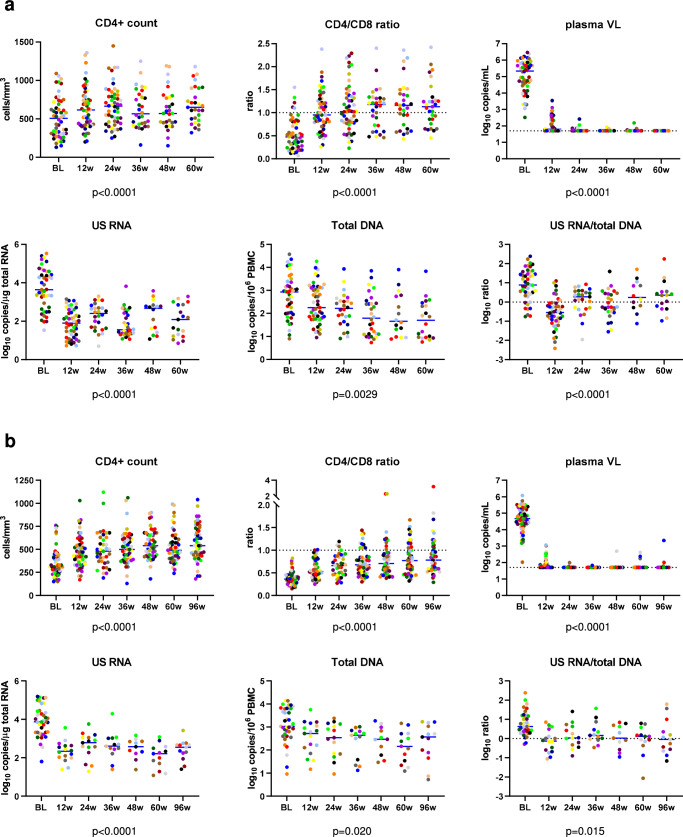
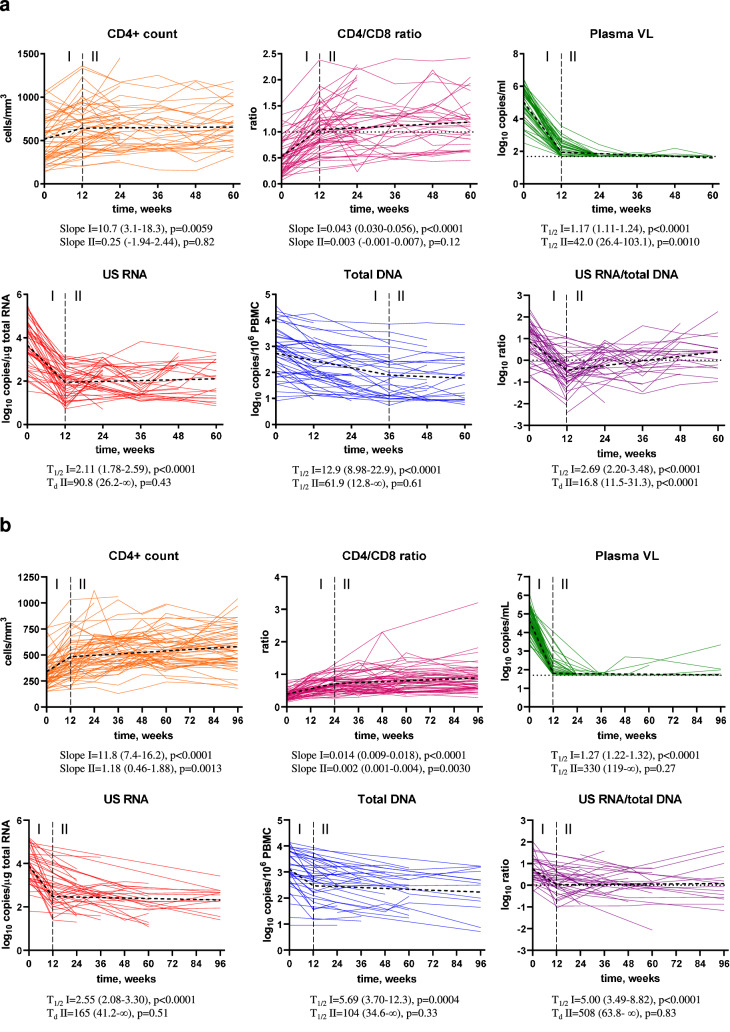
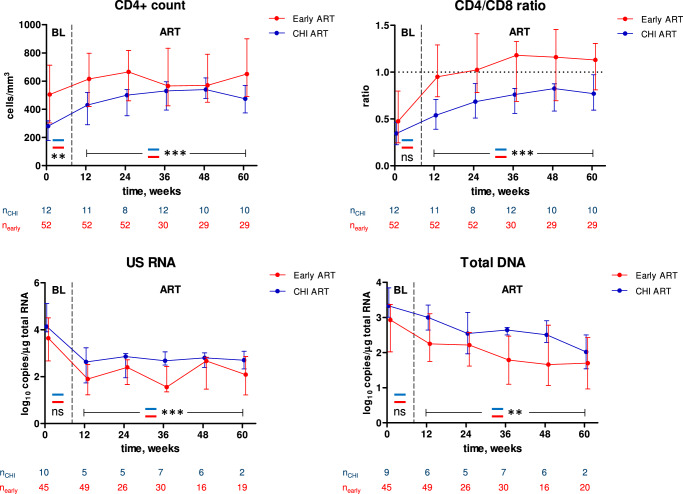
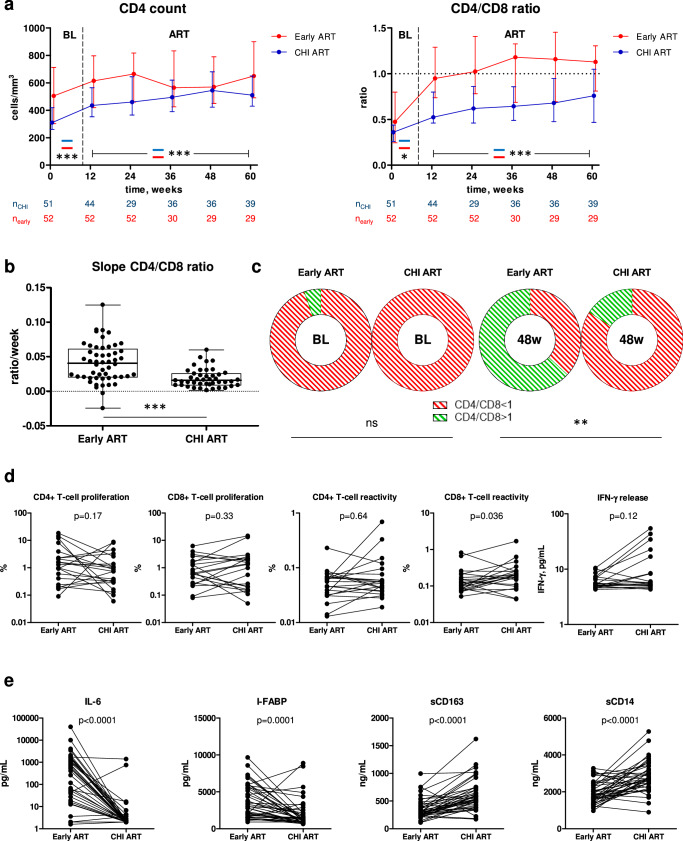
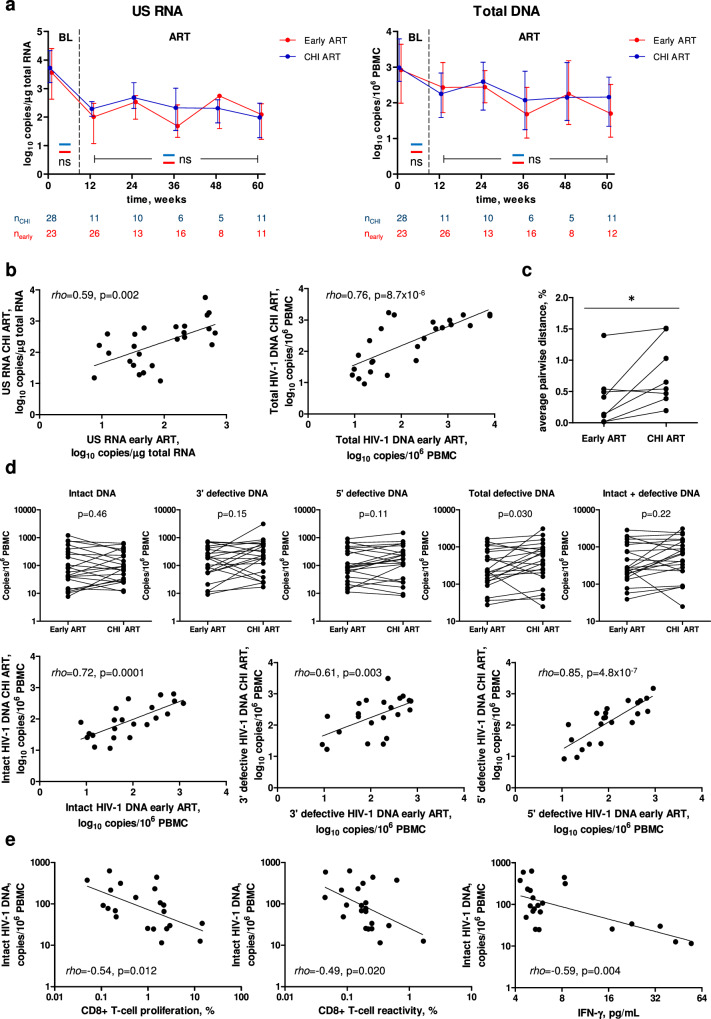
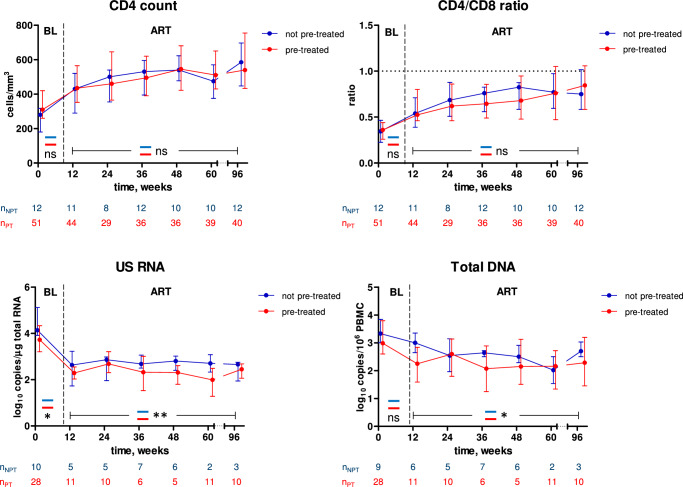
Initiation of antiretroviral therapy (ART) during primary HIV-1 infection (PHI) has been proposed to limit the formation of HIV-1 reservoirs. However, it remains unknown whether temporary ART initiated during PHI has a long-term effect on viral persistence. Here, we longitudinally quantify HIV-1 persistence markers and immunological parameters in the participants (n = 64) of a randomized controlled trial comparing 24 or 60 weeks of temporary ART vs. no treatment during PHI, who subsequently (re)initiated ART during chronic HIV-1 infection (CHI) after a median period of 116 weeks without treatment (ISRCTN59497461). Levels of several HIV-1 persistence markers (cell-associated unspliced RNA, total DNA, and intact DNA) do not significantly differ and strongly positively correlate between early and CHI ART periods in the same participants. Early ART is associated with lower HIV-1 proviral sequence diversity and superior restoration of the CD4/CD8 ratio, as well as lower levels of monocyte activation markers, compared to CHI ART, in the same participants. At CHI ART, intact HIV-1 DNA negatively correlates with HIV-specific T-cell responses. Finally, levels of HIV-1 persistence markers during CHI ART are lower in participants who had been pre-treated during PHI, indicating a long-term suppressive effect of temporary early ART on the persistence of HIV-1 reservoir.


Conflict of interest statement

Competing interests: The authors declare the following competing interests. F.W.W. has served on the advisory board of ViiV Healthcare, paid to his institution. The other authors declare no competing interests.

Figures

Fig. 1
Fig. 1. Schematic of the study.
Participants received either no treatment (n = 12), 24 weeks (n = 23), or 60 weeks (n = 29) of early ART. After a period without treatment, participants (re)started ART at chronic HIV infection (CHI). Durations of periods with and without treatment are drawn to scale, as depicted below. The durations of periods without treatment shown in the figure correspond to the median periods without treatment in each of the three arms. nt, no treatment during early ART.
Fig. 2
Fig. 2. Levels of HIV-1 persistence and immunological response parameters.
Levels of parameters at baseline (BL) and at 12, 24, 36, 48, 60 weeks of early ART (a) and 12, 24, 36, 48, 60, and 96 weeks CHI ART (b) are shown. Participants are color-coded. For plasma viral load (VL), the limit of detection of the commercial assays (50 copies/mL) is shown with a dashed line. Data points represent individual participants (n = 52 for early ART (all parameters), n = 64 for CHI ART (CD4+ count, CD4/CD8 ratio, plasma VL), n = 39 for CHI ART (US RNA, total DNA, US RNA/total DNA ratio)). Repeated-measures mixed-effects analyses with Tukey corrections for multiple comparisons were used for data analysis. P values represent the significance of the change of each parameter between the time points. Source data are provided as a Source Data file.
Fig. 3
Fig. 3. Longitudinal dynamics of HIV-1 persistence and immunological response.
Longitudinal dynamics of measured parameters during early (a) and CHI (b) ART were fitted to a two-phase segmentation model with change points chosen for every parameter based on the optimal model fit. For CD4+ count and CD4/CD8 ratio, slope values and their 95% confidence intervals during phases I and II are shown. For log-transformed virological biomarkers, half-lives (T1/2) or doubling times (Td) and their 95% confidence intervals during phases I and II are shown. Extra sum of squares F tests were used to analyse the data. P values indicate the significance of longitudinal changes in the measured parameters during phases I and II. Source data are provided as a Source Data file.
Fig. 4
Fig. 4. Comparisons between early and CHI ART in different participants.
Parameters were compared between participants treated with early ART (red) and the no-treatment arm during the first 60 weeks of CHI ART (blue). Median values and interquartile ranges are shown. Baseline parameters were compared using Mann–Whitney tests (two-sided) and parameters measured under ART were compared using repeated-measures mixed-effects modelling. Numbers of participants per time point are indicated below the graphs. ***, p < 0.001; **, 0.001 < p < 0.01; ns, not significant. Exact p values are as follows. CD4 count: p = 0.0035 (baseline), p = 1.3*10−5 (ART). CD4/CD8 ratio: p = 0.15 (baseline), p = 6.6*10−8 (ART). US RNA: p = 0.10 (baseline), p = 2.1*10−5 (ART). Total DNA: p = 0.051 (baseline), p = 0.0058 (ART). Source data are provided as a Source Data file.
Fig. 5
Fig. 5. Comparisons of immunological response to early and CHI ART in the same participants.
a Comparisons of CD4+ count and CD4/CD8 ratio between early (red) and CHI ART (blue) periods. Median values and interquartile ranges are shown. Baseline parameters were compared using Mann–Whitney tests (two-sided) and parameters measured under ART were compared using repeated-measures mixed-effects modelling. Numbers of participants per time point are indicated below the graphs. *, 0.01 <p < 0.05; ***, p < 0.001. Exact p values are as follows. CD4 count: p < 0.0001 (baseline), p = 7.5*10−8 (ART). CD4/CD8 ratio: p = 0.035 (baseline), p = 4.4*10−19 (ART). b Comparison of the CD4/CD8 ratio slopes during the first 12 weeks of early and CHI ART in the same participants. Box-and-whiskers plots show the median, quartiles, minimum and maximum values. Data points represent individual participants (n = 52 for early ART, n = 43 for CHI ART). Wilcoxon signed-rank test (two-sided) was used for the comparison. ***, p < 0.0001. c Normalization of CD4/CD8 ratio between baseline (BL) and 48 weeks of early and CHI ART in the same participants. Proportions of participants with CD4/CD8 ratio <1 (red) and >1 (green) are depicted with doughnut charts and compared between early and CHI ART by Fisher’s exact tests (two-sided). **, 0.001<p < 0.01; ns, not significant. d Comparisons of functional HIV-specific CD4+ and CD8 + T-cell responses between early and CHI ART in the same participants. Data points represent individual participants (n = 21 for CD4+ and CD8 + T-cell proliferation, n = 22 for CD4+ and CD8 + T-cell reactivity and IFN-γ release). Wilcoxon signed rank tests (two-sided) were used to calculate statistical significance. e Comparisons of plasma biomarkers of systemic inflammation, intestinal damage, and monocyte activation between early and CHI ART in the same participants. Data points represent individual participants (n = 41). Wilcoxon signed rank tests (two-sided) were used to calculate statistical significance. For all panels, source data are provided as a Source Data file.
Fig. 6
Fig. 6. Comparisons of HIV-1 persistence markers between early and CHI ART in the same participants.
a Comparisons of US RNA and total HIV-1 DNA between early (red) and CHI ART (blue) periods. Median values and interquartile ranges are shown. Baseline parameters were compared using Mann-Whitney tests (two-sided) and parameters measured under ART were compared using repeated-measures mixed-effects modelling. Numbers of participants per time point are indicated below the graphs. ns, not significant. Exact p values are as follows. US RNA: p = 0.52 (baseline), p = 0.077 (ART). Total DNA: p = 0.19 (baseline), p = 0.77 (ART). b Correlations between the average levels of US RNA or total DNA measured during early and CHI ART in the same participants. Data points represent individual participants (n = 25). Spearman tests (two-sided) were used to calculate statistical significance. c Comparison of HIV-1 sequence diversity between early and CHI ART in the same participants. HIV-1 diversity was calculated as average pairwise distance (APD). Data points represent individual participants (n = 8). Wilcoxon signed rank test (two-sided) was used to calculate statistical significance. *, 0.01 < p < 0.05. Exact p value: p = 0.023. d Comparisons and correlations of intact and defective HIV-1 DNA levels between early and CHI ART in the same participants. Data points represent individual participants (n = 22). Wilcoxon signed rank tests (for comparisons) and Spearman tests (for correlations) were used to calculate statistical significance (all tests were two-sided). e Correlations between functional HIV-specific T-cell responses and intact HIV-1 DNA at CHI ART. Data points represent individual participants (n = 21 for CD8 + T-cell proliferation, n = 22 for CD8 + T-cell reactivity and IFN-γ release). Spearman tests (two-sided) were used to calculate statistical significance. For all panels, source data are provided as a Source Data file.
Fig. 7
Fig. 7. Comparisons between pre-treated and not pre-treated participants during CHI ART.
Parameters were compared between participants who had (red) and had not (blue) been pre-treated with early ART. Median values and interquartile ranges are shown. Baseline parameters were compared using Mann–Whitney tests (two-sided) and parameters measured under ART were compared using repeated-measures mixed-effects modelling. Numbers of participants per time point are indicated below the graphs. **, 0.001

Similar articles

References

    1. Deeks, S. G. et al. Research priorities for an HIV cure: International AIDS Society Global Scientific Strategy 2021. Nat. Med.27, 2085–2098 (2021). - PubMed
    1. Pasternak, A. O. & Berkhout, B. HIV persistence: silence or resistance?. Curr. Opin. Virol.59, 101301 (2023). - PubMed
    1. Darcis, G., Berkhout, B. & Pasternak, A. O. The quest for cellular markers of HIV reservoirs: any color you like. Front. Immunol.10, 2251 (2019). - PMC - PubMed
    1. Colby, D. J. et al. Rapid HIV RNA rebound after antiretroviral treatment interruption in persons durably suppressed in Fiebig I acute HIV infection. Nat. Med,24, 923–926 (2018). - PMC - PubMed
    1. Henrich, T. J. et al. HIV-1 persistence following extremely early initiation of antiretroviral therapy (ART) during acute HIV-1 infection: an observational study. PLoS Med.14, e1002417 (2017). - PMC - PubMed

Publication types

MeSH terms