. 2025 Jul 30;16(1):6987.
doi: 10.1038/s41467-025-61242-x.

De novo pyrimidine biosynthesis inhibition synergizes with BCL-XL targeting in pancreatic cancer

Affiliations

De novo pyrimidine biosynthesis inhibition synergizes with BCL-XL targeting in pancreatic cancer

Huan Zhang et al. Nat Commun. .

Abstract

Oncogenic KRAS induces metabolic rewiring in pancreatic ductal adenocarcinoma (PDAC) characterized, in part, by dependency on de novo pyrimidine biosynthesis. Pharmacologic inhibition of dihydroorotate dehydrogenase (DHODH), an enzyme in the de novo pyrimidine synthesis pathway, delays pancreatic tumor growth; however, limited monotherapy efficacy suggests that compensatory pathways may drive resistance. Here, we use an integrated metabolomic, proteomic and in vitro and in vivo DHODH inhibitor-anchored genetic screening approach to identify compensatory pathways to DHODH inhibition (DHODHi) and targets for combination therapy strategies. We demonstrate that DHODHi alters the apoptotic regulatory proteome thereby enhancing sensitivity to inhibitors of the anti-apoptotic BCL2L1 (BCL-XL) protein. Co-targeting DHODH and BCL-XL synergistically induces apoptosis in PDAC cells and patient-derived organoids. The combination of DHODH inhibition with Brequinar and BCL-XL degradation by DT2216, a proteolysis targeting chimera (PROTAC), significantly inhibits PDAC tumor growth. These data define mechanisms of adaptation to DHODHi and support combination therapy targeting BCL-XL in PDAC.


Conflict of interest statement

Competing interests: J.D.M. reports research support to his institution from Novartis and Casma Therapeutics and has consulted for Third Rock Ventures and Skyhawk Therapeutics, all unrelated to the submitted work. A.J.A. has consulted for Anji Pharmaceuticals, Affini-T Therapeutics, Arrakis Therapeutics, AstraZeneca, Boehringer Ingelheim, Kestrel Therapeutics, Merck & Co., Inc., Mirati Therapeutics Inc., Nimbus Therapeutics, Oncorus, Inc., Plexium, Quanta Therapeutics, Revolution Medicines, Reactive Biosciences, Riva Therapeutics, Servier Pharmaceuticals, Syros Pharmaceuticals, T-knife Therapeutics, Third Rock Ventures, and Ventus Therapeutics; holds equity in Riva Therapeutics and Kestrel Therapeutics; and has research funding from Amgen, Boehringer Ingelheim, Bristol Myers Squibb, Deerfield, Inc., Eli Lilly, Mirati Therapeutics Inc., Novartis, Novo Ventures, Revolution Medicines, and Syros Pharmaceuticals, all unrelated to the submitted work. S.K.D. has received research funding from Novartis, Bristol Myers Squibb, Casma Therapeutics and Takeda, has equity in Axxis Bio, and is a co-founder and SAB member for Kojin Therapeutics, all unrelated to the submitted work. All authors declare no competing interests.

Figures

Fig. 1
Fig. 1. Defining mechanisms of short- and long-term adaptation to DHODH inhibition in PDAC by an integrated multi-omics approach.
a Multi-omic workflow used to define adaptation to DHODH inhibition, see Methods and text for additional details (Santana-Codina, N. (2025) https://BioRender.com/a62aees). b Fold change of metabolites in the pyrimidine synthesis pathway (left: 24 h, right: 7 days). Asp: aspartate; N-Carb-L-Asp: N-Carbamoyl-L-Aspartate; DHO: dihydroorotate; UMP/UDP/UTP, uridine mono/di/triphosphate; CTP, cytidine triphosphate; dTTP, deoxythymidine triphosphate. Data are shown as mean values with error bars representing s.d. of n = 3 independent plates. Significance determined with t-test (unpaired, two-tailed) for cells treated with BQ vs. vehicle (*p  <  0.05, **p  <  0.01, ***p  <  0.001). c Ratio of reduced-to-oxidized glutathione (GSH/GSSG) in PaTu-8988T cells. Ratios normalized to each DMSO condition and represented as fold change of 24 h and 7 day BQ-treated cells (0.5 and 5 μM), n = 3 independent plates. Significance determined with t-test (unpaired, two-tailed) for BQ vs. vehicle (*p  <  0.05, **p  <  0.01). d, e Volcano plot of protein abundance in PaTu-8988T cells treated with 5 μM BQ at 24 h (d) and 7 days (e). Plots display −log10 (FDR) versus log2 relative protein abundance of mean BQ to DMSO-treated samples. Red circles: log2 fold change≥1, FDR < 0.01; blue circles: log2 fold change ≤ −1, FDR < 0.01; data from 3 DMSO or 3 BQ-treated independent plates. f Enrichment map of gene set enrichment analysis (GSEA) of BQ-proteome (PaTu-8988T, 7 days, 0.5 μM). FDR < 0.01, Jaccard coefficient>0.25, node size related to number of components within a gene set, line width proportional to overlap between related gene sets. GSEA terms associated with upregulated (red), and downregulated (blue) proteins colored accordingly and grouped into nodes with associated terms. g BQ-anchored whole-genome in vitro screen in PaTu-8988T cells lentivirally transduced with the Brunello library (19,114 genes/76,441 sgRNAs), treated with BQ (0.5 or 5 μM, 2 weeks) followed by next-generation sequencing (Santana-Codina, N. (2025) https://BioRender.com/4lblqps). h Manhattan plot for depleted hits in PaTu-8988T (5 μM BQ) including significant genes (−log10(P)≥3) in BQ vs. DMSO (blue dots), apoptosis genes (orange), nucleoside salvage pathway genes (green). All source data including p values are provided as Source Data file.
Fig. 2
Fig. 2. Targeted in vivo CRISPR/Cas9 loss-of-function screen identifies synthetic lethalities with BQ in PDAC.
a A customized CRISPR/Cas9 mini-pool library (369 genes, 4 sgRNAs per gene, 528 control sgRNA) was generated prioritizing proteomic hits with FDA-approved available drugs, CRISPR depleted/enriched hits, and genes related to DHODH in published in vitro studies. b Schematic for in vivo and in vitro CRISPR screens with customized mini-pool library (Santana-Codina, N. (2025) https://BioRender.com/t12d46e). PDAC cells were infected with the mini-pool library and implanted in a xenograft NOG mouse model (PaTu-8988T, n = 10 mice/arm). Tumor-bearing mice (80–100 mm3) were treated with either vehicle or BQ, harvested 14 days later and analyzed by NGS. PaTu-8988T and PANC-1 cells containing the sgRNA mini-library were also evaluated in in vitro screens to confirm the whole genome screen results and directly contrast to in vivo results. c, d Manhattan plot for depleted hits in a mini-pool library in vitro CRISPR/Cas9 screen in PaTu-8988T (c) and PANC-1 (d) cells at 5 μM BQ. Blue dots highlight significant genes (−log10(P) ≥ 2) in BQ versus DMSO, orange circles highlight genes related to apoptosis and cyan circles highlight genes in the nucleoside salvage pathway. e Rank-ordered graph of log2 (BQ/control) for each gene in PaTu-8988T tumors. f Manhattan plot for depleted hits in PaTu-8988T tumors. Blue dots highlight significant genes (-log10(P) ≥2) in BQ versus vehicle, orange circles highlight genes related to apoptosis and cyan circles highlight genes in the nucleoside salvage pathway. Source data are provided as a Source Data file.
Fig. 3
Fig. 3. Combination of BQ and DT2216 synergistically induces apoptosis in PDAC cell lines.
a, b Synergy score heatmaps of combination treatment with BQ and DT2216 in PaTu-8902 and PaTu-8988T cells. Synergy score between the two drugs was calculated using the HSA model implemented in SynergyFinder (antagonism: <− 10; additive effect: from − 10 to 10; synergistic effect: >10). Experiments performed in biological triplicate, data shown as mean HSA score of three technical replicates of one representative experiment. c, d Apoptosis induction was assessed using flow cytometry with FITC Annexin V staining in PaTu-8902 and PaTu-8988T cells following treatment with DMSO, DT2216 (2 µM), or BQ (5 µM), either alone or in combination, with or without 100 µM uridine for 72 hours. The percentage of apoptotic cells was determined as the sum of Annexin V-positive and Annexin V/propidium iodide double-positive populations, representing early and late apoptosis, respectively. Error bars represent s.d. of three technical replicates, representative of three independent experiments. e, f Real-time accumulation of Annexin V fluorescence in PaTu-8902 and PaTu-8988T cells was monitored using the Incucyte system. Cells were labeled with Annexin V Red Dye and treated with the indicated concentrations of BQ or DT2216 alone or in combination or BQ + DT2216 with uridine (100 µM) or Z-VAD-FMK (50 µM) for 72 hours. (RCU: Red Calibrated Unit). Data are shown as mean values with error bars representing the s.d. from three technical replicates, representative of two independent experiments. Source data are provided as a Source Data file.
Fig. 4
Fig. 4. BQ modulates levels of BCL-2 family proteins and enhances sensitivity to BCL-XL PROTAC-based degradation in PDAC.
a, b Flow cytometry-based BH3 profiling of PaTu-8902 and PaTu-8988T cells treated with BQ for 7 days shows priming (a) and specificity of BCL-2 protein family apoptotic dependency (b). Apoptosis is measured by Cytochrome c release (y-axis). Alamethicin (AlaM) and DMSO were used as positive and negative control for apoptosis induction, respectively. Experimental data sets (a, b) were derived from the same experiments and analyzed using same ALaM and DMSO controls. Conditions: BIM, BID and PUMA BH3 peptides inhibit all anti-apoptotic BCL-2 family proteins (BIM and BID also directly activate BAX and BAK), BAD BH3 peptide inhibits BCL2, BCL-W and BCL-XL, HRK and MS1 peptides inhibit BCL-XL and MCL1, respectively. Data are presented as mean relative Cytochrome c release of two biologically independent experiments each with technical duplicate measurements, n = 4 (3 measurements for PaTu-8902 BQ 5 μΜ include two duplicates from one experiment and one measurement from the second experiment). Error bars represent s.d. of all measurements. c, d Immunoblot analysis of BCL-2 family proteins in lysates from PaTu-8902 and PaTu-8988T cells treated with 5 µM BQ for 24 and 48 hours (c) or the indicated concentrations of DT2216 for 16 hours (d). e Immunoblot analysis of BCL-2 family proteins in lysates from PaTu-8902 and PaTu-8988T cells treated with 5 µM BQ or 5 µM DT2216 alone or BQ in combination with DT2216 for 24 hours. f Apoptosis regulatory gene expression assessed by qRT-PCR in PaTu-8902 and PaTu-8988T cells treated with 5 μM BQ, 24 hours. Expression levels normalized to GAPDH and presented as mean ± s.d. of 3 independent replicates (representative of three independent experiments). Significance was determined by t-test, **** p < 0.0001 (BCL2L1 encodes BCL-XL; BCL2L11 encodes BIM). g Immunoblot analysis of p65 (RelA subunit of NF-κB) and p105 (precursor of the NF-κB p50 subunit) activation in lysates from PaTu-8902 and PaTu-8988T cells treated for 24 and 48 hours with BQ (5 µM). Source data are provided as a Source Data file.
Fig. 5
Fig. 5. Synergistic effects with BQ are specific to BCL-XL inhibition in PDAC.
af Percentage cell viability of PaTu-8902 and PaTu-8988T cells after treatment with increasing concentrations of BQ with DT2216 (BCL-XL PROTAC), AZD-5991 (MCL1 inhibition) or Venetoclax (BCL2 inhibition) for 5 days. IC50 values are shown for a representative experiment out of three independent experiments. Error bars represent s.d. of two-three technical replicates (two technical replicates for BQ alone conditions). g, h Clonogenic growth of PaTu-8902 and PaTu-8988T cells treated with BQ (5 µM), DT2216 (5 µM), Venetoclax (5 µM), AZD-5991 (5 µM) or DT2216, Venetoclax or AZD-5991 in combination with BQ. Data are shown as mean values with error bars representing the s.d. of average of three independent experiments (each in three technical replicates). Significance was determined with t test (unpaired, two-tailed). *p  <  0.05, ****p  <  0.0001. Source data are provided as a Source Data file.
Fig. 6
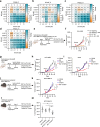
Fig. 6. DT2216 increases the antitumor efficacy of BQ in patient-derived PDAC organoids and PDAC mouse models.
ad Synergy score heatmaps based on cell viability data from patient-derived PDAC organoids treated with DT2216 and BQ. Synergy score calculated using the HSA model in SynergyFinder. Experiments were repeated two independent times, and data are shown as mean HSA score of three technical replicates from one experiment. e Experimental design of (f). f Tumor volume of PaTu-8902 BCL-XL KO tumors (non-targeting n = 7, non-targeting + BQ n = 7, BCL-XL KO n = 8, BCL-XL KO + BQ n = 9 per arm) after treatment with vehicle or 10 mg/kg BQ three times a week for 3 weeks. Error bars represent s.e.m. Statistical significance determined by ordinary one-way ANOVA test. *p  <  0.05, ***p  <  0.001, ****p  <  0.0001 (p = 0.024, non-targeting vs. BCL-XL KO; p = 0.020, non-targeting + BQ vs. BCL-XL KO + BQ; p = 0.0007, non-targeting vs. non-targeting + BQ; p = 0.0002, BCL-XL KO vs. BCL-XL KO + BQ). g Experimental design of PaTu-8902 and HPAC xenograft flank tumor studies. h, i Tumor growth curves from PaTu-8902 (h, n = 13 per arm) and HPAC (i, n = 7 per arm) xenograft mouse models treated with vehicle, BQ, DT2216, or combination for 3 weeks. Error bars represent s.e.m. Statistical significance determined by one-way ANOVA. h *p = 0.014, BQ vs BQ + DT2216; ****p  <  0.0001. i ***p < 0.001 (p = 0.0003, BQ vs BQ + DT2216; p  =  0.0004, DT2216 vs BQ + DT2216; p <  0.0001, Vehicle vs BQ + DT2216. j Experimental design of KPCY 6694 C2 syngeneic flank allograft study in (k). k Tumor growth curves of KPCY 6694 C2 syngeneic flank model treated with vehicle (n = 12), BQ (n = 13), DT2216 (n = 11) or combination (n = 11) for 3 weeks. For flank-based tumor in vivo studies, tumors were measured twice a week. Error bars represent s.e.m. Statistical significance determined by one-way ANOVA (**p = 0.0034: BQ vs. BQ + DT2216; ****p  <  0.0001: Vehicle or DT2216 vs. BQ + DT2216). l Experimental design of KPCY 6694 C2 syngeneic orthotopic tumor study. m Tumor weight of KPCY 6694 C2 orthotopic tumors (n = 10 per arm, n = 8 for BQ + DT2216 group) after treatment with vehicle, BQ, DT2216, or combination for 16 days. Error bars represent ± s.e.m. Statistical significance determined by one-way ANOVA test, *p  <  0.05, **p  <  0.01 (p = 0.025, BQ vs BQ + DT2216; p = 0.001, Vehicle vs. BQ + DT2216; p = 0.003, DT2216 vs. BQ + DT2216). (Mancias, J. (2025) https://BioRender.com/i4zww2l). Source data provided as Source Data file.

References

    1. Hanahan, D. Hallmarks of cancer: new dimensions. Cancer Discov.12, 31–46 (2022). - PubMed
    1. Ying, H. et al. Oncogenic Kras maintains pancreatic tumors through regulation of anabolic glucose metabolism. Cell149, 656–670 (2012). - PMC - PubMed
    1. Santana-Codina, N. et al. Oncogenic KRAS supports pancreatic cancer through regulation of nucleotide synthesis. Nat. Commun.9, 4945 (2018). - PMC - PubMed
    1. Mullen, N. J. & Singh, P. K. Nucleotide metabolism: a pan-cancer metabolic dependency. Nat. Rev. Cancer23, 275–294 (2023). - PMC - PubMed
    1. Ali, E. S. & Ben-Sahra, I. Regulation of nucleotide metabolism in cancers and immune disorders. Trends Cell Biol.33, 950–966 (2023). - PMC - PubMed

MeSH terms