. 2025 Aug;10(8):1854-1867.
doi: 10.1038/s41564-025-02059-8. Epub 2025 Jul 30.

The food-associated resistome is shaped by processing and production environments

Affiliations

The food-associated resistome is shaped by processing and production environments

Narciso M Quijada et al. Nat Microbiol. 2025 Aug.

Abstract

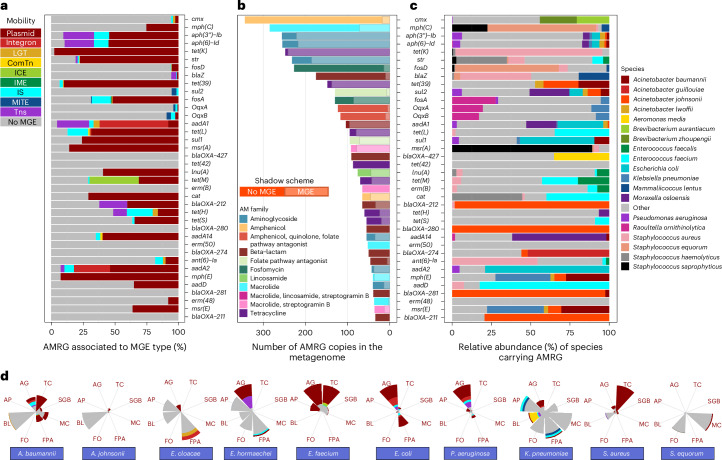
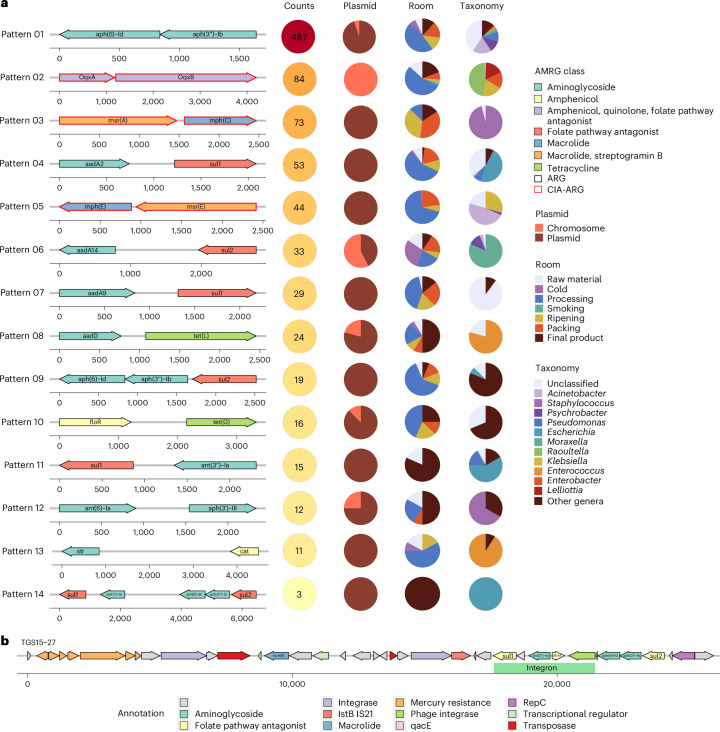
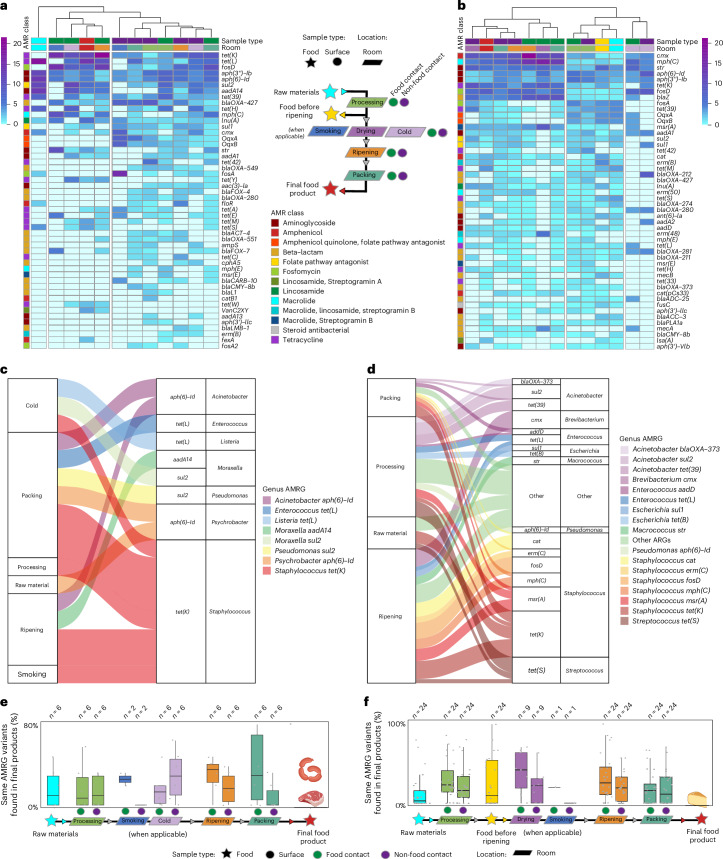
Food production systems may act as transmission routes for antimicrobial-resistant (AMR) bacteria and AMR genes (AMRGs) to humans. However, the food resistome remains poorly characterized. Here 1,780 raw-material (milk, brine, fresh meat and so on), end-product (cheese, fish, meat products and vegetables) and surface (processing, cooling, smoking, ripening and packing rooms) samples from 113 food processing facilities were subjected to whole-metagenome sequencing. Assembly-free analyses demonstrated that >70% of all known AMRGs, including many predicted to confer resistance to critically important antibiotics, circulate throughout food production chains, with those conferring resistance to tetracyclines, β-lactams, aminoglycosides and macrolides being the most abundant overall. An assembly-based analysis highlighted that bacteria from the ESKAPEE group, together with Staphylococcus equorum and Acinetobacter johnsonii, were the main AMRG carriers. Further evaluation demonstrated that ~40% of the AMRGs were associated with mobile genetic elements, mainly plasmids. These findings will help guide the appropriate use of biocides and other antimicrobials in food production settings when designing efficient antimicrobial stewardship policies.


Conflict of interest statement

Competing interests: The authors declare no competing interests.

Figures

Fig. 1
Fig. 1. Sampling strategy and raw output of the metagenomic analysis.
On the left side, countries of the visited industries are reported. For each industry type, the general process and sampling strategy is represented. The values indicate the total number of samples collected from raw materials, FCSs and NFCSs, and end food products. Also, for each industry type, pie and bar charts represent the proportion of contigs and the raw number of MAGs reconstructed from each sample type (that is, raw materials, final products, intermediate products and industry surfaces). Created with BioRender.com.
Fig. 2
Fig. 2. Quantitative overview of AMRG occurrence in foods and food processing environments.
a, Total AMRG counts, richness index and Simpson’s evenness index for AMRGs. n values were 294, 662, 489 and 335 for raw materials, final products, FCSs and NFCSs, respectively. The lower, middle and upper hinges in the box plots correspond to the first, second and third quartiles (the 25th, 50th or median and 75th percentiles), respectively. The upper whisker extends from the hinge to the largest value no further than 1.5× IQR from the hinge (where IQR is the interquartile range, or distance between the first and third quartiles). The lower whisker extends from the hinge to the smallest value at most 1.5× IQR of the hinge. Only significative P values (<0.05) are indicated according to the Wilcoxon test. b, Principal coordinates analysis for AMRG counts normalized to CPM. PC, principal coordinate. c, The relative abundance of AMRGs associated with the ten most abundant antibiotic families detected. For those genes conferring resistance to more than one antibiotic family, each antibiotic family was counted separately. AMRGs not included within the former ten most abundant families are represented as ‘Other antibiotic families’. d, Average abundance of the main AMRG on each industry type and sample type, indicated by column and point colours, respectively, except for the first column, which shows a global comparative analysis among industry types. The coloured box next to each AMRG name corresponds to the antibiotic family the gene confers resistance to (OqxB is associated with resistance against three antibiotic families), according to the legend in the bottom left part of the figure. AMRG groups obtained at 90% identity clustering by CD-HIT were used for the analysis shown in this figure. n values for bd are as follows: Meat – Raw material, 47; Final product, 38; Food contact, 67; Non food contact, 68. Cheese-dairy – Raw material, 229; Final product, 605; Food contact, 390; Non food contact, 240. Processsed fish – Raw material, 12; Final product, 13; Food contact, 20; Non food contact, 22. Vegetables – Raw material, 6; Final product, 6; Food contact, 12; Non food contact, 5.
Fig. 3
Fig. 3. The most relevant AMRG-carrier bacterial species in the different food production sectors, with indication of their resistome profile.
Heat map values were calculated by dividing the number of AMRG-encoding contigs (from each sample and industry type) assigned to the species indicated in the row by the total number of AMRG-encoding contigs (for the sample and industry type indicated in each column), to reduce overestimation in cheese and dairy industries due to unbalanced sampling. The left bar plot indicates the percentage of contigs assigned to each species on total number of AMRG-encoding contigs, while the right bar plot indicates the AMRG family distribution within each species, by percentage of total contigs. The most abundant species plus Enterobacter species, belonging to the ESKAPEE group, were plotted. Members of the ESKAPEE group are reported in red.
Fig. 4
Fig. 4. The most abundant AMRGs occurring in foods and food processing environments, with indication of their distribution across different taxa.
a, The percentage of the most abundant AMRGs occurring in the different MGE types. b, The number of contigs harbouring the most abundant AMRGs found in the metagenomes analysed. Bars are coloured according to the AM families each AMRG confers resistance to. Shadow bars for each AMRG represent the number of those AMRGs that were identified to occur in any MGE. c, Taxonomic assignment of contigs carrying the most abundant AMRGs, expressed as relative abundance (% of contigs carrying the AMRG indicated on the y axis). d, The association of AMRGs with MGEs by AMRG class in ESKAPEE key taxa and other main AMRGs carrying taxa: A. johnsonii and S. equorum. The size of the pie graph portions indicates the number of AMRGs found for each AMRG class, while the colour indicates the proportion of AMRGs found associated with MGEs for the corresponding species and AMRG class, according to the legend shown on the bar plot figure. AG, aminoglycosides; AP, amphenicols; BL, β-lactams; FPA, folate pathway antagonists; FO, fosfomycin; MC, macrolides; TC, tetracyclines; SGB, streptogramin B.
Fig. 5
Fig. 5. Co-occurrence of AMRGs within contigs.
a, Circles indicate how often (%) the contigs carrying each co-occurrence pattern were assigned as plasmidic (‘Plasmid’ column); and the room and taxonomic assignment for the contigs (‘Room’ and ‘Taxonomy’ columns, respectively). Only those co-occurrence patterns with more than ten counts are indicated. AMRGs conferring resistance to CIAs are marked with red arrow lines. b, A gene location map representation of the aph(3)-Ib-aph(6)-Id-sul2-ant(3″)-Ia-sul1 pattern, found three times in contigs with identity >99.9% on the plotted region.
Fig. 6
Fig. 6. Spread of AMRGs across meat and dairy production sites and to end products.
a,b, The relative abundance of the 50 most abundant AMRGs in meat (a) and dairy (b) facilities. The AM class of each gene is colour-indicated on the left part, while sample type and facility room are colour-indicated on top. The heat map colour scale indicates the number of AMRGs for each surface. The flow chart legend represents the flow that the food products (stars) follow from raw materials to final products along the food production system and the different rooms (trapezes). Swab samples were collected from surfaces (circles), coloured green if in contact with food products and purple if not. c,d, Resistome spread events between raw materials/processing environments and end products in meat (c) and dairy (d) producing facilities as revealed through the alignment analysis of AMRG-carrying contigs. The size of the boxes and lines are proportional to the number of spread events found. The right part of the figures corresponds to final product samples, where AMRG and genus are indicated. e,f, The percentage of the same AMRG variant found in the final products and other sample types from the same facility by using assembly-based approaches for meat (e) and dairy (f) producing facilities. Only those facilities where at least five AMRG variants were found in the final products were used for this analysis. The lower, middle and upper hinges in the box plots correspond to the first, second and third quartiles (the 25th, 50th or median and 75th percentiles), respectively. The upper whisker extends from the hinge to the largest value no further than 1.5× IQR from the hinge (where IQR is the interquartile range, or distance between the first and third quartiles). The lower whisker extends from the hinge to the smallest value at most 1.5× IQR of the hinge.
Extended Data Fig. 1
Extended Data Fig. 1. Main prevalent AMRG.
Mean values of prevalent AMRG ( > 0.1 CPM in >10% samples) found a) by sample type and industry type and b) percentage of prevalent AMRG found globally.
Extended Data Fig. 2
Extended Data Fig. 2. Quantitative overview of AMRG occurrence in foods and food processing environments.
a) Total AMRG counts, richness index and Simpson’s evenness index for AMRG. b) Principal Coordinates Analysis for AMRG counts normalised to CPM.
Extended Data Fig. 3
Extended Data Fig. 3. Quantitative overview of CIA AMRG occurrence in foods and food processing environments.
a) Global CIA AMRG abundance as CPM. b) Differences in CIA AMRG counts among sample types from the same industry type (top boxplot) and among industry types for the same sample type (bottom boxplot). c) Relative abundance of the 20 most abundant CIA AMRG.
Extended Data Fig. 4
Extended Data Fig. 4. Antibiotic families distribution along different rooms.
For both FC and NFC samples in each industry type studied.
Extended Data Fig. 5
Extended Data Fig. 5. Ratio of AMRG-carrying contigs.
Association with MGE in the different surfaces and rooms in meat (a) and dairy (b) industry.
Extended Data Fig. 6
Extended Data Fig. 6. Inter-genera AMRG sharing events detected.
a) Number of AMRG sharing events found and number of CDS within each AMRG sharing region. The point shape indicates AM class and the color indicates the genera-pair involved in the AMRG sharing events. b) AMRG sharing events (genera-pair) detected between chromosomes, chromosomes-plasmids and plasmids. c) AMRG sharing events abundance according to plasmidic (plasm), chromosomic (chrom) or hybrid (both) gene interchange. Small chord diagrams indicated AMRG shared events between sample type.
Extended Data Fig. 7
Extended Data Fig. 7. AMRG-carrier species distribution along meat production surfaces and relationship with their resistome profile.
Relative abundance of the 50 most abundant AMRG in meat facilities. The type of meat product elaborated in each facility is indicated as “Industry_type2”. The AM class of each gene is colour-indicated on the left part, while sample type and facility room are colour-indicated on top. The heatmap colour scale indicates the number of AMRG identified for each surface.
Extended Data Fig. 8
Extended Data Fig. 8. Analysis of AMRG-carrying MAGs.
a) Percentage of MAGs obtained per each species (y-axis) that carried the most abundant AMRG (x-axis). Only species with more than 10 AMRG-carrying MAGs were represented (K. pneumoniae, S. aureus and P. aeruginosa were also represented to cover the ESKAPEE group). The number written before each species name indicates the number of AMRG-carrying MAGs found for each species. b) Venn diagram comparing the number of AMRG-clusters found when assessing the resistome using the reads, the contigs or the MAGs datasets.

References

    1. Fisher, M. C., Hawkins, N. J., Sanglard, D. & Gurr, S. J. Worldwide emergence of resistance to antifungal drugs challenges human health and food security. Science360, 739–742 (2018). - PubMed
    1. Antimicrobial Resistance Collaborators. Global burden of bacterial antimicrobial resistance in 2019: a systematic analysis. Lancet399, 629–655 (2022). - PMC - PubMed
    1. GBD 2019 Diseases and Injuries Collaborators. Global burden of 369 diseases and injuries in 204 countries and territories, 1990-2019: a systematic analysis for the Global Burden of Disease Study 2019. Lancet396, 1204–1222 (2020). - PMC - PubMed
    1. O’Neill, J. I. M. Antimicrobial resistance: tackling a crisis for the health and wealth of nations. (The Review on Antimicrobial Resistance, 2014); https://amr-review.org/sites/default/files/AMR%20Review%20Paper%20-%20Ta...
    1. WHO: Antimicrobial Resistance, 2023 (WHO, 2024).

Substances

LinkOut - more resources