. 2025 Jul 30;16(1):6996.
doi: 10.1038/s41467-025-62148-4.

DHRS13 suppresses differentiation and mitophagy in glioma via retinoic acid and mitochondrial reactive oxygen species

Affiliations

DHRS13 suppresses differentiation and mitophagy in glioma via retinoic acid and mitochondrial reactive oxygen species

Sunyoung Seo et al. Nat Commun. .

Abstract

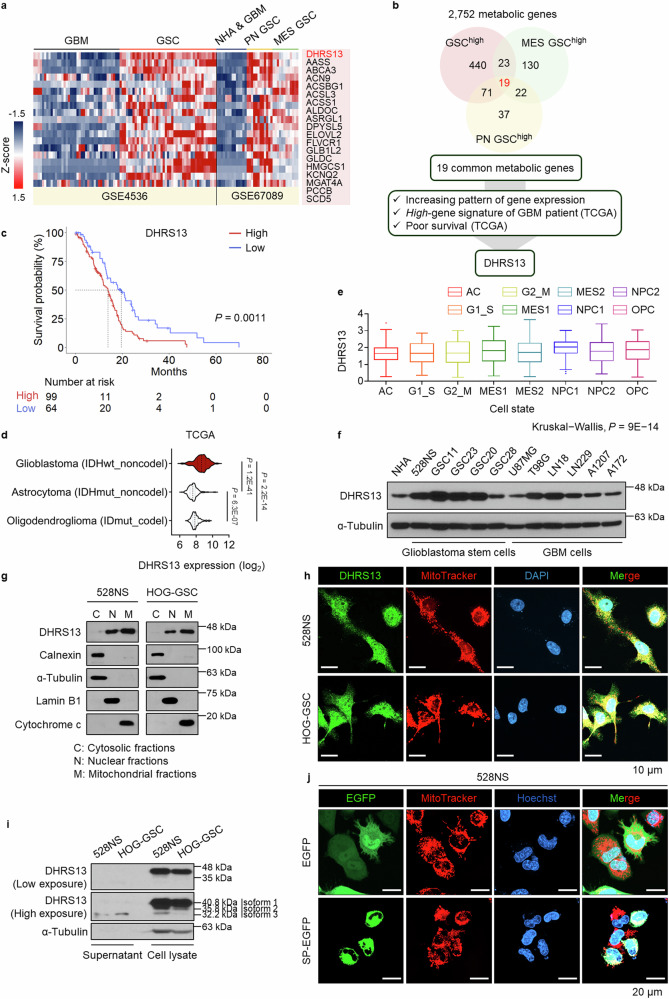
To elucidate the complex interplay of undifferentiated cancer cells in malignancy, we focus on the crucial mechanisms that maintain the undifferentiated state of cancer stem-like cells, which drive tumor growth and therapy resistance. Here, we identify a protein called dehydrogenase/reductase 13 (DHRS13) that is abundant in undifferentiated glioblastoma cells. DHRS13 is primarily located in the mitochondria and functions as a retinaldehyde reductase, converting all-trans-retinaldehyde to all-trans-retinol with high affinity for NADPH. Mechanistically, DHRS13 prevents glioma stem-like cells from differentiating by blocking retinoic acid signaling, thereby maintaining their undifferentiated state. Remarkably, the depletion of DHRS13 results in mitochondrial reactive oxygen species-driven mitophagy and cell death. Consequently, loss of DHRS13 leads to a significant decrease in tumor initiation and progression. These findings hold promise for the development of strategies that target undifferentiated cancer cells, potentially leading to improved treatment outcomes.


Conflict of interest statement

Competing interests: The authors declare no competing interests.

Figures

Fig. 1
Fig. 1. DHRS13 is a protein essential for maintaining stem cell-like properties in GBM.
a DEG analysis was performed on the public microarray dataset GSE4536 and RNA-seq dataset GSE67089. Heatmap showing genes with significantly higher expression levels in GSCs than in GBM or NHA. The 19 genes in the pink box are unique metabolic genes with high expression (fold change >2) in GSCs. b Venn diagrams highlighting 19 genes with high expression in undefined-, PN-, and MES-GSCs. DHRS13 was selected based on the gene expression patterns and patient survival in TCGA database. c Kaplan–Meier survival analysis of the TCGA GBM (IDHwt) cohort stratified into DHRS13-high and DHRS13-low groups based on gene expression levels (n = 99 for high, n = 64 for low). Survival differences were evaluated using the Log-rank test (two-sided). d DHRS13 mRNA expression in adult glioma subtypes. TCGA-GBMLGG cohorts of glioblastoma (n = 163), astrocytoma (n = 258), and oligodendroglioma (n = 169). Kruskal–Wallis and Dunn’s tests. e DHRS13 expression in GBM cell states (n = 172,471). Boxes represent the interquartile range (25th–75th percentile), with the middle line indicating the median. Whiskers extend to 1.5 times the interquartile range (IQR) from the lower and upper quartiles. Outliers beyond this range are shown as individual points. The plot excludes zero values. f Western blotting showed the relative expression of DHRS13 in the indicated cell lines. n = 2 biological replicates. DHRS13 and α-Tubulin were detected on the same membrane from the same experiment. g Western blotting revealed the expression pattern of DHRS13 according to its subcellular localization in 528NS and HOG-GSCs. Calnexin and α-tubulin are cytoplasmic (C) markers. Lamin B1 is a nuclear (N) marker, and cytochrome c is a mitochondrial (M) marker. n = 2 biological replicates. DHRS13 and α-Tubulin were detected on the same membrane. Calnexin, Lamin B1, and cytochrome c were processed on separate gels in parallel from the same experiment. α-Tubulin was used as a sample processing control. h Immunofluorescence image of DHRS13 subcellular localization. MitoTracker (red) and DAPI (blue) indicate mitochondria and nuclei, respectively; scale bars, 10 μm. n = 2 biological replicates. i Western blotting revealed DHRS13 isoforms in the supernatants and total cell lysates from 528NS and HOG-GSC cells. n = 2 biological replicates. j Representative image of immunofluorescence analysis in 528NS cells displaying cellular localization of EGFP with or without signal peptide domain of DHRS13 (green), MitoTracker (red) and Hoechst (blue); scale bars, 20 μm. n = 2 biological replicates. Statistical significance was determined using two-sided unpaired t-tests. Significance levels are indicated in the figure (*p < 0.05; **p < 0.01; ***p < 0.001), and exact p-values and source data of each figure are provided as a Source Data file.
Fig. 2
Fig. 2. DHRS13 functions as a retinaldehyde reductase in GSCs.
a Specific enzymatic activity of DHRS13 and RDH13 in the presence of NADPH or NADH as a cofactor. Activity was measured as nmol retinol formed per minute per mg protein (n = 3 independent enzyme reactions per condition). Data are presented as mean ± SEM. Exact p-values: DHRS13 (NADPH) vs. DHRS13 (NADH), p = 1.25 × 10⁻⁶; RDH13 (NADPH) vs. RDH13 (NADH), p = 6.30 × 10⁻⁷. b The NADPH/NADP+ ratio measured at the indicated time points following the transduction of shNT or shDHRS13 in 528NS and HOG-GSC cells. Data are mean ± SEM (n = 2 biological replicates). c Kinetic parameters of DHRS13 and RDH13 for the reduction of all-trans-retinaldehyde and diagrams representing enzymes that participate in the conversion of all-trans-retinol, all-trans-retinaldehyde, and all-trans-retinoic acid. d Relative enzymatic activity of DHRS13 at various temperatures. n = 3 biological replicates. Statistical analysis was performed using one-way ANOVA (independent groups, equal variance assumed). Exact p-value: 1.92 × 10⁻¹⁶. e The percentage of the GFP+ population measured using FACS analysis on day 4 after shRNA transduction of 528NS and HOG-GSC cells. RA is used as a positive control. Data represent mean ± SEM, n = 3 biological replicates. f The percentage of the GFP+ population measured using FACS analysis in shRNA-transduced 528NS and HOG-GSC cells with or without AGN193109 (20 nM for 528NS; 40 nM for HOG-GSC). RA is used as a positive control. Data represent mean ± SEM, n = 3 biological replicates. g The heatmap illustrating the relative mRNA expression levels of RAR-target genes (RARB, CYP26A1, CYP26B1, CYP1A1, CYP2C8) in shRNA-transduced 528NS and HOG-GSC cells as measured by qRT-PCR. Data represent mean ± SEM, n = 3 biological replicates. Statistical significance was determined using two-sided unpaired t-tests. Significance levels are indicated in the figure (*p < 0.05; **p < 0.01; ***p < 0.001), and exact p-values and source data of each figure are provided as a Source Data file.
Fig. 3
Fig. 3. Knockdown of DHRS13 makes GSCs more susceptible to differentiation.
a–c In vitro limiting dilution assay was performed until day 6 after shRNA transduction. 528NS (a), HOG-GSC (b), and GSC11 (c) cells were used. Cells were plated at decreasing densities (indicated as cells per well) and analyzed for the absence of sphere formation (negative wells). Log-transformed fraction of negative wells was used to calculate stem cell frequency via ELDA software. Data are plotted as Log(fraction of negative wells) versus cells per well. n = 3 biological replicates for each cell line. d The heatmap showed the relative mRNA expression of differentiated cell markers (S100β, GFAP, TUJ1) and stem-like cell markers (Nestin, CD44) in shRNA-transduced 528NS and HOG-GSC cells through qRT-PCR. Data represent mean ± SEM, n = 3 biological replicates. e, f FACS analysis shows the percentage of S100β+ or GFAP+ cell population in 528NS (e) and HOG-GSC (f) cells, respectively. Transduction of shRNA and treatment of all-trans-retinaldehyde (+: 1 μM, ++: 2 – 3 μM) or AGN193109 (20 nM in 528NS; 40 nM in HOG-GSC) were performed 72 h prior to FACS analysis. Data represent mean ± SEM, n = 3 biological replicates. Statistical significance was determined using two-sided unpaired t-tests. Significance levels are indicated in the figure (*p < 0.05; **p < 0.01; ***p < 0.001), and exact p-values and source data of each figure are provided as a Source Data file.
Fig. 4
Fig. 4. Loss of DHRS13 induces cell death in GSCs but not in NHA.
a Colony formation assays using 528NS and HOG-GSC cells. Crystal violet staining was performed two weeks after shRNA transduction, and the number of colonies was calculated. Data are presented as mean ± SEM (n = 3 biological replicates for each cell line). Exact p-values: for 528NS, p = 6.77 × 10⁻¹⁰ (shNT vs. shDHRS13 #1), p = 7.03 × 10⁻¹⁰ (shNT vs. shDHRS13 #2); for HOG-GSC, p = 9.61 × 10⁻¹¹ (shNT vs. shDHRS13 #1), p = 1.24 × 10⁻¹⁰ (shNT vs. shDHRS13 #2). b MTS assay was performed 24 h after shRNA transduction in 528NS, HOG-GSC, and GSC11 cells. MTS absorbance values were normalized to Day 0 in each group. Data are shown as mean ± SEM (n = 3 biological replicates for each cell line). c Annexin V/PI staining was performed 3 and 6 days after shRNA transduction in 528NS, HOG-GSCs, and GSC11 cells. BCNU (80 μM) is treated as a positive control. Data are presented as mean ± SEM (n = 3 biological replicates for each cell line). Exact p-value: *** p = 9.77 × 10⁻⁷ (528NS), 1.56 × 10⁻¹⁵ (HOG-GSC), 9.55 × 10⁻¹¹ (GSC11), comparing Day 3 and Day 6 time points of shDHRS13 #1 and shDHRS13 #2. d–f qRT-PCR and western blotting (d) of the NHA cell line were performed 48 h after shRNA transduction. DHRS13 and α-Tubulin were detected on the same membrane from the same experiment. The MTS assay (e) was performed 24 h after shRNA transduction. Annexin V/PI staining (f) was measured on day 3 and day 6 after shRNA transduction. Data are presented as mean ± SEM (n = 3 biological replicates). Exact p-value: p = 0.99367, comparing Day 3 and Day 6 time points of shDHRS13 #1 and shDHRS13 #2. Statistical significance was determined using two-sided unpaired t-tests. Significance levels are indicated in the figure (*p < 0.05; **p < 0.01; ***p < 0.001), and exact p-values and source data of each figure are provided as a Source Data file.
Fig. 5
Fig. 5. DHRS13 deficiency leads to excessive mitochondrial ROS production.
a, b Hallmark of reactive oxygen species pathway gene set performed with GSEA between shNT and shDHRS13-transduced 528NS (a) and GSC11 (b) RNA-seq data. n = 3 biological replicates. c, d MitoSOX intensity (arbitrary units, a.u.) measured in shRNA-transduced 528NS and HOG-GSC cells treated with (d) or without (c) all-trans-retinaldehyde. All-trans-retinaldehyde (1 μM) was treated for 72 h. Data represent mean ± SEM. n = 4 biological replicates for each experiment. Exact p-values: 528NS (48 h), p = 0.00140 (shDHRS13 #1), p = 0.00145 (shDHRS13 #2); 528NS (72 h), p = 1.32 × 10⁻⁵ (shDHRS13 #1), p = 1.99×10⁻⁷ (shDHRS13 #2); HOG-GSC (48 h), p = 1.13×10⁻⁶ (shDHRS13 #1), p = 2.24×10⁻⁷ (shDHRS13 #2); HOG-GSC (72 h), p = 1.34×10⁻⁵ (shDHRS13 #1), p = 3.28×10⁻⁵ (shDHRS13 #2). e Annexin V/PI staining conducted in shRNA- or non-transduced 528NS and HOG-GSC cells with or without all-trans-retinaldehyde (+: 1 μM in 528NS and 3 μM in HOG-GSC; ++: 3 μM in 528NS and 5 μM in HOG-GSC). BCNU (80 μM) is treated as a positive control. Annexin V/PI staining was performed six days after the indicated shRNA transduction or reagent treatment. Data are presented as mean ± SEM (n = 3 biological replicates). Exact p-values: ***p = 1.15×10⁻⁹ (528NS), ***p = 8.23×10⁻⁶ (HOG-GSC), comparing shDHRS13-transduced cells with or without retinal treatment. f MitoSOX intensity (arbitrary units, a.u.) measured in shRNA-transduced 528NS and HOG-GSC cells treated with or without Disulfiram. Disulfiram (3 μM) was treated for 72 h. Data represent mean ± SEM (n = 4 biological replicates). Exact p-values: ***p = 1.07 × 10⁻⁸ (528NS), ***p = 1.31×10⁻⁷ (HOG-GSC). Statistical significance was determined using two-sided unpaired t-tests. Significance levels are indicated in the figure (*p < 0.05; **p < 0.01; ***p < 0.001), and exact p-values and source data of each figure are provided as a Source Data file.
Fig. 6
Fig. 6. Depletion of DHRS13 leads to mitochondrial ROS-driven mitophagy.
a MitoSOX intensity (arbitrary units, a.u.) measured in shRNA-transduced 528NS and HOG-GSC with or without MitoTEMPOL (200 nM). Data represent mean ± SEM (n = 4 biological replicates). b Annexin V/PI staining conducted in shRNA- or non-transduced 528NS and HOG-GSCs with or without MitoTEMPOL (200 nM). BCNU (80 μM) is treated as a positive control. Annexin V/PI staining was performed six days after the indicated shRNA transduction or reagent treatment. Data are presented as mean ± SEM (n = 3 biological replicates). Exact p-values were calculated by comparing MitoTEMPOL-treated and untreated conditions for shDHRS13 #1 and #2 combined: 528NS, p = 2.53 × 10⁻⁹; HOG-GSC, p = 1.03 × 10⁻¹⁴. c TEM images showing damaged mitochondria and autophagosomes in 528NS and HOG-GSCs after four days of shRNA induction; black arrow, normal mitochondria; red arrow, damaged mitochondria; blue arrow, autophagosomes; scale bar, 100 nm. n = 2 biological replicates. d Western blot analysis revealed the expression of mitochondrial complex proteins in 528NS and HOG-GSCs. The shRNA-transduced cells were treated with MitoTEMPOL (100 nM) for 4 days. The cells were harvested six days after transduction. n = 2 biological replicates. The samples derive from the same experiment, but mitochondrial complex proteins and α-Tubulin were processed on separate gels in parallel. α-Tubulin was used as a sample processing control. e Relative mitochondrial DNA content of 528NS and HOG-GSCs. shRNA-transduced cells were treated with MitoTEMPOL (528NS, 100 nM; HOG-GSC, 50 nM) for 4 days. The cells were harvested on day 6 after shRNA transduction. Data are presented as mean ± SEM (n = 3 biological replicates). Statistical significance was determined using two-sided unpaired t-tests. Significance levels are indicated in the figure (*p < 0.05; **p < 0.01; ***p < 0.001), and exact p-values and source data of each figure are provided as a Source Data file.
Fig. 7
Fig. 7. DHRS13 knockdown regulates mitophagy-related pathways in GSCs.
a, b Western blotting revealed the ERK signaling pathway and autophagy- and mitophagy-related proteins in 528NS and HOG-GSCs treated with or without MitoTEMPOL (100 nM). The cells were harvested on day 6 after shRNA transduction. n = 2 biological replicates. The samples derive from the same experiment, but different gels for DHRS13, p62, and cleaved caspase-3; another for PINK1, p-ERK, total ERK, and LC3B; and another for Caspase-3 and α-Tubulin were processed in parallel. α-Tubulin was used as a sample processing control. c The mitophagy index of shRNA- or non-transduced 528NS and HOG-GSCs treated for 3 days with or without MitoTEMPOL (100 nM) on day 4 after shRNA transduction. FCCP and RA were used as positive controls. Data are presented as mean ± SEM (n = 3 biological replicates). Exact p-values for the comparisons between MitoTEMPOL-treated and untreated DHRS13 knockdown groups are as follows: 528NS, p = 4.89788×10⁻¹²; HOG-GSC, p = 8.15305×10⁻¹³. d, e Representative image of immunofluorescence analysis in 528NS (d) and HOG-GSCs (e) stained with PINK1 (green), MitoTracker (red), and DAPI (blue); scale bars, 10 μm. n = 2 biological replicates. Statistical significance was determined using two-sided unpaired t-tests. Significance levels are indicated in the figure (*p < 0.05; **p < 0.01; ***p < 0.001), and exact p-values and source data of each figure are provided as a Source Data file.
Fig. 8
Fig. 8. DHRS13 depletion leads to significantly prolonged survival in the GSC xenograft model.
a, b Western blot analysis revealed the expression of DHRS13 proteins in 528NS (a) and HOG-GSCs (b). The Doxycycline-inducible shRNA-expressing cells were treated with or without Doxycycline (1 μg/mL) for 4 days. n = 2 biological replicates for each experiment. DHRS13 and α-Tubulin were detected on the same membrane from the same experiment. c, d MTS assay was performed on day 2 and day 4 after the Doxycycline (1 μg/mL) induction in Doxycycline-inducible shRNA-expressing 528NS (c) and HOG-GSCs (d). Data are presented as mean ± SEM (n = 3 biological replicates for each cell line). Exact p-values comparing Dox⁻ versus Dox⁺ conditions for each timepoint are as follows: Day 0, p = 8.02052241 × 10⁻¹; Day 2, p = 2.77788 × 10⁻⁴; Day 4, p = 7.143 × 10⁻⁶. e, f Balb/c-nude mice were intracranially transplanted with the Doxycycline-inducible shRNA-expressing 528NS (1 × 10⁴ cells/mouse; n = 7 mice per group) and HOG-GSC (1 × 10³ cells/mouse; n = 9 mice per group), respectively. Doxycycline administration via drinking water was conducted several days after orthotopic transplantation (8 days for 528NS, and 4 days for HOG-GSC). Kaplan–Meier survival plots and representative images from immunofluorescence analysis of cryosectioned brain tissues stained with DAPI (blue) (n = 3 biological replicates); scale bars, 2000 μm. g Scheme of retinoid metabolism-linked DHRS13 in GSC. DHRS13 maintains retinoic acid (RA) levels by converting retinaldehyde to retinol. Downregulation of DHRS13 induced RA accumulation and cell differentiation in the early phase, ultimately leading to mitochondrial ROS-driven mitophagy and cell death in GSC. Statistical significance was determined using two-sided unpaired t-tests. Significance levels are indicated in the figure (*p < 0.05; **p < 0.01; ***p < 0.001), and exact p-values and source data of each figure are provided as a Source Data file.

References

    1. Garber, K. Cancer stem cell pipeline flounders. Nat. Rev. Drug Discov.17, 771–773 (2018). - PubMed
    1. Guo, W., Lasky, J. L. III & Wu, H. Cancer stem cells. Pediatr. Res59, 59r–64r (2006). - PubMed
    1. Yang, L. Targeting cancer stem cell pathways for cancer therapy. Signal Transduct. Target Ther.5, 8 (2020). - PMC - PubMed
    1. Jin, X., Jin, X. & Kim, H. Cancer stem cells and differentiation therapy. Tumour Biol.39, 1010428317729933 (2017). - PubMed
    1. Bjerkvig, R., Tysnes, B. B., Aboody, K. S., Najbauer, J. & Terzis, A. J. Opinion: the origin of the cancer stem cell: current controversies and new insights. Nat. Rev. Cancer5, 899–904 (2005). - PubMed

MeSH terms

LinkOut - more resources