

Impact of seat position on survival outcomes and anatomically specific severe injury patterns in four-wheeled motor vehicle accidents: a retrospective cohort study at a community emergency department in Japan
- PMID: 40739191
- PMCID: PMC12312418
- DOI: 10.1186/s12873-025-01302-z
Impact of seat position on survival outcomes and anatomically specific severe injury patterns in four-wheeled motor vehicle accidents: a retrospective cohort study at a community emergency department in Japan
Abstract
Background: Road traffic accidents are a major healthcare concern worldwide. To improve outcomes for patients injured in motor vehicle crashes, it is crucial to understand the factors associated with mortality and anatomically specific injury severity. Seat position is one of the possible determinants of road traffic injury fatality; however, evidence regarding which seat positions are linked to impaired survival outcomes and anatomically severe injuries remains scarce.
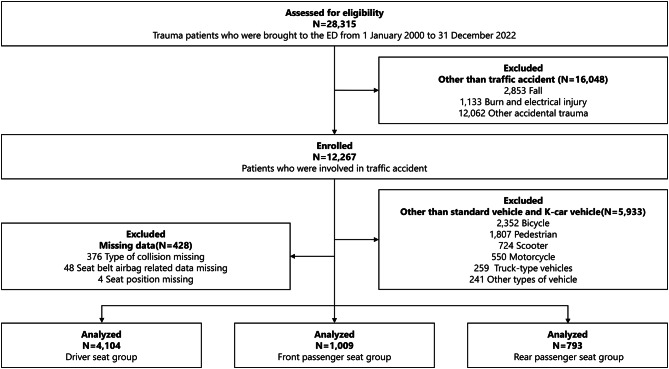
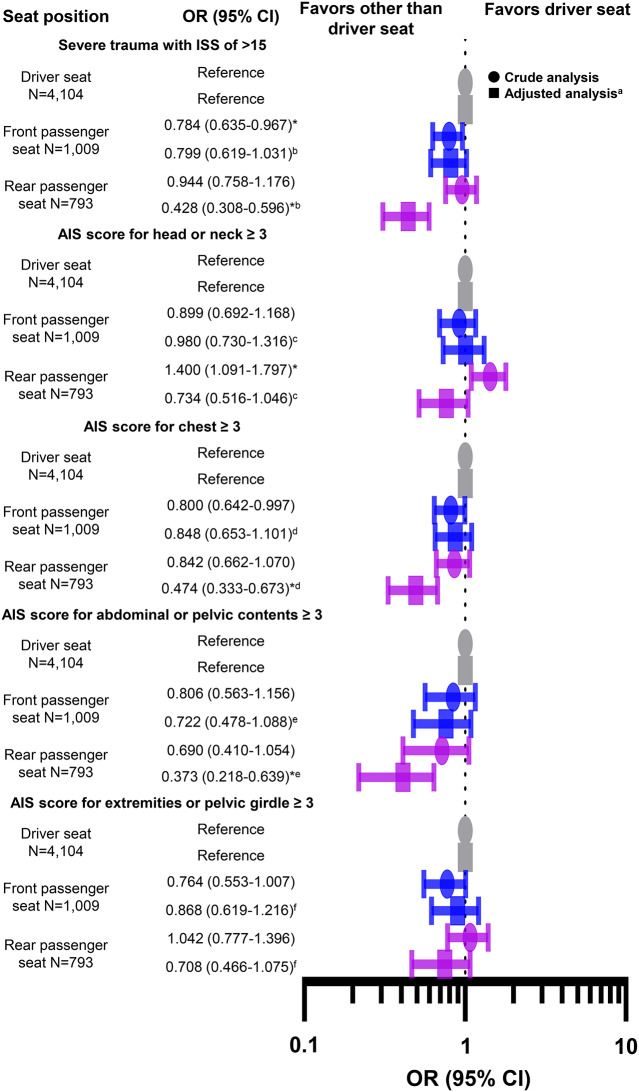
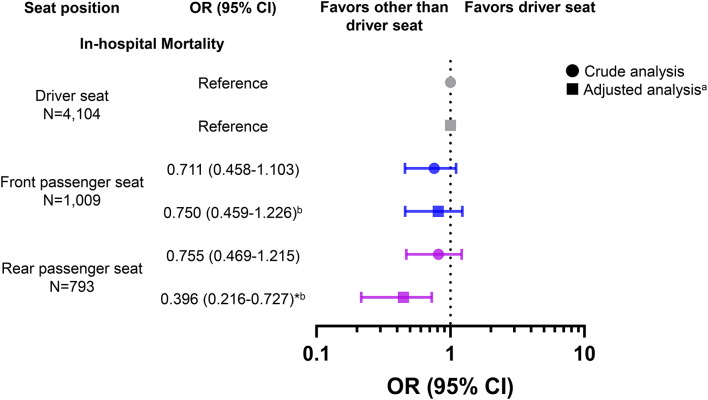
Methods: We conducted a retrospective cohort study of patients injured in four-wheeled vehicle accidents between 2000 and 2022 and admitted to a community teaching hospital in Japan. Seat position was classified as driver seat, front passenger seat, or rear passenger seat. The primary endpoint was in-hospital mortality. Other outcomes included severe trauma, defined as an Injury Severity Score (ISS) of > 15, and anatomically specific severe injuries of the head and neck, chest, abdomen, pelvis, and extremities, defined as an Abbreviated Injury Scale score of ≥ 3.
Results: Among 5,906 eligible patients, 4,104 (69.5%) were driver seat occupants, 1,009 (17.1%) were front passenger seat occupants, and 793 (13.4%) were rear passenger seat occupants. After adjusting for potential confounders such as age, sex, admission year, season, presentation time, presentation day, prehospital length of stay, vehicle configuration, collision type, seatbelt use, airbag deployment, and involvement in high-energy trauma using logistic regression analysis, rear passenger seat occupants had a lower risk of hospital mortality (adjusted odds ratio [AOR], 0.396; 95% confidence interval [CI], 0.216-0.727) and a lower risk of severe trauma with an ISS of > 15 (AOR, 0.428; 95% CI, 0.308-0.596) than driver seat occupants. Additionally, rear seat occupants were less likely to sustain serious injuries to the chest (AOR, 0.474; 95% CI, 0.333-0.673) and abdominal or pelvic contents (AOR, 0.373; 95% CI, 0.218-0.639) than driver seat occupants.
Conclusion: Our results suggest that driver seat occupants require special attention because of their higher risk of adverse outcomes and anatomically severe injuries. These findings will be useful for vehicle occupants, emergency medical professionals, and automobile manufacturers.
Clinical trial number: Not applicable.
Keywords: Driver seat; Front passenger seat; Rear passenger seat; Severe trauma; Traffic accidents.
© 2025. The Author(s).
Conflict of interest statement
Declarations. Ethics approval and consent to participate: The study protocol was approved by the ethics committee at Ohta Nishinouchi Hospital on 19 July 2024 (approval no. 9_2024). The study was performed in accordance with the ethical standards as laid down in the 1964 Declaration of Helsinki and its later amendments or comparable ethical standards. The committee waived the requirement for patient consent because of the observational nature of this study, which involved no interventions and was focused on outcomes from routine trauma practice. The opt-out information was provided on the hospital’s website ( https://www.ohta-hp.or.jp/nishi/about/attempt/clinical_research ). Consent for publication: Not applicable. Competing interests: The authors declare no competing interests.
Figures
Similar articles
-
History of airbag safety benefits and risks.Traffic Inj Prev. 2024;25(3):268-287. doi: 10.1080/15389588.2024.2315889. Epub 2024 Feb 26. Traffic Inj Prev. 2024. PMID: 38408114 Review.
-
Effects of seatback angle, seat rotation, and impact speed on injury risk of occupants in highly automated vehicles in frontal crashes.Traffic Inj Prev. 2024;25(sup1):S137-S144. doi: 10.1080/15389588.2024.2411028. Epub 2024 Nov 1. Traffic Inj Prev. 2024. PMID: 39485708
-
Frontal NCAP crash tests with rear-seat occupant.Traffic Inj Prev. 2024;25(3):288-296. doi: 10.1080/15389588.2024.2315892. Epub 2024 Feb 26. Traffic Inj Prev. 2024. PMID: 38408120 Review.
-
Education, incentive, and engineering-based interventions to promote the use of seat belts.Cochrane Database Syst Rev. 2024 Jan 10;1(1):CD011218. doi: 10.1002/14651858.CD011218.pub2. Cochrane Database Syst Rev. 2024. PMID: 38197528 Free PMC article.
-
Comparison of survival outcomes and anatomically specific severe injuries following traffic accidents among occupants of standard and K-car vehicles: A retrospective cohort study at a teaching hospital in Japan.PLoS One. 2025 Feb 5;20(2):e0318748. doi: 10.1371/journal.pone.0318748. eCollection 2025. PLoS One. 2025. PMID: 39908305 Free PMC article.
References
-
- World Health Organization. Global status report on road safety 2023. 2023. Available from: https://www.who.int/publications/i/item/9789240086517
-
- Chen S, Kuhn M, Prettner K, Bloom DE. The global macroeconomic burden of road injuries: estimates and projections for 166 countries. Lancet Planet Health. 2019;3:e390–8. - PubMed
-
- Berg MD, Cook L, Corneli HM, Vernon DD, Dean JM. Effect of seating position and restraint use on injuries to children in motor vehicle crashes. Pediatrics. 2000;105(4 Pt 1):831–5. - PubMed
MeSH terms
LinkOut - more resources
Full Text Sources
Medical
