. 2025 Jul 30;30(1):689.
doi: 10.1186/s40001-025-02953-1.

Identification of differentially expressed immune-related genes in patients with systemic lupus erythematosus and the development of a hub gene-based diagnostic model

Affiliations

Identification of differentially expressed immune-related genes in patients with systemic lupus erythematosus and the development of a hub gene-based diagnostic model

Quangang Fang et al. Eur J Med Res. .

Abstract

Background: Systemic lupus erythematosus (SLE) is an incurable autoimmune disease that affects body tissues, but it can be managed with medication. Although therapeutic strategies for SLE have advanced, the underlying molecular mechanisms driving disease pathogenesis remain incompletely understood.

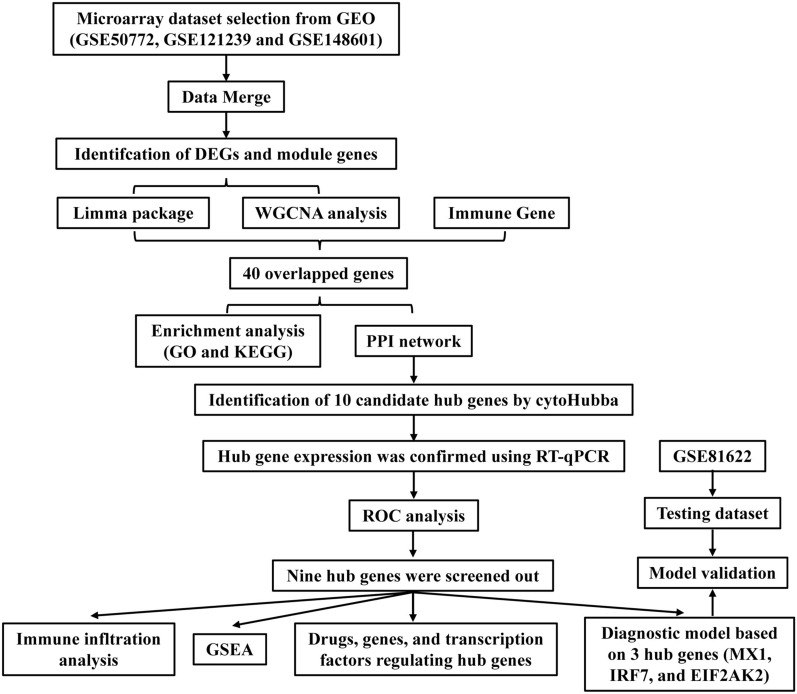
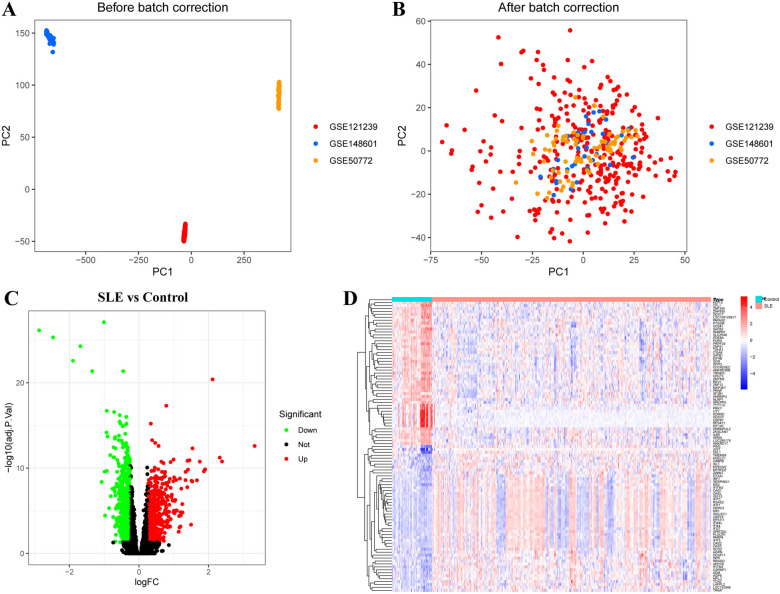
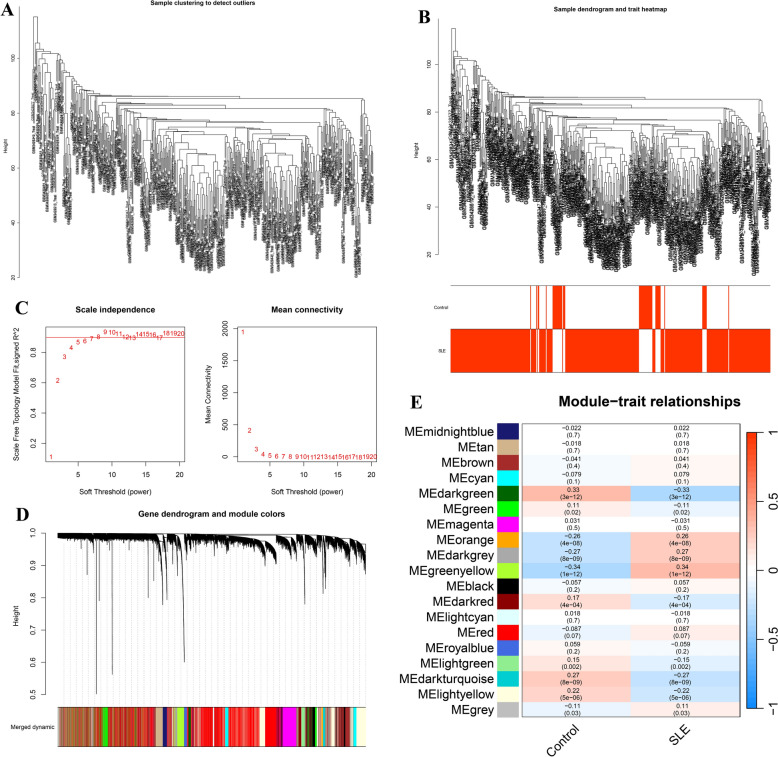
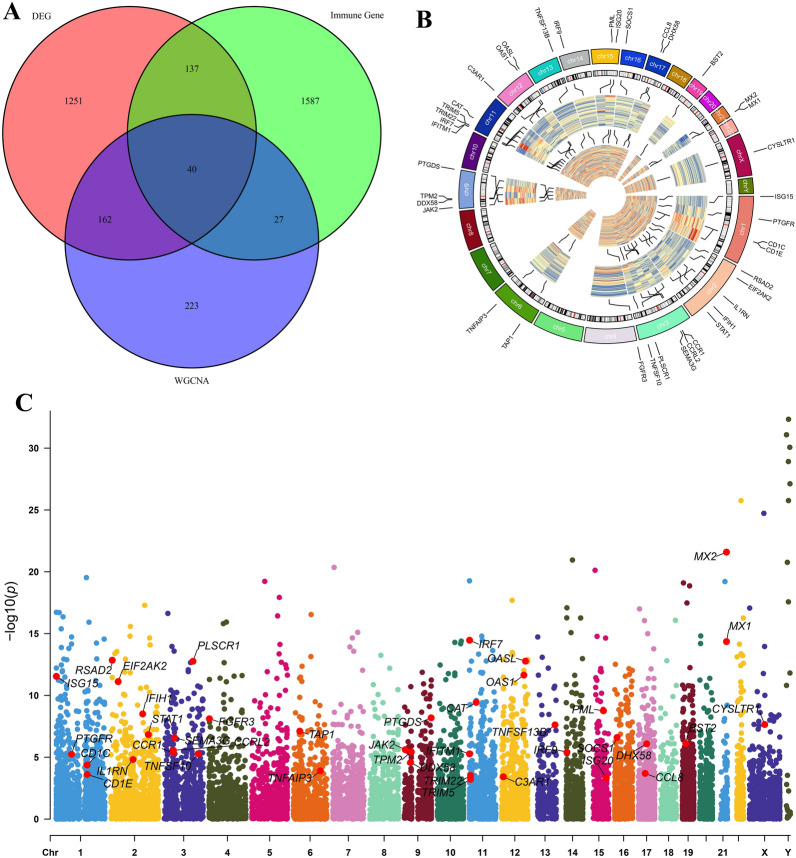
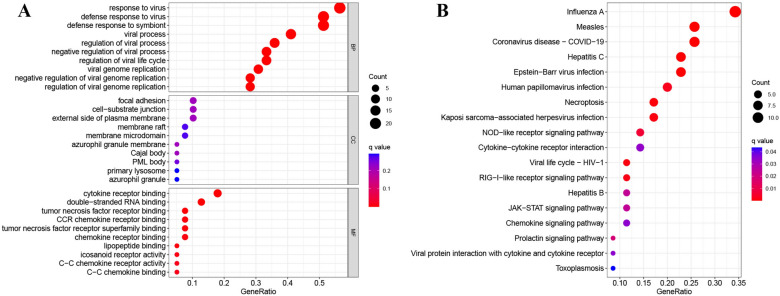
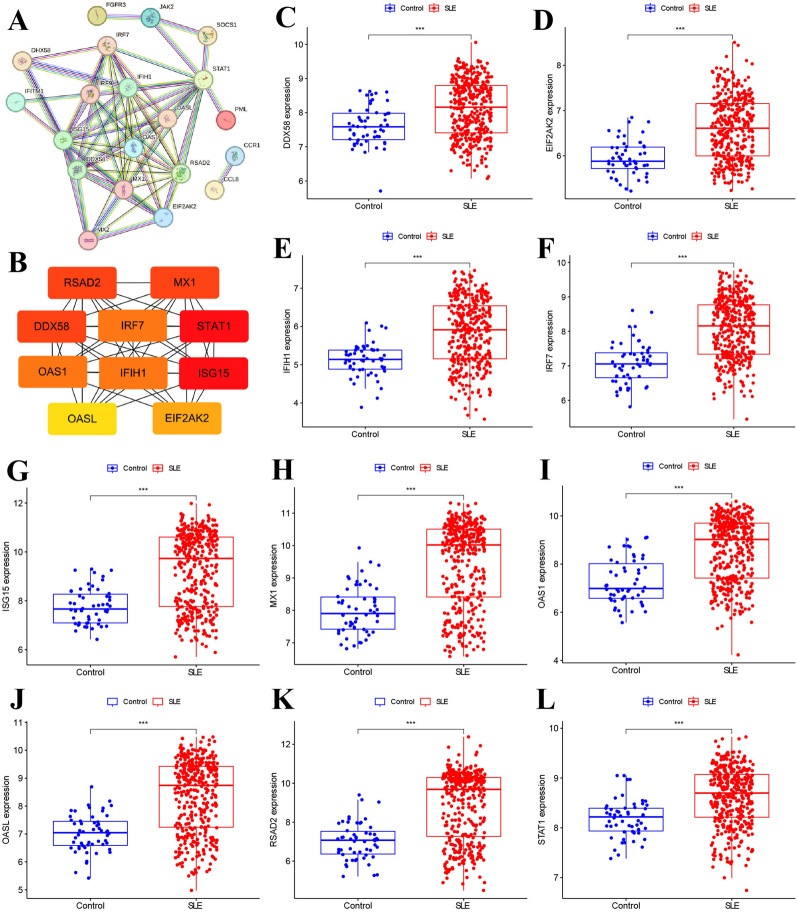
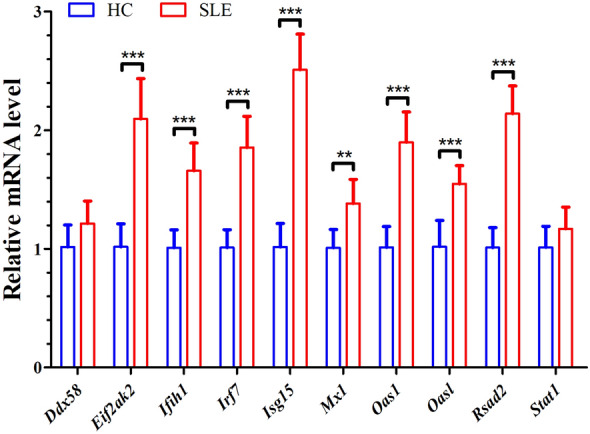
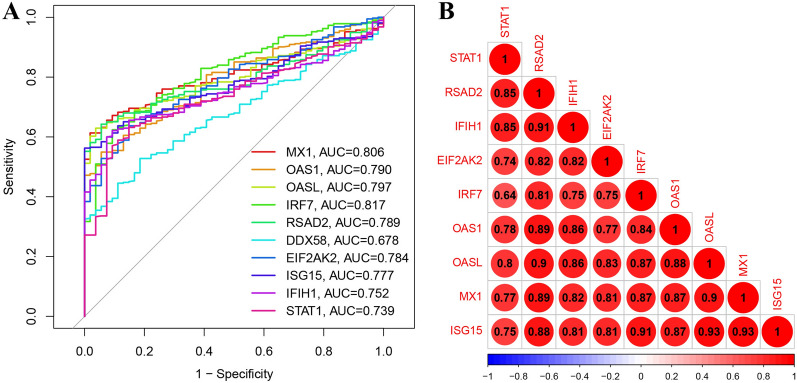
Methods: This study analyzed gene expression data from three GEO microarray datasets to explore immunity-related differentially expressed genes (DEGs) in SLE. Using WGCNA, we identified gene modules and integrated them with immune-related DEGs to find candidate hub genes, which were validated using RT-qPCR. We constructed a PPI network and performed gene enrichment analysis to identify nine hub genes through ROC curve analysis. We confirmed the link between these hub genes and immune cells, conducted GSEA, and predicted drugs, miRNAs, and transcription factors (TFs) targeting these genes. LASSO and ROC analyses validated a model using immunity-related DEGs.

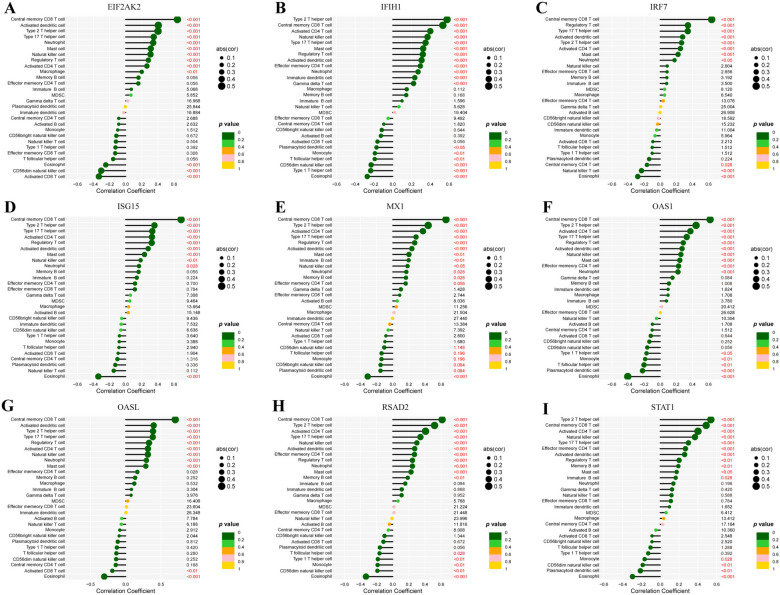
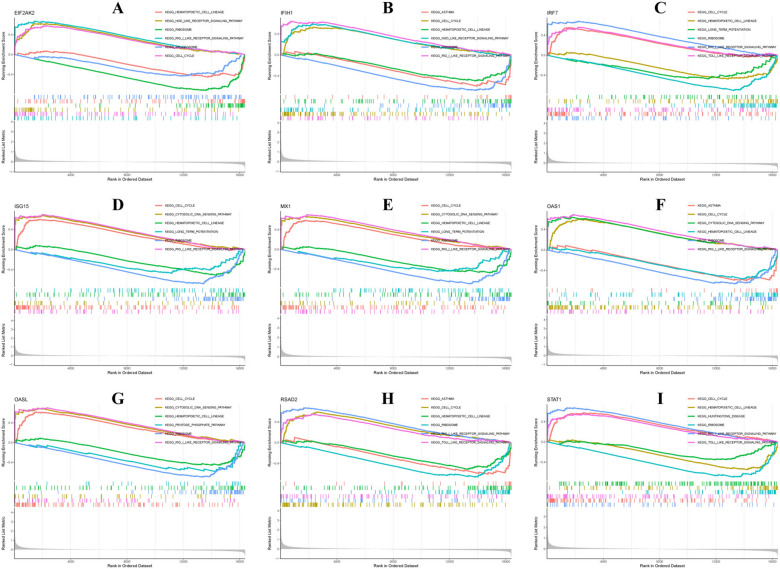
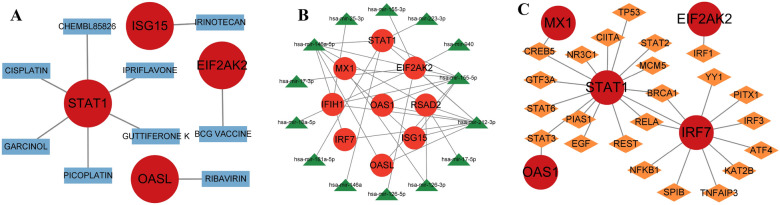
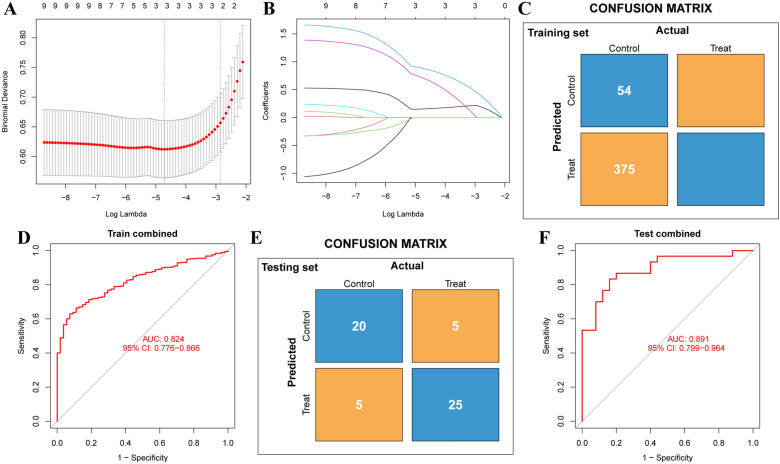
Results: The forty immune-related DEGs were identified from a total of 1590 DEGs, 452 WGCN module genes, and 1791 immune genes. Nine hub genes (MX1, OAS1, OASL, IRF7, RSAD2, EIF2AK2, ISG15, IFIH1, and STAT1) were highlighted using Cytoscape and ROC analysis, with an AUC greater than 0.7. RT-qPCR confirmed significant overexpression of all hub genes except STAT1 in SLE. ssGSEA and GSEA linked these genes to immune cell infiltration and pathways, including "cell cycle" and "RIG-I-like receptor signaling." A diagnostic model with three immune-related hub genes (MX1, IRF7, and EIF2AK2) demonstrated high accuracy (AUC > 0.8) in distinguishing SLE from healthy controls. Additionally, 9 target drugs, 14 target miRNAs, and 23 TFs were identified for these hub genes.

Conclusions: MX1, IRF7, and EIF2AK2 may serve as candidate biomarkers for SLE and warrant further investigation.

Keywords: Bioinformatics analysis; Diagnostic model; EIF2AK2; IRF7; Immune cell infiltration; MX1; Systemic lupus erythematosus.


Conflict of interest statement

Declarations. Ethics approval and consent to participate: GEO is a public database containing ethically approved patient data. Users can freely download this data for research and publication purposes. This study, which utilizes open-source data from GEO, has no ethical concerns or conflicts of interest. Human protocols adhered to the Ethical Guidelines of the Declaration of Helsinki. The Jiangxi Provincial People's Hospital Ethics Committee (JXPPH-202310017) approved this study. All participants provided written informed consent, and all procedures followed relevant guidelines and regulations. Consent for publication: All authors know and approve the publication of this manuscript. Competing interests: The authors declare no competing interests.

Figures

Fig. 1
Fig. 1
The study flow chart
Fig. 2
Fig. 2
Data preprocessing and identification of differentially expressed genes (DEGs). A, B Principal component analyses (PCA) were performed to conduct batch correction on GSE50772, GSE121239, and GSE148601. A Before batch correction and B after batch correction. C, D Volcano plot (C) and heatmap (D, top 50) of DEGs in peripheral blood mononuclear cells (PBMCs) from patients with SLE and healthy controls. Statistical analyses were conducted using R software (v4.2.3)
Fig. 3
Fig. 3
Identification of module genes from DEGs. A Outlier sample detection. The gene sets from all samples are contained in the dendrogram. B Sample dendrogram and trait heatmap. C Soft threshold screening. D WGCNA modules. E Module-disease correlations. Statistical analyses were conducted using R software (v4.2.3)
Fig. 4
Fig. 4
Screening of immune-related DEGs. A Venn diagram of immune-related DEGs screening. B The expression patterns of these genes in the three merged GEO datasets (GSE50772, GSE121239, and GSE148601) are represented in the inner circular heatmaps. Dark red indicates gene upregulation, while dark blue indicates downregulation. The outer circle of the heatmap corresponds to the control group, and the inner circle corresponds to the disease group. The chromosomes are represented by the outer circle, and lines from each gene highlight their specific locations on the chromosomes. C Manhattan plot of immune-related DEGs
Fig. 5
Fig. 5
GO (A) and KEGG pathway (B) enrichment analysis of immune-related DEGs. Statistical analyses were conducted using R software (v4.2.3)
Fig. 6
Fig. 6
Identifying candidate hub genes using co-expression analysis. A A protein–protein interaction (PPI) network was built from immune-related DEGs. B Hub subnetworks were formed through Cytoscape. C-L The expression levels of candidate hub genes in PBMCs from SLE patients (n = 375) and healthy controls (n = 54) were analyzed in the training dataset. Data are presented as median ± standard error (SE). Statistical comparisons between the two groups were conducted using the Wilcoxon test. SLE: systemic lupus erythematosus. ***, p < 0.001
Fig. 7
Fig. 7
The expression levels of 10 candidate hub genes in PBMCs from patients with SLE (n = 9) were validated using RT-qPCR, compared to healthy controls (n = 7). Data are presented as the mean ± standard deviation (SD). Statistical comparisons between the two groups were conducted using the Student's t-test. HC: healthy controls; SLE: systemic lupus erythematosus. **, p < 0.01; ***, p < 0.001
Fig. 8
Fig. 8
Examine the performance of the ten candidate hub genes and investigate the co-expression relationships among them. A ROC curve analysis was used to assess the diagnostic performance of ten candidate hub genes. The top nine genes, based on their AUC (area under the curve) scores for distinguishing SLE (n = 375) from healthy controls (n = 54), were selected for further investigation. B The relationships between the expression levels of various hub gene pairs were analyzed using the Spearman correlation method
Fig. 9
Fig. 9
The association between immune cell infiltration scores and hub gene expression levels was analyzed using the Spearman correlation method. A EIF2AK2, B IFIH1, C IRF7, D ISG15, E MX1, F OAS1, G OASL, H RSAD2, I STAT1
Fig. 10
Fig. 10
Gene set enrichment analysis for A EIF2AK2, B IFIH1, C IRF7, D ISG15, E MX1, F OAS1, G OASL, H RSAD2, and I STAT1. A gene set was deemed to be enriched when the normalized p-value was less than 0.05 and the false discovery rate (FDR) score was also below 0.05
Fig. 11
Fig. 11
Drugs, genes, and transcription factors that influence hub genes. A Small-molecule drugs that affect the expression or function of hub genes. B MicroRNAs that target hub genes. C Transcription factors that regulate the expression of hub genes. The circles denote hub genes, while the rectangles signify small-molecule drugs. The triangles represent microRNAs, and the rhombuses symbolize transcription factors
Fig. 12
Fig. 12
Diagnostic model based on 3 hub genes. A The LASSO regression analysis involved ten-fold cross-validation, with error bars representing the standard error (SE). Dotted vertical lines denote the optimal lambda value, which indicates the best level of regularization for the model. B Profiles of 3 hub genes' LASSO coefficients. C The confusion matrix for the training set includes data from 375 SLE patients and 54 healthy controls. D ROC curve for training set. E Confusion matrix for the validation set (GSE81622 dataset), which includes 30 SLE patients and 25 healthy controls. F ROC curve for validation set. Statistical analyses were conducted using R software (v4.2.3)

Similar articles

References

    1. Siegel CH, Sammaritano LR. Systemic lupus erythematosus: A review. JAMA. 2024;331(17):1480–91. - PubMed
    1. Hoi A, Igel T, Mok CC, Arnaud L. Systemic lupus erythematosus. Lancet (London, England). 2024;403(10441):2326–38. - PubMed
    1. Karp DR. Complement and systemic lupus erythematosus. Curr Opin Rheumatol. 2005;17(5):538–42. - PubMed
    1. Živković V, Mitić B, Stamenković B, Stojanović S, Dinić BR, Stojanović M, et al. Analysis on the risk factors for organ damage in patients with systemic lupus erythematosus: a cross-sectional single-center experience. Sao Paulo Med J. 2019;137(2):155–61. - PMC - PubMed
    1. Kaul A, Gordon C, Crow MK, Touma Z, Urowitz MB, van Vollenhoven R, et al. Systemic lupus erythematosus. Nat Rev Dis Primers. 2016;2:16039. - PubMed

MeSH terms