. 2025 Aug;27(8):1256-1271.
doi: 10.1038/s41556-025-01711-z. Epub 2025 Jul 30.

PEX39 facilitates the peroxisomal import of PTS2-containing proteins

Affiliations

PEX39 facilitates the peroxisomal import of PTS2-containing proteins

Walter W Chen et al. Nat Cell Biol. 2025 Aug.

Abstract

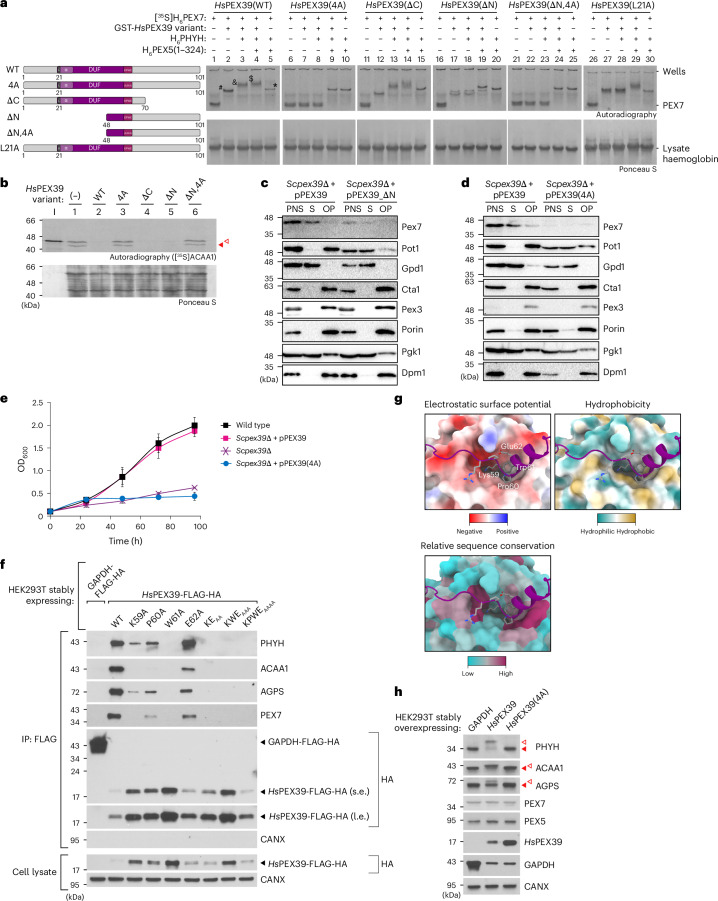
Peroxisomes are metabolic organelles essential for human health. Defects in peroxisomal biogenesis proteins (also known as peroxins (PEXs)) cause devastating disease. PEX7 binds proteins containing a type 2 peroxisomal targeting signal (PTS2) to enable their import from the cytosol into peroxisomes, although many aspects of this process remain enigmatic. Utilizing in vitro assays, yeast and human cells, we show that PEX39, a previously uncharacterized protein, is a cytosolic peroxin that facilitates the import of PTS2-containing proteins by binding PEX7 and stabilizing its interaction with cargo proteins containing a PTS2. PEX39 and PEX13, a peroxisomal membrane translocon protein, both possess an (R/K)PWE motif necessary for PEX7 binding. Handover of PEX7 from PEX39 to PEX13 via these motifs provides a new paradigm for peroxisomal protein import and biogenesis. Collectively, this work reveals how PEX39 and (R/K)PWE motifs facilitate the import of PTS2-containing proteins and advances our understanding of peroxisomal disease.


Conflict of interest statement

Competing interests: R.J.D. is a founder and advisor at Atavistik Bio and serves on the scientific advisory boards of Agios Pharmaceuticals and Vida Ventures. The other authors declare no competing interests.

Figures

Fig. 1
Fig. 1. PEX39 interacts with members of the import pathway of PTS2-containing proteins.
a, Depiction of protein–protein interactions for Yjr012c and C6ORF226, per BioGRID and BioPlex,, respectively. The circles represent proteins and the arrows point from purified proteins to interactors. For Yjr012c, only interactions found in at least two independent studies were considered. For C6ORF226, the combined interactome from HCT116 and HEK293T cells is shown. b, Domain analysis and alignment of Yjr012c and C6ORF226. Probabilities of disorder were determined using IUPred2A. c, Quantitative proteomic analysis of Pex18 complexes that were affinity purified from soluble fractions of wild-type and Pex18-TPA-expressing yeast grown in oleic acid medium (n = 3). The enrichment of proteins in Pex18 complexes and Q values were determined using the rank-sum method. Peroxins and PTS2-containing proteins are labelled and/or marked by black dots. The dashed lines indicate a Q-value threshold of 0.05 and a fold-enrichment of 64. d, Immunoblots of anti-FLAG immunoprecipitates prepared from HCT116 cells expressing the indicated proteins. HA denotes the detection of HA-tagged proteins. The dashed lines indicate where different lanes of the same membrane were brought together. For the PHYH, ACAA1 and AGPS blots, solid and open red arrowheads indicate mature and precursor forms of these proteins, respectively. An asterisk indicates a non-specific band. The control protein β-actin (ACTB) should be absent from immunoprecipitates. e, Immunoblots of anti-FLAG immunoprecipitates prepared from HEK293T cells expressing the indicated proteins. The control protein calnexin (CANX) should be absent from immunoprecipitates. The annotation of the immunoblots is otherwise the same as for d. f, Immunoblots of anti-FLAG immunoprecipitates prepared from HEK293T cells expressing FLAG-HA-eGFP or HsPEX39-FLAG-HA. An asterisk indicates a non-specific band. g, Native PAGE and autoradiography of [35S]H6PEX7 pre-incubated with the recombinant proteins GST-HsPEX39, H6PHYH and H6PEX5(1–324), as indicated. The in-gel positions of PEX7 alone, lysate haemoglobin and the complexes PEX7–HsPEX39 (hashtag), PEX7–PHYH–HsPEX39 (ampersand) and PEX7–PEX5–PHYH–HsPEX39 (dollar sign) are indicated. The autoradiograph and corresponding Ponceau S-stained membrane are shown. α, α-helix; IP, immunoprecipitate. Source data
Fig. 2
Fig. 2. Loss of PEX39 impairs the import of PTS2-containing proteins.
a, Growth of the indicated yeast strains in oleic acid medium. pPEX39 is a plasmid containing Scpex39 under the control of its endogenous promoter. The data represent means ± s.d. (n = 4). b, Immunoblots of cellular fractions from wild-type and Scpex39Δ yeast. A post-nuclear supernatant (PNS) was prepared from cells grown in oleic acid medium and further separated into a cytosolic supernatant (S) and organellar pellet (OP). c, Quantification of the subcellular distribution of proteins using the band intensities of the immunoblots shown in b and Extended Data Fig. 3c. For each protein, the summed intensities of the cytosolic supernatant and organelles were set to 100%. The data represent means ± s.e.m. (n = 2 for Pex3 and n = 3 for the rest). Statistical significance was determined by unpaired, two-tailed t-test. d, Fluorescence microscopy of Pot1-mNeonGreen in control, Scpex39Δ and pex7Δ yeast grown in oleic acid medium. Peroxisomes were visualized with Pex3-mScarlet. Scale bar, 1 μm. e, Quantitative proteomic analysis of wild-type and Scpex39Δ yeast (n = 4). Proteins quantified in at least three biological replicates are shown, except for ScPex39 (quantified in one replicate). PTS2-containing proteins and additional peroxisomal proteins are indicated by yellow and black circles, respectively. Multiple-testing-adjusted P values were determined using the limma approach (moderated two-tailed t-test) and Benjamini–Hochberg method. The dashed line indicates an adjusted P value threshold of 0.05. f, Immunoblot analysis of control and HsPEX39-KO CAKI-2 and NCI-H1792 cells. Precursor ACAA1 and AGPS were undetectable. CANX and citrate synthase (CS) were used as loading controls. g, Quantification of mature and precursor PHYH in HsPEX39-KO cells using the band intensities of immunoblots prepared per f. Mature/precursor ratios were divided by the mean value of the corresponding control. The data represent means ± s.e.m. (n = 3). Statistical significance was determined by unpaired, two-tailed t-test. h, Immunoblot analysis of PEX7-KD (PEX7-knockdown) and HsPEX39-KO CAKI-2 cells. The dashed lines indicate where different lanes of the same membrane were brought together. An asterisk indicates a non-specific band. In f and h, the solid and open red arrowheads indicate mature and precursor forms, respectively. ER, endoplasmic reticulum; l.e., long exposure; s.e., short exposure. Source data
Fig. 3
Fig. 3. Overexpression of PEX39 impairs the import of PTS2-containing proteins.
a, Immunoblot analysis of HEK293T cells overexpressing GAPDH (negative control) or HsPEX39. The solid and open red arrowheads indicate mature and precursor forms, respectively. b, Quantification of changes in mature and precursor forms using the band intensities of immunoblots prepared per a. The precursor and mature form intensities were normalized by the intensities of the corresponding loading controls. The data represent means ± s.e.m. (n = 3). Statistical significance was determined by unpaired, two-tailed t-test. c,d, [35S]ACAA1 in vitro import assays in the presence of increasing concentrations of H6HsPEX39 (c) or in the presence or absence of H6HsPEX39 and FLAG-PEX7 (d). After incubation, the reactions were treated with trypsin and organelles were isolated by centrifugation and analysed by SDS-PAGE and autoradiography. Protection from trypsin and maturation of ACAA1 reflect import into peroxisomes. Precursor and mature ACAA1 are indicated by open and solid red arrowheads, respectively. I represents input (5% of the reticulocyte lysate containing the [35S]ACAA1 used in each reaction). e, Growth of the indicated yeast strains in oleic acid medium. pPEX39_OE represents a plasmid containing Scpex39 under the control of a TEF2 promoter for overexpression. The data for the wild type, Scpex39Δ and Scpex39Δ + pPEX39 are the same as those shown in Fig. 2a. The data represent means ± s.d. (n = 4). f, Immunoblots of cellular fractions from yeast overexpressing ScPex39. The experiment was performed as described for Fig. 2b using Scpex39Δ cells transformed with a plasmid containing Scpex39 under the control of the endogenous promoter (pPEX39) or an overexpressing TEF2 promoter (pPEX39_OE). Source data
Fig. 4
Fig. 4. PEX39 stabilizes the interaction between PEX7 and PTS2-containing proteins.
a, Native PAGE and autoradiography of [35S]H6PEX7 pre-incubated with the recombinant proteins H6PEX5(1–324), H6PHYH and GST-HsPEX39, as indicated. In-gel positions of PEX7 alone and the complexes PEX7–PEX5–PHYH (asterisk), PEX7–HsPEX39 (hashtag), PEX7–PHYH–HsPEX39 (ampersand) and PEX7–PEX5–PHYH–HsPEX39 (dollar sign) are indicated. b, Assessments of Kd,app for HsPEX39–PEX7 interaction in different complexes in vitro. [35S]H6PEX7 was incubated with increasing amounts of recombinant HsPEX39 in the absence or presence of H6PHYH and then analysed by native PAGE and autoradiography. The recombinant HsPEX39 used here lacks a GST tag. In-gel positions of PEX7 alone and the complexes PEX7–HsPEX39 (hashtag) and PEX7–PHYH–HsPEX39 (ampersand) are indicated. c, AlphaFold predictions of human and yeast PEX39-containing complexes. The top and bottom faces of PEX7 are oriented as indicated. Top: in PEX7/PEX39 dimers, the (R/K)PWE motifs of PEX39 are marked with a dashed circle. Structure predictions were performed with full-length PEX39. However, for visualization, PEX39 has been C-terminally shortened, as indicated by a double line and the last amino acid. Bottom: AlphaFold confidence scores (that is, strengths of the structural predictions) for the corresponding models above, shown according to the predicted local distance difference test (pLDDT). d, Comparison of the AlphaFold models with the crystal structure of the yeast Pex7–Pex21–Pot1 complex. The crystal structure (Protein Data Bank (PDB) ID 3W15; ref. ) of Pex7 in complex with Pex21190–288 and Pot11–15 (PTS2) fused to a maltose-binding protein tag (MBP tag) was superimposed with the trimeric and tetrameric AlphaFold (AF) models shown in c using ChimeraX. Single entities of the used structural models are coloured as indicated. For simplification, PEX39 from tetrameric complexes and PTS2 helices and PEX7 orthologues of the AlphaFold models are not displayed. Insets: magnifications of the structurally conserved hydrophobic residues HsPEX39 Leu21 with ScPex21 Phe236 and HsPEX5 Phe215 (left) and ScPex39 Tyr9 with ScPex21 Phe236 and ScPex18 Phe232 (right). Source data
Fig. 5
Fig. 5. The N-terminal region and (R/K)PWE motif are essential for PEX39 function.
a, Native PAGE and autoradiography of [35S]H6PEX7 pre-incubated with the indicated recombinant HsPEX39 variants (depicted on the left). In-gel positions of PEX7 alone and the complexes PEX7–HsPEX39 (hashtag), PEX7–HsPEX39–PHYH (ampersand), PEX7–PEX5–PHYH–HsPEX39 (dollar sign) and PEX7–PEX5–PHYH (asterisk) are indicated for full-length wild-type (WT) HsPEX39. Double bands of HsPEX39(ΔN) complexes are due to co-migration with haemoglobin from the reticulocyte lysate. b, [35S]ACAA1 in vitro import assays in the absence (−) or presence of the indicated recombinant HsPEX39 variants (depicted in a). The other details of the experiment were as described for Fig 3c. c, Immunoblots of cellular fractions from yeast expressing N-terminally truncated ScPex39. The experiment was performed as described for Fig. 2b using Scpex39Δ cells transformed with plasmids encoding wild-type ScPex39 (pPEX39) or a variant comprising residues 40–132 (pPEX39_ΔN). d, Immunoblots of cellular fractions from yeast expressing a variant of ScPex39. The experiment was performed as described for Fig. 2b using Scpex39Δ cells transformed with plasmids encoding wild-type ScPex39 (pPEX39) or an ScPex39 RPWE-to-AAAA variant (pPEX39(4A)). In c and d, all of the plasmids utilized the endogenous Scpex39 promoter. e, Growth of the indicated yeast strains in oleic acid medium. The data for the wild type, Scpex39Δ and Scpex39Δ + pPEX39 are the same as those shown in Fig. 2a. The data represent means ± s.d. (n = 4). f, Immunoblots of anti-FLAG immunoprecipitates prepared from HEK293T cells expressing GAPDH-FLAG-HA (negative control) or the indicated HsPEX39 variants (single or multiple alanine replacements of the indicated residues). g, Close-up views of the interactions between the HsPEX39 KPWE motif (labelled) and PEX7. Shown are the different surface properties and relative sequence conservation of the HsPEX39 binding region of human PEX7. The images are based on the same structural model shown in Fig. 4c (H. sapiens). h, Immunoblot analysis of HEK293T cells overexpressing GAPDH, HsPEX39 or HsPEX39(4A). The solid and open red arrowheads indicate mature and precursor forms, respectively. DUF, DUF5572. Source data
Fig. 6
Fig. 6. The N-terminal KPWE motif of PEX13 is necessary for proper PEX13 function.
a, Schematic of the (R/K)PWE motifs in PEX39 and the N terminus of PEX13. b, Native PAGE and autoradiography of [35S]H6PEX7 pre-incubated with the indicated recombinant proteins. NtPEX13 represents HsPEX13 residues 1–36 fused to Sumo1 with a hexa-histidine tag. NtPEX13(4A) represents NtPEX13 with a KPWE-to-AAAA substitution. The in-gel positions of PEX7 alone and the complexes PEX7–PEX5–PHYH (asterisk) and PEX7–HsPEX13 (at symbol) are indicated. c, Native PAGE and Coomassie staining of different recombinant proteins alone or mixed together, as indicated. The in-gel positions of the complexes PEX7–PEX5–PHYH (asterisk) and PEX7–PEX5–PHYH–PEX13 (pound sign) are indicated. d, Assessment of Kd,app for the interaction between the N terminus of HsPEX13 and PEX7. [35S]H6PEX7 was incubated with increasing amounts of NtPEX13 and analysed by native PAGE and autoradiography. The in-gel positions of PEX7 alone and the complex PEX7–HsPEX13 (at symbol) are indicated. e, AlphaFold prediction of interactions between the PEX13 N terminus and PEX7. The top and bottom faces of PEX7 are oriented as indicated. Structural modelling was performed using PEX13 residues 1–55, but for visualization PEX13 was C-terminally shortened at residue 36. f, Growth of the indicated yeast strains in oleic acid medium. Scpex13Δ cells were transformed with plasmids encoding wild-type ScPex13 (pPEX13) or an ScPex13 variant with a KPWE-to-AAAA substitution (pPEX13(4A)), each under the control of the endogenous promoter. The data represent means ± s.d. (n = 4, except for the wild type at 96 h (n = 3)). g, Immunoblots of cellular fractions from the indicated yeast strains (as described in f). The experiment was performed as described for Fig. 2b. h, Immunoblot analysis of three independent HsPEX13-KO HeLa clones transfected with plasmid cDNA for wild-type HsPEX13 or an HsPEX13 mutant encoding the KPWE-to-AAAA substitution (HsPEX13(4A)). Solid and open red arrowheads indicate mature and precursor forms, respectively. TUBA4A (α-tubulin) was used as a loading control. i, Quantification of mature and precursor forms using the immunoblot band intensities from experiments as described in h. Mature/precursor ratios were calculated for the indicated proteins and then divided by the mean value of the HsPEX13-KO + HsPEX13 replicates. The data represent means ± s.e.m. (n = 6). Multiplicity-adjusted P values were calculated using ordinary, one-way analysis of variance with Tukey’s multiple comparisons test. Source data
Fig. 7
Fig. 7. A conserved glutamate residue in PEX7 is necessary for interaction with PEX39 and PEX13.
a, Structural modelling predicts that (R/K)PWE motifs of PEX39 and the N terminus of PEX13 bind to the same site of PEX7. Shown are superimpositions of the predicted models shown in Figs. 4c and 6e. The residues of the PEX39 and PEX13 (R/K)PWE motifs are shown. b, AlphaFold modelling of the predicted salt bridge between human PEX7 Glu77 and HsPEX39 Lys59. The distance (yellow dotted line) between the terminal oxygens of PEX7 Glu77 and the zeta nitrogen of HsPEX39 Lys59 measures 3.9 Å (top) and 4.1 Å (bottom). c, Schematic demonstrating that Glu77 of human PEX7 is conserved in yeast Pex7. Sequence alignment of PEX7 orthologues was performed using Clustal Omega (version 1.2.4) (see Extended Data Fig. 7e for complete alignment). Relevant glutamate residues are highlighted in green. d, Native PAGE and autoradiography of wild-type [35S]H6PEX7 or [35S]H6PEX7(E77A) pre-incubated with the indicated recombinant proteins. The in-gel positions of the PEX7 variants alone and the complexes PEX7–HsPEX39 (hashtag) and PEX7–PEX5–PHYH (asterisk) are indicated. The dashed lines indicate where different lanes of the same membrane were brought together. e, Native PAGE and autoradiography of wild-type [35S]H6PEX7 or [35S]H6PEX7(E77A) pre-incubated with NtPEX13 or NtPEX13(4A). The in-gel positions of the PEX7 variants alone and the PEX7–HsPEX13 complex (at symbol) are indicated. f, Immunoblots of anti-FLAG immunoprecipitates prepared from HEK293T cells expressing the indicated proteins. Source data
Fig. 8
Fig. 8. Dissociation of PEX39 from PEX7 allows the N terminus of PEX13 to bind.
a, Immunoblots of anti-FLAG immunoprecipitates prepared from HEK293T cells expressing the indicated proteins. The dashed lines indicate where different lanes of the same membrane were brought together. b, Native PAGE and autoradiography of a mixture of [35S]H6PEX7 and NtPEX13 that was subsequently incubated (chased) with a fivefold molar excess of GST-HsPEX39 or GST-Ub (negative control). Aliquots before (t0) and during incubations were collected at the indicated time points. [35S]H6PEX7 in a mixture with GST-HsPEX39 was also analysed. The in-gel positions of PEX7 alone, the complexes PEX7–HsPEX39 (hashtag) and PEX7–NtPEX13 (at symbol) and other proteins are indicated. c, Native PAGE and autoradiography of mixtures of [35S]H6PEX7 and GST-HsPEX39 or mixtures of [35S]H6PEX7, H6PHYH and GST-HsPEX39 that were subsequently incubated (chased) with a 100-fold molar excess of either GST-HsPEX39(ΔN) or GST-Ub (negative control). Aliquots before (t0) and during incubations were collected at the indicated time points. The in-gel positions of PEX7 alone and the complexes PEX7–HsPEX39 (hashtag), PEX7–HsPEX39(ΔN) (closed square bracket) and PEX7–PHYH–HsPEX39 (ampersand) are indicated. Double bands of PEX7–HsPEX39(ΔN) complexes were caused by co-migration with haemoglobin from the reticulocyte lysate. d, Model depicting how PEX39 facilitates the import of PTS2-containing proteins and the consequences of perturbations explored in this study. Proteins and their respective motifs or domains are indicated. Co-receptors (for example, PEX5, Pex18 and Pex21) are shown in blue. Protein cargo containing a PTS2 (denoted by an α) are also shown. The dashed lines highlight known protein–protein interactions,–. 13, PEX13; 14/17, PEX14/PEX17; CTD, C-terminal domain; NTD, N-terminal domain; PEX7-BD, PEX7-binding domain; WxxxF, di-aromatic motif. Source data
Extended Data Fig. 1
Extended Data Fig. 1. PEX39 and [R/K]PWE motif conservation, Pex18 enrichment, Pex18 interactome analysis, and PEX39 subcellular localization.
a, Examination of [R/K]PWE motifs and Yjr012c/C6ORF226 orthologs across eukaryotes. Left: Sequence logos for the regions containing [R/K]PWE motifs in the indicated proteins. At each position, stack height indicates sequence conservation, while symbol height indicates the relative frequency of each residue. Right: Domain architecture of the indicated proteins across major eukaryotic taxa. Colored boxes indicate regions typical for PEX14 (green), Yjr012c/C6ORF226 orthologs (purple), and PEX13 (orange). Red boxes denote [R/K]PWE motifs. Grey boxes indicate additional domains only found in some taxa. In most fungi, invertebrates and fishes, Yjr012c/C6ORF226 orthologs possess an additional region of unknown function (“X”) that is distinct from the DUF5572. SAR, Stramenopiles-Alveolata-Rhizaria. b, Immunoblots of eluates (E) and bead (B) samples of the soluble fractions of wild-type (WT) yeast cells and cells expressing Pex18-TPA. TEV-protease was added to beads to cleave the TPA tag and elute Pex18 complexes. c, STRING network analysis representing network of proteins (nodes) from Pex18-TPA complexes dataset with a Q-value of < 0.05. The network is based on data received from curated databases and experiments and was filtered by a “minimum required interaction score” of 0.4 (medium confidence). Interactions without experimental/biochemical data or those that are based on putative homologues in other organisms were not considered. d, Gene Ontology (GO) enrichment analysis of proteins with a Q-value of < 0.05 for the domains “biological process” (BP) and “cellular component” (CC). Listed are selected terms with an adjusted P value (Padj) of < 0.05. GO term enrichment analysis was performed using the g:Profiler application (https://biit.cs.ut.ee/gprofiler/gost) and adjusted P values determined via the Benjamini-Hochberg method. e, Fluorescence microscopy of ScPex39-mNeonGreen in yeast grown in medium with oleic acid as the primary energy source, a condition that stimulates peroxisomal biogenesis. Peroxisomes were visualized with Pex3-mScarlet. Scale bar: 5 μm. f, Immunoblots of cellular fractions from wild-type HCT116 cells. In parentheses are the subcellular compartments that GAPDH, SCP2, and Histone H3 are markers for. SCP2 represents the ~15 kDa protein that results from transcription of a downstream promoter for the SCP2 gene and has been used previously as a marker of peroxisomes,. Source data
Extended Data Fig. 2
Extended Data Fig. 2. Investigation of protein complex formation involving HsPEX39 in vitro.
a, Determination of protein composition of complexes identified by native-PAGE assays. Top: The indicated recombinant proteins, alone or mixed together, were analyzed by native-PAGE and Coomassie/TCA staining. In-gel positions of PEX7 alone (PEX7), PEX5 alone (PEX5), HsPEX39 alone (HsPEX39), and protein complexes A-D are indicated. Bottom: Bands for complexes A-D in the native gel (top) were excised from a Ponceau S-stained membrane, eluted with Laemmli sample buffer, and analyzed by SDS-PAGE and immunoblotting to verify the protein composition of the complexes. b, Recombinant FLAG-PEX7, GST-HsPEX39, H6PHYH, and H6PEX5(1-324) were analyzed alone or in the indicated mixtures using size-exclusion chromatography (SEC). Collected fractions were analyzed by SDS-PAGE and Coomassie staining (top). The corresponding area of the chromatogram is also shown (bottom). The elution volumes of the protein complexes, individual recombinant proteins, and molecular weight standards (Ferritin and BSA) are indicated. c, Recombinant GST-HsPEX39, H6PHYH, and H6PEX5(1-324) were analyzed alone or in the indicated mixtures by SEC. Collected fractions were analyzed by SDS-PAGE and Coomassie staining (top). The corresponding area of the chromatogram is also shown (bottom). The elution volumes of the species of interest and molecular weight standards (Ferritin, BSA) are indicated. d, The purity of FLAG-PEX7, GST-HsPEX39, H6PHYH, and H6PEX5(1-324) was assessed by SDS-PAGE and Coomassie staining. The asterisk indicates an Escherichia coli contaminant that co-purifies with recombinant HsPEX39. L, protein ladder. Source data
Extended Data Fig. 3
Extended Data Fig. 3. Characterization of PEX39 loss in yeast cells.
a, Growth of the indicated yeast strains in oleic acid medium. Data are mean ± standard deviation (SD) (n = 4). b, Growth of the indicated yeast strains in glucose medium. Data are mean ± SD (n = 3). c, Immunoblots of the two additional biological replicates used for quantification of the subcellular distribution of proteins in Fig. 2c. Experiments performed as described in Fig. 2b using the indicated strains. d, Immunoblots of cellular fractions from wild-type and pex7Δ yeast. Experiment performed as described in Fig. 2b. e, Immunoblot analysis of Pex7 levels in the indicated yeast strains. Wild-type, Scpex39Δ, pex7Δ yeast and deletion strains transformed with plasmids containing Scpex39 or pex7 under the control of endogenous promotors or a strong TEF2 overexpression promotor (_OE) were cultured in oleic acid medium. pPEX39_ΔN, plasmid encoding for an N-terminally truncated variant of ScPex39 (amino acids 40-132) that retains the RPWE motif. Detection of endogenous Pex7 levels was accomplished by covering intense signals detected for overexpressed Pex7. Shorter and longer exposures denoted by s.e. and l.e., respectively. L, protein ladder. f, Immunoblots of cellular fractions from Scpex39Δ and pex7Δ yeast transformed with a plasmid containing pex7 under the TEF2 promoter (pPEX7_OE). Experiments were performed as described in Fig. 2b. An asterisk indicates a non-specific band. Two biological replicates are shown. c,d,f, PNS, post-nuclear supernatant; S, cytosolic supernatant; OP, organellar pellet. Source data
Extended Data Fig. 4
Extended Data Fig. 4. Characterization of PEX39 loss in human cells.
a, Quantification of mature ACAA1, mature AGPS, PEX7, and PEX5 in HsPEX39-knockout cells using band intensities of immunoblots prepared per Fig. 2f. Loading-control intensities were used to normalize protein abundance across samples and the normalized abundances were then divided by the mean value of the corresponding control cells. The names of quantified proteins are shown on the bottom. Precursor forms of ACAA1 and AGPS were undetectable and thus not quantified. Data are mean ± standard error of the mean (SEM) (n = 3), and P values were calculated using unpaired, two-tailed t-tests. b, Immunoblot analysis of cells generated via lentiviral transduction of Cas9 and multiple independent sgRNAs against HsPEX39 (sgHsPEX39_1-3) or a negative control sgRNA against the AAVS1 gene (sgAAVS1) in the CAKI-2 and NCI-H1792 cell lines. Note that the residual HsPEX39 signal in these cells is because not all cells in the population will have complete loss of the protein. Solid and open red arrowheads indicate mature and precursor forms, respectively. Precursor forms of ACAA1 and AGPS were undetectable. CANX is a loading control. Short and long exposures are denoted s.e. and l.e., respectively. c, Immunoblots of whole-cell (Cell), cytosolic (Cyto), and organellar (Org) fractions prepared from the CAKI-2 cells expressing sgAAVS1 (negative control) or sgHsPEX39_1 described in b. Solid and open red arrowheads indicate mature and precursor forms, respectively. The cellular fractions that RPS6KB1 and CANX are markers for are indicated in parentheses. Source data
Extended Data Fig. 5
Extended Data Fig. 5. Investigation of the effects of excess PEX39.
a, Immunoblot analysis of HEK293T cells overexpressing GAPDH or HsPEX39 (1/300 dilution of cellular lysate). Asterisk indicates non-specific band. b, Immunoblots of whole-cell (Cell), cytosolic (Cyto), and organellar (Org) fractions from the indicated cells. Solid and open arrowheads indicate mature and precursor forms, respectively. c, PEX7 and PEX5 band intensities from immunoblots prepared per Fig. 3a were normalized to those of loading controls. Normalized protein abundances were then divided by the mean of GAPDH overexpressing cells. Data are mean ± SEM (n = 3). P values are calculated using unpaired, two-tailed t-tests. d, 35S-MmSCP2 (Mus musculus SCP2) in vitro import assays in the presence of the indicated proteins. After incubation, reactions were treated with trypsin, and organelles were analyzed by SDS-PAGE and autoradiography. SCP2 is a ~ 60 kDa protein (open arrowhead) that is processed within the peroxisome to a smaller form (solid arrowhead). NDPEX14, HsPEX14 residues 1-80 that inhibits protein import. e, 35S-PEX5(C11K) in vitro import assays in the presence of the indicated proteins. After incubation, organellar pellet (OP) and cytosolic supernatant (S) fractions were analyzed by SDS-PAGE and autoradiography. Unmodified 35S-PEX5(C11K) (“PEX5”) and monoubiquitinated 35S-PEX5(C11K) (“Ub-PEX5”) are indicated. Monoubiquitinated 35S-PEX5(C11K) in the supernatant reflects successful PEX5 processing by peroxisomes and import of PTS1-containing proteins. TPR, PEX5 variant that inhibits PEX5(C11K) processing. d,e, i, input (5% of the reticulocyte lysate containing the 35S-labeled protein used in each reaction). f, HsPEX39 RNA-seq data (TPM) from the DepMap Portal (https://depmap.org/portal/) for 369 cell lines for which proteomics was performed and HsPEX39 was undetectable. Cell lines used in our study are red. The dashed line indicates the cutoff (TPM = 1) for the HsPEX39 gene to be considered expressed; cell lines that do not meet that cutoff are grey. g, Growth of the indicated yeast strains in glucose medium. Data for wild-type, Scpex39Δ, and Scpex39Δ + pPEX39 are the same as shown in Extended Data Fig. 3b. Data are mean ± SD (n = 3). h, Biological replicates for the experiment in Fig. 3f. i, Characterization of organelle-associated Pex7 and Pot1 in yeast overexpressing ScPex39. Left: immunoblots of cellular fractions of yeast overexpressing ScPex39 as described for Fig. 3f. Right: immunoblot analysis of salt-extraction of proteins from organellar pellets isolated as described for Fig. 3f. T, total; S, supernatant fraction; P, pellet fraction. Source data
Extended Data Fig. 6
Extended Data Fig. 6. Assessment of PEX7 complex formation and confidence measures of predicted AlphaFold modelling.
a, Native-PAGE and Coomassie/TCA staining of the indicated recombinant proteins. In-gel positions of PEX7 alone (PEX7), PEX5 alone (PEX5), and the PEX7-PEX5-PHYH complex (*) are indicated. H6PHYH is a basic protein that does not enter these gels alone. b, Confidence measures for human protein complex predictions. Predicted aligned error plots and predicted LDDT (local distance difference test) plots of human AlphaFold models. To predict human protein complexes, PEX39 (full-length), PEX7 (full-length), the PTS2 sequence of PHYH (amino acids 1-24), and the PEX7 binding domain of the long isoform of PEX5 (amino acids 179-266) were used. c, Confidence measures for yeast protein complex predictions. Same plots as described in b for predictions of yeast protein complexes. Protein complexes from yeast were predicted using ScPex39 (full-length), Pex7 (full-length), the PTS2 sequence of Pot1 (amino acids 1-30), and the Pex7 binding domain of Pex18 (amino acids 192-283). Source data
Extended Data Fig. 7
Extended Data Fig. 7. Characterization of N-terminal region and [R/K]PWE motif of PEX39.
a, Biological replicate for experiment in Fig. 5c. b, Immunoblots of post-nuclear supernatants from the indicated yeast strains. Scpex39Δ cells were transformed with plasmids for expression of wild-type ScPex39 (pPEX39) or the ScPex39 RPWE-to-AAAA mutant [pPEX39(4A)], each under control of the endogenous promoter. c, Biological replicates for cellular fractionation of Scpex39Δ cells expressing the ScPex39 RPWE-to-AAAA mutant. Experiments were performed on the indicated strains as described in Fig. 5d. d, Growth of the indicated yeast strains in glucose medium. Data for wild-type, Scpex39Δ, and Scpex39Δ + pPEX39 are the same as shown in Extended Data Fig. 3b. Data are mean ± SD (n = 3). e, Multiple sequence alignment of PEX7 orthologs from the indicated species via ClustalΩ (v.1.2.4), which was used for coloring of PEX7 sequence conservation in Fig. 5g. f, Quantification of changes in mature and precursor forms using band intensities of immunoblots prepared per Fig. 5h. Precursor and mature form band intensities were normalized to those of loading controls. The data for cells overexpressing GAPDH and HsPEX39 are the same as shown previously in Fig. 3b. All overexpression lines were processed together in the same experiments to generate these data. g, Immunoblots of whole-cell (Cell), cytosolic (Cyto), and organellar (Org) fractions from the indicated cells. Solid and open red arrowheads indicate mature and precursor forms, respectively. Dashed lines indicate where different lanes of the same membrane were brought together. The data for cells overexpressing GAPDH and HsPEX39 are the same as shown previously in Extended Data Fig. 5b. All overexpression lines were processed together in the same experiment to generate these data. h, Quantification of PEX7 and PEX5 band intensities from immunoblots prepared per Fig. 5h. PEX7 and PEX5 band intensities were normalized to those of loading controls. Normalized protein abundances were then divided by the mean of the cells overexpressing GAPDH. The data for cells overexpressing GAPDH and HsPEX39 are the same as shown previously in Extended Data Fig. 5c. All overexpression lines were processed together in the same experiments to generate these data. f,h, Data are mean ± SEM (n = 3). Multiplicity-adjusted P values were calculated using ordinary, one-way ANOVA with Dunnett’s multiple comparisons test. Source data
Extended Data Fig. 8
Extended Data Fig. 8. Characterization of the KPWE motif in the N-terminus of PEX13.
a, ScanProsite analysis of generic [R/K]-P-W-[E/Q] motifs in yeast and humans. The UniProtKB sequence databases of yeast or human were searched for proteins harboring the short linear motif [R/K]-P-W-[E/Q] using the webtool ScanProsite (https://prosite.expasy.org/scanprosite/). Hits were then compared with proteins listed as yeast and human PEX7 interactors in the BioGRID database. b, Recombinant FLAG-PEX7 and NtPEX13, alone or mixed together, were analyzed by SEC. Collected fractions were analyzed by SDS-PAGE and Coomassie staining (top). The corresponding area of the chromatogram is also shown (bottom). The elution volumes of the PEX7-NtPEX13 complex, the individual recombinant proteins, and molecular weight standards (Ferritin, BSA, RNAse A) are indicated. The asterisk indicates a proteolytic product of NtPEX13. c, Confidence measures for modeling the PEX7-PEX13 interaction for human and yeast orthologs. Predicted aligned error plots (top) and predicted LDDT (local distance difference test) plots (bottom) of human (left) and yeast (right) AlphaFold models. To predict human and yeast protein complexes, full-length PEX7 and the N-terminus of PEX13 (residues 1-55) were used. d, 35S-ACAA1 in vitro import assays in the presence of increasing concentrations of NtPEX13 or NtPEX13(4A). After incubation, reactions were treated with trypsin and organelles were isolated by centrifugation and analyzed by SDS-PAGE and autoradiography. Precursor and mature ACAA1 indicated by open and solid red arrowheads, respectively. I, input (5% of the reticulocyte lysate containing the 35S-ACAA1 used in each reaction). e, 35S-PEX5(C11K) in vitro import assays in the presence or absence of NtPEX13. After incubation, organelle pellet (OP) and cytosolic supernatant (S) fractions were isolated by centrifugation and analyzed by SDS-PAGE and autoradiography. Unmodified 35S-PEX5(C11K) (“PEX5”) and monoubiquitinated 35S-PEX5(C11K) (“Ub-PEX5”) are indicated. AMP-PNP inhibits the ATPases PEX1/PEX6 and thereby inhibits the transfer of monoubiquitinated 35S-PEX5(C11K) from peroxisomes into the cytosolic supernatant. I, input [5% of the reticulocyte lysate containing the 35S-PEX5(C11K) used in each reaction]. Source data
Extended Data Fig. 9
Extended Data Fig. 9. Characterization of ScPex13 with a mutated KPWE motif.
a, Biological replicates of the cellular fractionation of yeast expressing the ScPex13 KPWE-to-AAAA mutant. Experiments were performed on the indicated strains as described in Fig. 6g. b, Characterization of organelle-associated Pex7 and Pot1 in yeast expressing the ScPex13 KPWE-to-AAAA mutant. The strains used are described in Fig. 6g. Top: immunoblots of cellular fractionation of yeast expressing the ScPex13 KPWE-to-AAAA mutant as described for Fig. 6g. Bottom: immunoblot analysis of salt-extraction of proteins from organellar pellets isolated as described for Fig. 6g. T, total; S, supernatant fraction; P, pellet fraction. Source data
Extended Data Fig. 10
Extended Data Fig. 10. Comparison of structural predictions of yeast and human PEX7.
Superimposition of AlphaFold structural models of human and yeast PEX7. Predicted models were directly received from the AlphaFold database (https://alphafold.ebi.ac.uk/) using accession codes AF-O00628-F1-v4 (HsPEX7) and AF-P39108-F1-v4 (ScPex7) and superimposed using ChimeraX. AlphaFold confidence scores (that is, strength of structural predictions) are shown according to the predicted local distance difference test (pLDDT) (right). Extended loops of ScPex7 are highlighted in red and respective amino acids are labelled (bottom).

References

    1. Kumar, R., Islinger, M., Worthy, H., Carmichael, R. & Schrader, M. The peroxisome: an update on mysteries 3.0. Histochem. Cell Biol.161, 99–132 (2024). - PMC - PubMed
    1. Yifrach, E. et al. Defining the mammalian peroxisomal proteome. Subcell. Biochem.89, 47–66 (2018). - PubMed
    1. Waterham, H. R., Ferdinandusse, S. & Wanders, R. J. Human disorders of peroxisome metabolism and biogenesis. Biochim. Biophys. Acta1863, 922–933 (2016). - PubMed
    1. Francisco, T. et al. Protein transport into peroxisomes: knowns and unknowns. BioEssays39, 1700047 (2017). - PubMed
    1. Skowyra, M. L., Feng, P. & Rapoport, T. A. Towards solving the mystery of peroxisomal matrix protein import. Trends Cell Biol.34, 388–405 (2024). - PMC - PubMed

MeSH terms

LinkOut - more resources