. 2025 Sep;645(8080):518-525.
doi: 10.1038/s41586-025-09298-z. Epub 2025 Jul 30.

Design of highly functional genome editors by modelling CRISPR-Cas sequences

Affiliations

Design of highly functional genome editors by modelling CRISPR-Cas sequences

Jeffrey A Ruffolo et al. Nature. 2025 Sep.

Abstract

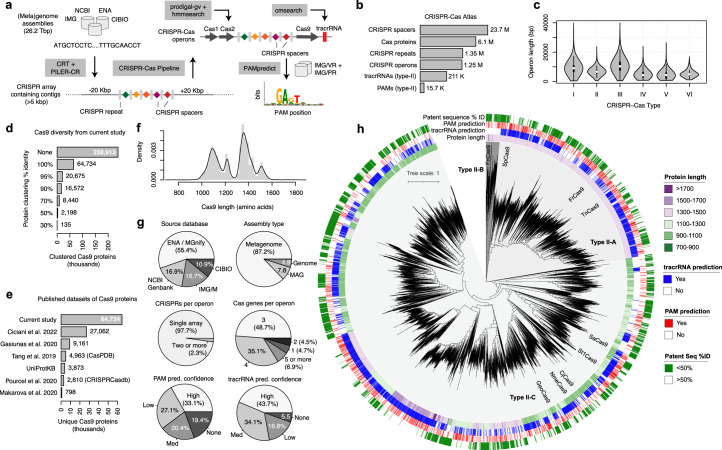
Gene editing has the potential to solve fundamental challenges in agriculture, biotechnology and human health. CRISPR-based gene editors derived from microorganisms, although powerful, often show notable functional tradeoffs when ported into non-native environments, such as human cells1. Artificial-intelligence-enabled design provides a powerful alternative with the potential to bypass evolutionary constraints and generate editors with optimal properties. Here, using large language models2 trained on biological diversity at scale, we demonstrate successful precision editing of the human genome with a programmable gene editor designed with artificial intelligence. To achieve this goal, we curated a dataset of more than 1 million CRISPR operons through systematic mining of 26 terabases of assembled genomes and metagenomes. We demonstrate the capacity of our models by generating 4.8× the number of protein clusters across CRISPR-Cas families found in nature and tailoring single-guide RNA sequences for Cas9-like effector proteins. Several of the generated gene editors show comparable or improved activity and specificity relative to SpCas9, the prototypical gene editing effector, while being 400 mutations away in sequence. Finally, we demonstrate that an artificial-intelligence-generated gene editor, denoted as OpenCRISPR-1, exhibits compatibility with base editing. We release OpenCRISPR-1 to facilitate broad, ethical use across research and commercial applications.


Conflict of interest statement

Competing interests: All authors are current or former employees, contractors or executives of Profluent Bio Inc and may hold shares in Profluent Bio Inc.

Figures

Fig. 1
Fig. 1. Generation of diverse Cas protein families.
a, Overview of the language-modelling approach to design CRISPR–Cas systems. LMs learn the general constraints of protein evolution through pretraining on diverse proteins spanning the evolutionary tree and then are specialized for design by fine-tuning on Cas protein and nucleic acid data. b, Expansion of the sequence diversity for 45 Cas protein families, measured by the number of clusters (at 70% sequence identity (70%ID)) for natural proteins and clusters from generated sequences. Stacked bars are coloured by the source of the sequences making up their clusters (CRISPR–Cas Atlas, recovered from CRISPR–Cas mining; generated Cas, 4 million generated proteins from this study). Heatmap indicates the natural distribution of each protein family across different types of CRISPR–Cas systems. c, AlphaFold2 was used to predict structures for 2,000 randomly selected generated proteins. The scatterplot shows the distribution of mean pLDDT and the %ID to natural proteins from the CRISPR–Cas Atlas.
Fig. 2
Fig. 2. LMs generate complete type II effector systems.
a, Phylogenetic tree of natural and generated proteins clustered at 40%ID (n = 15,340 cluster representatives). Biochemically characterized Cas9s from ref. are labelled, and Cas9 proteins used as genome editors are shown in bold. Lineages are coloured black if they contain any natural protein or green if they are exclusively represented by generated proteins. b, Pie chart indicates the percent of phylogenetic diversity represented by natural or generated proteins. Phylogenetic diversity was calculated as the cumulative branch length of subtrees represented by a given set of sequences. c, Distribution of the identity of generated Cas9 to the nearest protein in the CRISPR–Cas Atlas. d, Comparison of protein length between natural and generated proteins in the same 50%ID clusters. e, Fraction of generated and natural Cas9 proteins containing key functional domains according to structural searches with Foldseek against SCOPe families. In total, 79.2% and 48.2% of natural and generated proteins were functionally complete, respectively. f, Predicted structure for new Cas9-like protein selected from a 30%ID cluster with 423 members composed entirely of generated sequences. Despite high sequence novelty (39.2%ID to CRISPR–Cas Atlas), the predicted structure bears structural resemblance to Nme1Cas9 (Protein Data Bank ID 6JE9, template modelling score (TM-score) = 0.72). g, Naturally occurring and generated crRNAs and tracrRNAs were obtained for a set of ten effector proteins. h, sgRNAs were formed from RNA components and embedded into a two-dimensional space by t-distributed stochastic neighbour embedding according to the pairwise edit distances. Each point represents an sgRNA sequence, with colours corresponding to source protein. Tree scale bar, 1.0.
Fig. 3
Fig. 3. Generated nucleases function as gene editors in human cells.
a, Phylogenetic tree of natural Cas9 proteins, ancestral reconstructions and generated effector proteins near SpCas9. Annotations surrounding the tree indicate selection criteria used to identify 48 generated proteins for further characterization. b, Editing efficiency (indel rate relative to SpCas9) of 209 generated proteins across three target sites: HEK3 (i), HEK2 (ii) and CD3G_1 (iii). Sequences are ordered according to relative indel rates, with the number of sequences showing activity and surpassing SpCas9 indicated on the x axis. c, Mutational Levenshtein distances from the nearest natural protein in the CRISPR–Cas Atlas and SpCas9 for 131 generated proteins with observed editing activity. The Levenshtein distance is the minimal number of edits between two sequences, including substitutions, insertions and deletions. d, On- and off-target editing efficiency for SpCas9 and 48 generated proteins. Points correspond to on- or off-target editing at five sites (AAVs1, FANCF, HEK2, HEK3, VEGFA; with three off targets per site). Bars reflect the median of all on- and off-target editing. e, On- and off-target editing efficiency for natural Cas9s, high-fidelity variants, chimeric sequences, consensus designs, ancestral reconstructions (rec.), HMM emissions, arDCA designs, LigandMPNN designs and generated proteins from this work. Each point represents the average on- or off-target editing at five sites (with three off targets per site) for a single protein. f, Genome-wide off-target analysis using SITE-Seq, measured at four enzyme concentrations. Points represent the percentage of total cleavage events for each guide that occurred at on-target sites. Bars represent the median across sites. Tree scale bar, 1.0.
Fig. 4
Fig. 4. Characterization of OpenCRISPR-1 across PAMs, guides and base editing.
a,b, On-target editing efficiency (indel formation) of OpenCRISPR-1 (OC-1) protein at NGG (n = 49) and non-NGG PAMs (n = 43) (a). OpenCRISPR-1 exhibits comparable activity at targets with an NGG PAM but lower editing at sites lacking an NGG PAM (b). c, Relative activity of SpCas9 to OpenCRISPR-1 across sites with different PAMs (NGG, n = 49; NGC, n = 11; NGT, n = 10; NGA, n = 10; NAG, n = 9; NTG, n = 2; NCG, n = 1). d, Adenine base editors were created by attaching deaminase domains to the N terminus of OpenCRISPR-1 and SpCas9 nickase variants (D10A mutation for both proteins). e, Adenine base editing efficiency (A-to-G) at three target sites: HEK2 (i), T39 (ii), CD3G_1 (iii). ABE8.20 is a highly active deaminase from directed evolution, whereas PF-DEAM-1 and PF-DEAM-2 were generated from LMs. Across all target sites and with distinct deaminases, OpenCRISPR-1 nickase shows compatibility with base editing. f, Editing efficiency at HEK3 target site with designed sgRNAs (green) and SpCas9’s sgRNA (grey). Four of five generated proteins displayed increased editing efficiency with design sgRNAs. g, Change in editing efficiency compared to SpCas9’s sgRNA. The majority of designed sgRNAs yield performance that is not significantly different from SpCas9’s guide, whereas a subset either significantly improves or worsens editing efficiency (t-test P value < 0.05).
Extended Data Fig. 1
Extended Data Fig. 1. Formation of the CRISPR-Cas Atlas.
a) Pipeline for discovery and annotation of 1.25 M CRISPR-Cas operons from 26.2 Tbp of genome and metagenome assemblies. b) Summary of different entities across the CRISPR-Cas atlas. c) Distribution of operon lengths across CRISPR-Cas types. d) 238,913 Cas9 proteins were identified from Type II CRISPR-Cas operons and clustered using MMseqs2. e) Comparison of the number of unique Cas9 proteins compared to previously published datasets,–. UniProtKB was queried in March 2024 using search term: gene = Cas9. f) Length of 64,734 unique Cas9 proteins from the CRISPR-Cas Atlas. g) Summary statistics across 64,734 CRISPR-Cas operons. h) Phylogenetic tree of 8,441 Cas9s clustered at 70% identity. Phylogenetic tree built using FastTree2 and visualized using iTOL.
Extended Data Fig. 2
Extended Data Fig. 2. Cumulative identity of natural and generated CRISPR-Cas proteins.
Comparison of sequence novelty for natural and generated CRISPR-Cas proteins, quantified by the cumulative percentage of positions matched by an aligned sequence from a reference database. a) Cumulative identity for 10,000 natural CRISPR-Cas proteins. Each line corresponds to the nearest reference sequence considered from the CRISPR-Cas Atlas. Points represent the median values, while shaded regions reflect the interquartile range. b) Cumulative identity for 10,000 generated CRISPR-Cas proteins. Each line corresponds to the nearest reference sequence considered from the CRISPR-Cas Atlas. Points represent the median values, while shaded regions reflect the interquartile range. c) Comparison of cumulative identity for natural and generated CRISPR-Cas proteins at similar levels of identity to the nearest reference sequence. Each line is composed of ten points, with each representing the median cumulative identity value of natural and generated proteins for a given number of reference sequences. Natural and generated CRISPR-Cas sequences show similar levels of novelty.
Extended Data Fig. 3
Extended Data Fig. 3. Structural composition of generated CRISPR-Cas proteins.
Generated and natural CRISPR-Cas proteins were clustered at 70% identity using MMseqs2. For both generated and natural proteins, random representatives of the largest 5,000 clusters were selected for structural analysis. Structures were predicted using the ColabFold implementation (v1.5.2) of AlphaFold2 using multiple sequence alignments (MSAs) from the ColabFoldDB (no templates). a) Generated sequences yield high confidence AlphaFold2 structure predictions despite significant sequence divergence from natural proteins. b) Predicted structures for generated proteins align well to experimentally determined structures from the PDB. c) Using Foldseek (v8.ef4e960), predicted structures for generated and natural proteins were searched against the SCOPe database (v2.08). Points in the left plot represent the fraction of generated (green) and natural (gray) proteins containing the twenty most commonly observed SCOPe families among both generated and natural sequences. Distributions in the right plot show the sequence identity over aligned residues between the generated and natural proteins and the best-matching SCOPe family structure. Overall, generated proteins were composed of similar structural components as compared to natural proteins, with levels of per-domain sequence similarity to particular SCOPe families being similar between the two sets of sequences. d) Examples of four most frequently observed SCOPe families (brown) aligned to generated (green) and natural (gray) proteins.
Extended Data Fig. 4
Extended Data Fig. 4. Cumulative identity of natural and generated Cas9 proteins.
Comparison of sequence novelty for natural and generated Cas9 proteins, quantified by the cumulative percentage of positions matched by an aligned sequence from a reference database. a) Cumulative identity for 10,000 natural Cas9 proteins. Each line corresponds to the nearest reference sequence considered from the CRISPRCas Atlas. Points represent the median values, while shaded regions reflect the interquartile range. b) Cumulative identity for 10,000 generated Cas9-like proteins. Each line corresponds to the nearest reference sequence considered from the CRISPR-Cas Atlas. Points represent the median values, while shaded regions reflect the interquartile range. c) Comparison of cumulative identity for natural and generated Cas9 proteins at similar levels of identity to the nearest reference sequence. Each line is composed of ten points, with each representing the median cumulative identity value of natural and generated proteins for a given number of reference sequences. Natural and generated Cas9 sequences show similar levels of novelty.
Extended Data Fig. 5
Extended Data Fig. 5. Structural composition of generated Cas9 proteins.
Generated and natural Cas9 proteins were clustered at 70% identity using MMseqs2. For both generated and natural proteins, random representatives of the largest 1,000 clusters were selected for structural analysis. Structures were predicted using the ColabFold implementation (v1.5.2) of AlphaFold2 using multiple sequence alignments (MSAs) from the ColabFoldDB (no templates). a) Generated sequences yield high confidence AlphaFold2 structure predictions despite significant sequence divergence from natural proteins. b) Predicted structures for generated proteins align well to experimentally determined structures from the PDB. c) Using Foldseek (v8.ef4e960), predicted structures for generated and natural proteins were searched against the SCOPe database (v2.08). Points in the left plot represent the fraction of generated (green) and natural (gray) proteins containing the ten most commonly observed SCOPe families. Distributions in the right plot show the sequence identity over aligned residues between the generated and natural proteins and the best-matching SCOPe family structure. Overall, generated proteins were composed of similar structural components as compared to natural proteins, with levels of per-domain sequence similarity to particular SCOPe families being similar between the two sets of sequences. d) Examples of four most frequently observed SCOPe families (brown) aligned to generated (green) and natural (gray) proteins.
Extended Data Fig. 6
Extended Data Fig. 6. gRNA model predicts exchangeability of RNAs between orthologous Cas9s.
a-c) crRNA:tracrRNA pairs were obtained for 1,591 distinct natural Cas9 sequences not used to train the gRNA model. The gRNA model was used to score native RNA:protein and non-native RNA:protein interactions. Additionally, pairwise identity was computed between RNA and protein sequences. a) RNA sequences diverge along with Cas9, but at a slower rate. b) RNA edit distance is correlated with the gRNA model score. c) gRNA model scores remain high for gRNAs exchanged between Cas9 proteins that display >70% identity. d) In 2013, Fonfara et al. tested the exchangeability of dual guide RNAs in vitro between eight diverse Type II CRISPR-cas systems. DNA cleavage rates from Fonfara et al. are displayed in the figure as: +++: 75–100%, ++: 50–75%, +: 25–50%. We applied the gRNA model to score each pair of Cas9:RNA sequence pairs. The gRNA model outputs a log likelihood for each protein:RNA pairing. The matrix shows a relative gRNA compatibility score, quantified as the softmax over the RNA log likelihoods for each protein. Note: Fonfara et al. also tested F. novicida Cas9 and RNA molecules; however, because the tracrRNA for this and related proteins were not found in our training set, we excluded F. novicida from this analysis.
Extended Data Fig. 7
Extended Data Fig. 7. Experimental characterization of alternative natural and designed nucleases.
On- and off-target editing efficiency at five sites (AAVs1, HEK2, HEK3, FANCF, and VEGFA) for natural Cas9s, high-fidelity variants, chimeric sequences, consensus designs, ancestral reconstructions, HMM emissions, arDCA designs, LigandMPNN designs, and generated proteins from this work. Points correspond to on- or off-target editing at five sites (with three off-targets per site). Bars reflect the median of all on- and off-target editing. All sequences, aside from those generated by language models, had their PAM-interacting domain fixed to match that of SpCas9 to facilitate comparison at the same target sites. S. cristatus Cas9, the closest natural protein to OpenCRISPR-1, was only tested as a N626S point mutant, which may not have the same level of activity as the wild type sequence. The wild type sequence could not be cloned.
Extended Data Fig. 8
Extended Data Fig. 8. Comparison of SITE-Seq off-targets between SpCas9 and OpenCRISPR-1.
SITE-Seq was performed to identify off-targets for SpCas9 and OpenCRISPR-1 using five different guide RNAs and at four different RNPs concentrations.
Extended Data Fig. 9
Extended Data Fig. 9. Generated Cas9-like proteins are less immunogenic than SpCas9.
iELISA antibody quantification values indicate raw OD450nm values showing the amount of bound human antibody to each Cas9 protein. Plates were coated with purified proteins for SpCas9, PF-CAS-182 (OpenCRISPR-1), PF-CAS-189, and PF-CAS-151 at a concentration of 1 µg/mL (100 ng/well). Serum samples were diluted at 100-fold to 1600-fold. Generated Cas9-like proteins are less immunogenic than SpCas9 at one or more sample dilution levels.
Extended Data Fig. 10
Extended Data Fig. 10. Structural analysis of OpenCRISPR-1.
The structure of the OpenCRISPR1 protein was predicted with AlphaFold2 using multiple-sequence alignments from ColabFoldDB and template structure of SpCas9’s catalytic state (PDB: 7Z4J). The predicted protein structure was aligned to complex with the sgRNA and DNA. a) Structural model of OpenCRISPR-1 effector complex in catalytic state. Insertions in the HNH and REC1 domains with potential functional implications are highlighted. b) Analysis of OpenCRISPR-1 mutational distribution relative to SpCas9 according to residue burial (top) and whether a residue is in contact (<4.0 Å) with nucleic acids (bottom). Residue burial was not a significant determinant of mutational distribution, while nucleic-acid contacting residues were significantly depleted in mutations (chi-squared contingency test, p < 0.05). c) Nine-residue positively charged insertion in the REC1 domain of OpenCRISPR-1, which introduces stabilizing interactions with the phosphate backbone of the guide RNA’s repeat:anti-repeat segment and the target DNA’s PAM-proximal region. d) Four-residue insertion in the HNH domain of OpenCRISPR-1 modeled in the checkpoint state (PDB: 7Z4L), which may serve to stabilize the cleavage checkpoint state.

References

    1. Pacesa, M., Pelea, O. & Jinek, M. Past, present, and future of crispr genome editing technologies. Cell187, 1076–1100 (2024). - PubMed
    1. Nijkamp, E., Ruffolo, J. A., Weinstein, E. N., Naik, N. & Madani, A. Progen2: exploring the boundaries of protein language models. Cell Syst.14, 968–978 (2023).
    1. Wu, Z. et al. Programmed genome editing by a miniature CRISPR–Cas12f nuclease. Nat. Chem. Biol.17, 1132–1138 (2021). - PubMed
    1. Chen, K. et al. Lung and liver editing by lipid nanoparticle delivery of a stable CRISPR–Cas9 ribonucleoprotein. Nat. Biotechnol.10.1038/s41587-024-02437-3 (2024).
    1. Eggers, A. R. et al. Rapid DNA unwinding accelerates genome editing by engineered CRISPR–Cas9. Cell187, 3249–3261 (2024). - PMC - PubMed

MeSH terms

Substances

LinkOut - more resources