. 2025 Sep;645(8080):496-506.
doi: 10.1038/s41586-025-09332-0. Epub 2025 Jul 30.

Respiratory viral infections awaken metastatic breast cancer cells in lungs

Affiliations

Respiratory viral infections awaken metastatic breast cancer cells in lungs

Shi B Chia et al. Nature. 2025 Sep.

Abstract

Breast cancer is the second most common cancer globally, with most deaths caused by metastatic disease, often following long periods of clinical dormancy1. Understanding the mechanisms that disrupt the quiescence of dormant disseminated cancer cells (DCCs) is crucial for addressing metastatic progression. Infections caused by respiratory viruses such as influenza and SARS-CoV-2 trigger both local and systemic inflammation2,3. Here we demonstrate, in mice, that influenza and SARS-CoV-2 infections lead to loss of the pro-dormancy phenotype in breast DCCs in the lung, causing DCC proliferation within days of infection and a massive expansion of carcinoma cells into metastatic lesions within two weeks. These phenotypic transitions and expansions are interleukin-6 dependent. We show that DCCs impair lung T cell activation and that CD4+ T cells sustain the pulmonary metastatic burden after the influenza infection by inhibiting CD8+ T cell activation and cytotoxicity. Crucially, these experimental findings align with human observational data. Analyses of cancer survivors from the UK Biobank (all cancers) and Flatiron Health (breast cancer) databases reveal that SARS-CoV-2 infection substantially increases the risk of cancer-related mortality and lung metastasis compared with uninfected cancer survivors. These discoveries underscore the huge impact of respiratory viral infections on metastatic cancer resurgence, offering new insights into the connection between infectious diseases and cancer metastasis.


Conflict of interest statement

Competing interests: J.A.A.-G. is a co-founder, advisory board member and equity holder in HiberCell, a Mount Sinai spin-off that develops cancer recurrence-prevention therapies. He consults for HiberCell and Astrin Biosciences, serves as chief mission advisor for the Samuel Waxman Cancer Research Foundation and has ownership interest in patent number WO2019191115A1/ EP-3775171-B1. J.D. and M.R. are on the scientific advisory board for Mitotherapeutix. J.C.C. is a cofounder and chief scientific officer of OncoRx Insights. M.C.-H. holds shares in the O-SMOSE company and has no conflict of interest to disclose; consulting activities conducted by the company are independent of the present work. H.M. has consulted for Astra Zeneca relating to the use of monoclonal antibodies in the prevention and treatment of SARS-CoV-2 infection. All other authors declare no competing interests.

Figures

Fig. 1
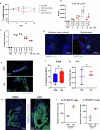
Fig. 1. Influenza A virus infection increases DCC in lungs.
a, MMTV-Her2 female mice in an FVB background were infected with a sublethal dose of Puerto Rico A/PR/8/34 H1N1 IAV by intranasal administration. Lungs and mammary glands were taken for analysis at the time points indicated after infection. b,c, Immunofluorescence (b) and quantification of HER2+ cells in lungs (c) at 3, 6, 9, 15, 28 and 60 dpi. The total number of HER2+ cells from three sections of the whole lung were quantified (n = 4 per group, n = 3 at 15 dpi). Lung sections were stained with DAPI (blue) and HER2 (green) as a marker for DCCs (b). d, Immunofluorescence and quantification of HER2+ cells in lungs 9 months after an influenza infection (n = 3 PBS, n = 5 IAV). e, Quantification of HER2+ cells in C57BL6/J MMTV-Her2 mouse lungs at 15 dpi with IAV (n = 4 PBS, n = 3 IAV). f, Immunohistochemistry and quantification of PyMT+ micrometastases defined by lesions with an area of less than 0.03 mm2 (n = 7 per group). g, EO771 mammary tumour cells were implanted into the mammary fat pads of C57BL/6 mice (n = 4 per group) and infected with IAV or PBS control after 31 days (experiment 1) and 20 days (experiment 2). The mice were implanted with 2 × 105 (experiment 1) or 1 × 106 EO771 (experiment 2) cells across two experiments, and combined results are shown. Lungs were taken for analysis 18 days (experiment 1) and 17 days (experiment 2) after infection and stained with H&E, and the tumour area and the numbers of lesions were quantified. For each experiment, the average of the quantification of the PBS-treated mouse lungs was set to 1, so that a fold change could be calculated. Significance was determined by one-way analysis of variance (ANOVA). All box-and-whisker plots are presented as maximum value (top line), median value (middle line) and minimum value (bottom line), with all data points shown as dots. Scale bars: a and d, 25 μm; f, 200 μm; g, 1 mm. Illustration in a created using BioRender (De Dominici, M., https://BioRender.com/i40c047; 2025). All replicates are biological. Source Data
Fig. 2
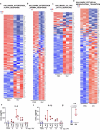
Fig. 2. Influenza A virus infection promotes dormant DCC proliferation and phenotypic change.
a,b, Immunofluorescence (a) and quantification (b) of Ki67+ HER2+ cells in lungs after IAV infection. Lung sections from naive and IAV-infected mice were stained with antibodies against HER2 (green), Ki67 (magenta) and DAPI (blue) (a). Percentage of Ki67+ HER2+ cells (b, left), absolute number of Ki67+ HER2+ cells across three lung sections (middle, n = 4 per group, n = 3 at 15 dpi) and detection of EdU incorporation (right, n = 3 per group). c,d, Immunofluorescence and quantification of vimentin+ (Vim+) (c) and EpCAM+ HER2+ (d) cells in lungs after influenza infections, in which lung sections from naive and IAV-infected mice were stained with HER2 (green) and vimentin (magenta) (n = 3 per group, n = 4 PBS, 9 dpi, 60 dpi) or HER2 (green) and EpCAM (magenta) (n = 3 per group). Graphs show the percentage of vimentin+ HER2+ (c) or EpCAM+ HER2+ (d) cells. In ad, statistical significance relative to PBS samples is shown, as determined by one-way ANOVA. e, GSEA analyses comparing DCCs from lungs of uninfected (PBS) and IAV-infected MMTV-Her2 mice at 9 dpi. See Supplementary Fig. 2 for the gating strategy used for sorting. fh, Heatmaps of significantly differentially expressed collagen (Col) isoforms/lysyl oxidase (f), metalloproteinase (Mmp) (g) and vascular endothelial growth factor (Vegf) and intercellular adhesion molecule (Icam)/vascular cell adhesion molecule-1 (Vcam1) genes (h). All box-and-whisker plots are presented as maximum value (top line), median value (middle line) and minimum value (bottom line) with all data points shown by dots. Scale bars: a, 25 μm; c and d, 10 μm. All replicates are biological. Source Data
Fig. 3
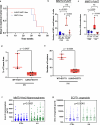
Fig. 3. IL-6 contributes to the awakening of dormant DCCs and proliferation.
ac, Lung sections of MMTV-Her2 or IL-6 KO:MMTV-Her2 mice at 9 and 28 dpi with IAV (or PBS) were stained for HER2 (green) and DAPI (blue) (a) and quantified at 9 dpi (b) and 28 dpi (c). Scale bars: 50 μm. d, Quantification of the percentage of HER2+ Ki67+ cells in MMTV-Her2 and IL-6 knockout:MMTV-Her2 at 9 dpi (n = 4 per group). NS, not significant. e,f, Quantification of the percentage of vimentin+ HER2+ (e) and EpCAM+ HER2+ (f) cells in MMTV-Her2 and IL-6 knockout:MMTV-Her2 mice at 9 dpi (vimentin) and 3 dpi (EpCAM) (n = 3 for PBS, n = 4 IAV). Significance was determined by one-way ANOVA. g, Mean mammosphere area per well for HER2+ organoids after treating with 10 ng ml−1 IL-6 (n = 5 per group) (g); significance was calculated by Mann–Whitney test. All box-and-whisker plots are presented as maximum value (top line), median value (middle line) and minimum value (bottom line) with all data points shown by dots. All replicates are biological. Source Data
Fig. 4
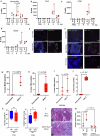
Fig. 4. CD4+ cells are required to maintain expanded HER2+ DCCs after IAV infection.
a, Adjacent lung sections of IAV-infected mice at 28 dpi were stained for HER2 (green) and CD4 (magenta, left and middle) or HER2 (green) and CD8 (magenta, right). b, As in a for IAV-infected MMTV-Her2 mice at 28 dpi, but for a region lacking CD4+ cells. c,d, Lung sections of MMTV-Her2 mice without or with CD4 depletion starting at −1 dpi or 10 dpi and taken for analysis at 28 dpi were stained for HER2 (green) and DAPI (blue) (shown for CD4 depletion starting at −1 dpi) (c). The number of HER2+ cells was quantified (n = 4 per group) (d). e, Quantification of HER2+ cells from MMTV-Her2 mice with CD4, CD8 or CD4/CD8 depletion (on −1 dpi) at 28 dpi (n = 4 per group, n = 3 CD8 depletion). f, Lung sections of MMTV-Her2 and CD4-depleted MMTV-Her2 mice at 28 dpi were stained for HER2 (green), CD8 (magenta) and DAPI (blue). g, Heatmap of the top 20 differentially expressed genes from scRNA-seq comparing CD4+ effector T cells from MMTV-Her2 + IAV versus wild type + IAV mice at 15 dpi. h, GSEA analysis showing pathway enrichment in effector CD8+ T cells in CD4-depleted MMTV-Her2 + IAV versus control MMTV-Her2 + IAV mice at 15 dpi. i, Concentration of IFNγ in a supernatant of enriched CD8+ cells enriched from lungs of MMTV-Her2 mice with or without CD4 depletion at 15 dpi and activated by anti-CD3/CD28 antibody (n = 4 IAV + IgG, n = 3 IAV + anti-CD4). j, Ex vivo CD8+ cytotoxic assay in which HER2+ cells were incubated with the same CD8+ cells (n = 3 per group). Significance was determined by one-way ANOVA (d and e) or two-tailed Student’s t-test (i and j). All box-and-whisker plots are presented as maximum value (top line), median (middle line) and minimum (bottom line) with all data points shown as dots. Scale bars: a, 25 μm; b, c and f, 50 μm. All replicates are biological. Source Data
Fig. 5
Fig. 5. SARS-CoV-2 infection increases cancer progression, metastasis to lungs and mortality.
a, Quantification of HER2+ cells across three lung sections in C57BL6/J MMTV-Her2 mouse lungs at 28 dpi with MA10 SARS-CoV-2 (n = 6) or PBS control (n = 7). b,c, Quantification of HER2+ cells and percentage of Ki67+ HER2+ cells at 3 dpi and 9 dpi with MA10 in the lungs of FVB MMTV-Her2 mice (n = 3 PBS at 3 dpi and n = 4 at 9 dpi) (b) and comparing MMTV-Her2 mice without (WT) or with Il6 knockout (n = 4 per group) (c). Significance was determined by two-tailed Student’s t-test (a,c). For b, we applied a negative binomial model for HER2+ cells per field comparing 9 dpi and PBS control (to accommodate the potential overdispersion); for HER2+Ki67+ cells per field, we determined whether cells per field in infected groups were significantly higher than 0 (all PBS samples were 0) using a negative binomial model. All replicates are biological. d,e, Epidemiological studies. d, Analyses from the UK Biobank examining the association between a SARS-CoV-2 test being positive or negative and the risk of all-cause, non-COVID-19 and cancer-related mortality in cancer survivors with cancer diagnoses more than 5 (red) or 10 (black) years before the start of the COVID-19 pandemic. The analyses compared mortality risks between positive-test and negative-test participants, using censoring dates for death events from 1 December 2020 to 31 December 2022. e, Analyses from the Flatiron Health database evaluating the hazard ratio for the risk of progression to metastatic lung disease among patients with breast cancer who developed COVID-19 disease versus those who did not, adjusted for age, race and ethnicity (red) and multivariate analyses after also including co-morbidities, breast cancer subtype (for example, ER status) and other potential confounding factors (blue). All box-and-whisker plots are shown as maximum value (top line), median (middle line) and minimum (bottom line) with all data points shown as dots. Source Data
Extended Data Fig. 1
Extended Data Fig. 1. Comparison of MMTV-Her2 and WT response to IAV infection and analysis of mammary glands, circulating blood.
Weight change of MMTV-Her2 and WT mice post-IAV infection, error bars denote standard deviation (a) (n = 3/group). Total cell counts in BALF 3, 6, 9, 15 dpi (b)(n = 3/group). IAV lung viral load at 3, 6, 9, 15 dpi or for vehicle control mice (c)(n = 3/group). There were no significant differences between BALF cell counts or IAV viral load between MMTV-Her2 and WT mice. Lungs of an 18-week-old mouse 28 dpi with IAV and a naïve 9-month-old mouse stain with Her2 (green) (d). IF detection of Her2 and Ki67 in mammary glands (e) and quantification of Ki67+ ducts 9 dpi (f) (n = 4/group). Ct values from real-time RT-PCR for transgenic rat Erbb2 mRNA in CD45neg cells in circulating blood from PBS or IAV infected MMTV-Her2 mice at 9 dpi (g). IF for p53 and Ki67 (with DAPI) (h) and quantification (i) for Ki67 of EO771 tumor lesions (2×10⁵ EO771 cells implanted – left; 1 × 10⁶ EO771 cells implanted - right) (n = 2/group). Significance is determined by one-way ANOVA test. All box-and-whisker plots are presented as maximum value (top line), median value (middle line), minimum value (bottom line) with all data points shown (dots). Source Data
Extended Data Fig. 2
Extended Data Fig. 2. Inflammatory and EMT gene expression changes in DCCs 9 dpi and IL-6 and IL-1β concentration post IAV infection.
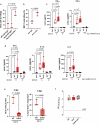
Heatmaps of genes for Interferon Alpha Response (a), Interferon Gamma Response (b), IL6/JAK/STAT3 Signaling (c), and Epithelial Mesenchymal Transition (d) pathways from RNA-seq for DCC comparing PBS to IAV at 9 dpi. Concentrations of IL-6 and IL-1β in BAL from MMTV-Her2 mice treated with PBS or infected with IAV at 3, 6, 9, 15 dpi (e, f). Concentration of IL-6 in supernatant of mouse tracheal epithelial cells (MTECs) treated with PBS or 24 h post IAV infection (g) (n = 3/group). Significance is determined by two tailed Student’s t test. All box-and-whisker plots are presented as maximum value (top line), median value (middle line), minimum value (bottom line) with all data points shown (dots). Source Data
Extended Data Fig. 3
Extended Data Fig. 3. Primary tumor burden of MMTV-Her2 and IL-6 KO/MMTV-Her2 mice and further characterization of IL6KO metastasis post IAV.
Kaplan-Meier curve for time to sacrifice due to primary tumor burden of MMTV-Her2 and IL-6 KO/MMTV-Her2 mice (n = 4/group) (a). Mice were sacrificed when primary tumors reached 2 cm in diameter; there was not a significant difference between the two groups. Quantification of PyMT+ lesions ( ≤ 5 cells) with at least one Ki67+PyMT+ cell in lungs 21 dpi with IAV (b) (n = 3/group, n = 4 for PBS). PyMT+ micrometastases (defined by lesions with an area <0.03 mm2) were quantified (c) (n = 7 WT, 4 IL6–/–); the WT groups are the same as in Fig. 1f, and are included to allow comparison with the IL-6 KO. EO771 cells (2 × 10⁵) were implanted into WT or (n = 3) IL-6 KO C57BL/6 mice (n = 4), infected with IAV, and harvested at 12 dpi, stained with H&E, and tumor area and the numbers of lesions quantified (d and e). Significance is determined by one-way ANOVA test (b,c) or two tailed Student’s t test (d,e). Size of mammospheres from MMTV-Her2 mice per well 72 h post daily treatment with either PBS (CTRL) or IL-6 (10 ng/mL) (f). Size of EO771 derived organoids per well 72 h post daily treatment with either PBS (CTRL) or IL-6 (10 ng/mL) (g) (n = 5/group). Significance by Mann-Whitney tests. All box-and-whisker plots are presented as maximum value (top line), median value (middle line), minimum value (bottom line) with all data points shown (dots). Source Data
Extended Data Fig. 4
Extended Data Fig. 4. Immune infiltration and cell type and collagen analysis of iBALTs post IAV infection.
Counts of immune cells in bronchoalveolar lavage (BAL). Numbers of neutrophils, CD4+, CD8+, and B cells in BAL for mice treated with PBS or 3, 6, 9, 15dpi after IAV infection (a-d) (n = 3 per group. See Supplementary Fig. 3 for flow cytometry gating strategy. Representative IF stain of Her2 (green), B220 (magenta) (e), and GL7 (magenta) (f) in lungs of MMTV-Her2 mice treated with PBS or 28dpi post IAV infection (lung sections from 3 mice per group). Percentages of B220+ area (g) (n = 3/group), CD4+ area (h) (n = 6/group), CD8+ area (i) (n = 3/group), and Her2+ area of parenchyma and iBALT (j) (n = 4/group) at 28 dpi in lungs of IAV-infected mice. Quantitation of the number of iBALT and the fraction of lung occupied at 28 dpi (k) (n = 4/group). Significance is determined by two-way ANOVA test. Representative Masson’s Trichrome stain of lungs 28 dpi (lung sections from 3 mice per group) (l) and quantification (m) (n = 3/group) of the positively-stained area (blue) in parenchyma and iBALT for IAV infected WT and MMTV-Her2 mice. Significance is determined by two-way ANOVA test. All box-and-whisker plots are presented as maximum value (top line), median value (middle line), minimum value (bottom line) with all data points shown (dots). Source Data
Extended Data Fig. 5
Extended Data Fig. 5. Validation of CD4 and Ly6G depletion.
Flow cytometric analysis of CD3+, CD4+ and CD8+ cells in lungs and spleens of WT mice 6 days post injection with 100 μg αCD4 antibody clone GK1.5 (a). The third column shows that the few CD3+ cells that are negative for CD8 persist following αCD4 treatment (demonstrating that the antibody was not simply preventing detection of CD4) (a). Experimental design for antibody-mediated depletion of CD4+ cells, CD8+ cells, or neutrophils (b). Quantification of Her2+ and Ki67+/Her2+ cells in lungs of MMTV-Her2 (IgG) and CD4-depleted MMTV-Her2 mice 9 dpi with IAV (c, d) (n = 4/group). For e-g, mice were injected with anti-Ly6G to deplete neutrophils or IgG control. Quantification of Her2+ cells 28 dpi with IAV is shown in (e) (n = 4/group). IF stains for myeloperoxidase (magenta) (f; 6 dpi) and Her2 (g; 28 dpi). Representative images show neutrophil (myeloperoxidase+) depletion (f) and maintenance of Her2+ cells despite this depletion (g). Significance is determined by two-tail Student’s t test. All box-and-whisker plots are presented as maximum value (top line), median value (middle line), minimum value (bottom line) with all data points shown (dots). Illustration in b created using BioRender (De Dominici, M., https://BioRender.com/i40c047; 2025). Source Data
Extended Data Fig. 6
Extended Data Fig. 6. scRNAseq cell type markers and quality control.
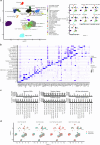
UMAP plot labelled by cell type (a, left). UMAP plots of each experimental group (a, right). Dot plot showing the expression of canonical marker genes used to identify the cell types (b). Quality control of the scRNAseq data set: distribution of UMIs, genes and mitochondrial transcripts within each sample pre-filtering (upper panel) and post-filtering (lower panel) with dashed lines indicating the filtering thresholds (c). Mice at 9 and 15 dpi with the replicates within each group highlighted (demonstrating reproducible patterns) (d).
Extended Data Fig. 7
Extended Data Fig. 7. Mitochondrial OXPHOS pathway changes across all cell types and analysis of T-cells following IAV infection with or without DCCs or CD4 depletion.
The top heatmap in (a) displays statistically significant changes in custom mitochondrial OXPHOS pathways, ranked by normalized enrichment score (NES) and identified through fGSEA analysis. Only pathways with a false discovery rate (FDR) < 0.25 are shown. The bottom heatmap shows individual log2(Fold-Change) values for custom innate immune genes across the experimental groups: Her2+IAV vs. HER2 + PBS, Her2+IAV vs. WT + IAV, and Her2+IAV+anti-CD4 vs. Her2+IAV. All genes are included, with statistical significance marked by * for adjusted p-value < 0.05 and # for raw p-value < 0.05. Note that for groups with depletion of CD4+ cells using anti-CD4 antibody, the residual cells in CD4+ effector, CD4+ memory and regulatory T-cell clusters expressed minimal CD4, and thus are not analyzed. Flow cytometric detection of Cxcr4 and western blotting for Dusp5 protein (b) (n = 4/group). Heatmap of top 20 differentially expressed genes from scRNAseq comparing CD4+ memory T-cells (c), CD8+ effector T-cells (d), CD8+ memory T-cells (e) in MMTV-Her2+IAV versus WT + IAV mice at 15dpi. Proportion of T-cell subtypes identified in scRNAseq (f). Mean fluorescence intensity of MitoTracker stain in CD4+ and CD8+ cells (g) (n = 4/group) from lungs of 15 dpi IAV infected WT or MMTV-Her2 mice. Significance is determined by two tailed Student’s t test. CD4 and CD8 cell populations used to gate for MitoTracker staining (h) (n = 4/group). All box-and-whisker plots are presented as maximum value (top line), median value (middle line), minimum value (bottom line) with all data points shown (dots). Source Data
Extended Data Fig. 8
Extended Data Fig. 8. Mitochondrial OXPHOS pathway changes across T-cells following IAV infection with or without DCCs or CD4 depletion.
The top-left heatmap illustrates statistically significant changes in custom mitochondrial OXPHOS pathways, ranked by normalized enrichment score (NES) and determined through fGSEA analysis. Only pathways with a false discovery rate (FDR) < 0.25 are displayed. The remaining heatmaps depict individual log2(Fold-Change) values for mitochondrial OXPHOS complex genes, comparing the experimental groups: Her2+IAV vs. HER2 + PBS, Her2+IAV vs. WT + IAV, and Her2+IAV+anti-CD4 vs. Her2+IAV. All genes are displayed, with statistical significance indicated by * for adjusted p-value < 0.05 and # for raw p-value < 0.05. For groups with depletion of CD4+ cells using anti-CD4 antibody, the residual cells in CD4+ effector, CD4+ memory and regulatory T-cell clusters exhibited minimal detection of CD4, and thus are not analyzed.
Extended Data Fig. 9
Extended Data Fig. 9. Interferon response across cell types and GSEA of macrophage populations.
Over-representation analysis heatmaps comparing the indicated samples across all cell types for interferon α (a) and γ (b) response enrichment at 15 dpi. * denotes significant change in the pathways. GSEA analyses and heatmaps of top 20 differentially expressed genes comparing M1, M2, and migratory macrophages in MMTV-Her2+IAV versus WT + IAV mice 15dpi (c, d). Proportion of macrophage subtypes identified in scRNAseq samples (e).
Extended Data Fig. 10
Extended Data Fig. 10. Comparison of interferon concentrations and GSEA analysis CD4 and CD8 T-cells post IAV with or without DCCs.
GSEA analyses comparing CD4+ effector T-cells, CD4+ memory T-cells, CD8+ effector T-cells, and CD8+ memory T-cells in MMTV-Her2+IAV versus WT + IAV mice at 15dpi (a). Concentrations of IFN-α, IFN-β, and IFN-γ in BAL at the indicated times post-IAV infection (b) (n = 3/group). Significance is determined by two-way ANOVA test (b). GSEA analyses of CD8+ memory T-cells in CD4-depleted MMTV-Her2+IAV versus MMTV-Her2+IAV mice at 15 dpi (c). All box-and-whisker plots are presented as maximum value (top line), median value (middle line), minimum value (bottom line) with all data points shown (dots). Source Data
Extended Data Fig. 11
Extended Data Fig. 11. CD8+ cytotoxic assay and analysis of SARS-CoV-2 MA10 infection.
Ex vivo CD8+ cytotoxic assay where Her2+ mammary tumor cells were incubated with CD8+ cells enriched from lungs of WT, MMTV-Her2 mice, and MMTV-Her2 mice with CD4 depletion at 15 dpi (a) (n = 3/group). Ex vivo CD8+ cytotoxic assay where PyMT-expressing MET1 cells were incubated with CD8+ cells enriched from lungs of MMTV-Her2 mice with or without CD4 depletion 15 dpi (b) (n = 3/group). Concentrations of IFN-α, IFN-β, IFN-γ, IL-1β, and IL-6 in BAL at the indicated times post-MA10 infection (c, d). Quantification of Her2+ cells and percentage of Ki67+/Her2+ cells in lungs of MMTV-Her2 mice without (WT) or with IL-6KO 3 dpi (e) (n = 3 WT, 5 IL6KO). Infectious SARS-CoV-2 MA10 burden 3dpi with MA10 in lungs as quantified by plaque assay (f) (n = 6/group). Significance is determined by one-way ANOVA test (a,c,d) or two tailed Student’s t test (b,e). All box-and-whisker plots are presented as maximum value (top line), median value (middle line), minimum value (bottom line) with all data points shown (dots). Source Data
Extended Data Fig. 12
Extended Data Fig. 12. DCC cell state changes following SARS-CoV-2 MA10 infection and summary representations of epidemiological studies.
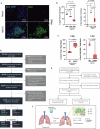
IF stain of Her2 at 28 dpi (a) for C57BL6/J MMTV-Her2 mouse lungs at 28 dpi with MA10 SARS-CoV-2 or vehicle (mock). Quantification of vimentin+/Her2+ and EpCAM+/Her2+ cells 3- and/or 9-dpi in FVB MMTV-Her2 (b) (n = 3 PBS, 3 dpi, n = 4 at 9 dpi) and without (WT) or with IL6KO (c) (n = 4/group 9 dpi, n = 3 WT at 3 dpi, n = 5 IL6KO at 3 dpi). Significance is determined by one-way ANOVA test (b, left) or two tailed Student’s t test (others). Summary representation of the selection, exclusion, and matching criteria implemented for UK Biobank (d). Summary representation of the selection, exclusion, and matching criteria implemented for the Flatiron Health Database (e). Model - pulmonary virus-dependent increases in IL-6 contribute to the awakening and expansion of dormant mesenchymal-like breast cancer cells that switch to a mixed epithelial/mesenchymal-like phenotype in lungs in the early phase of viral infection. CD4+ cells maintain the expanded breast cancer cells in late phase of viral infection through suppressing CD8+ cells. Virus-dependent awakening and expansion of DCC in the lungs increases the risks of metastatic progression (f). All box-and-whisker plots are presented as maximum value (top line), median value (middle line), minimum value (bottom line) with all data points shown (dots).Illustration in f created using BioRender (De Dominici, M., https://BioRender.com/yxpclmg; 2025). Source Data

Update of

References

    1. Siegel, R. L., Miller, K. D. & Jemal, A. Cancer statistics, 2020. CA Cancer J. Clin.70, 7–30 (2020). - PubMed
    1. Newton, A. H., Cardani, A. & Braciale, T. J. The host immune response in respiratory virus infection: balancing virus clearance and immunopathology. Semin. Immunopathol.38, 471–482 (2016). - PMC - PubMed
    1. Tan, L. Y., Komarasamy, T. V. & Rmt Balasubramaniam, V. Hyperinflammatory immune response and COVID-19: a double edged sword. Front. Immunol.12, 742941 (2021). - PMC - PubMed
    1. Soni, A. et al. Breast cancer subtypes predispose the site of distant metastases. Am. J. Clin. Pathol.143, 471–478 (2015). - PubMed
    1. Phan, T. G. & Croucher, P. I. The dormant cancer cell life cycle. Nat. Rev. Cancer20, 398–411 (2020). - PubMed

MeSH terms